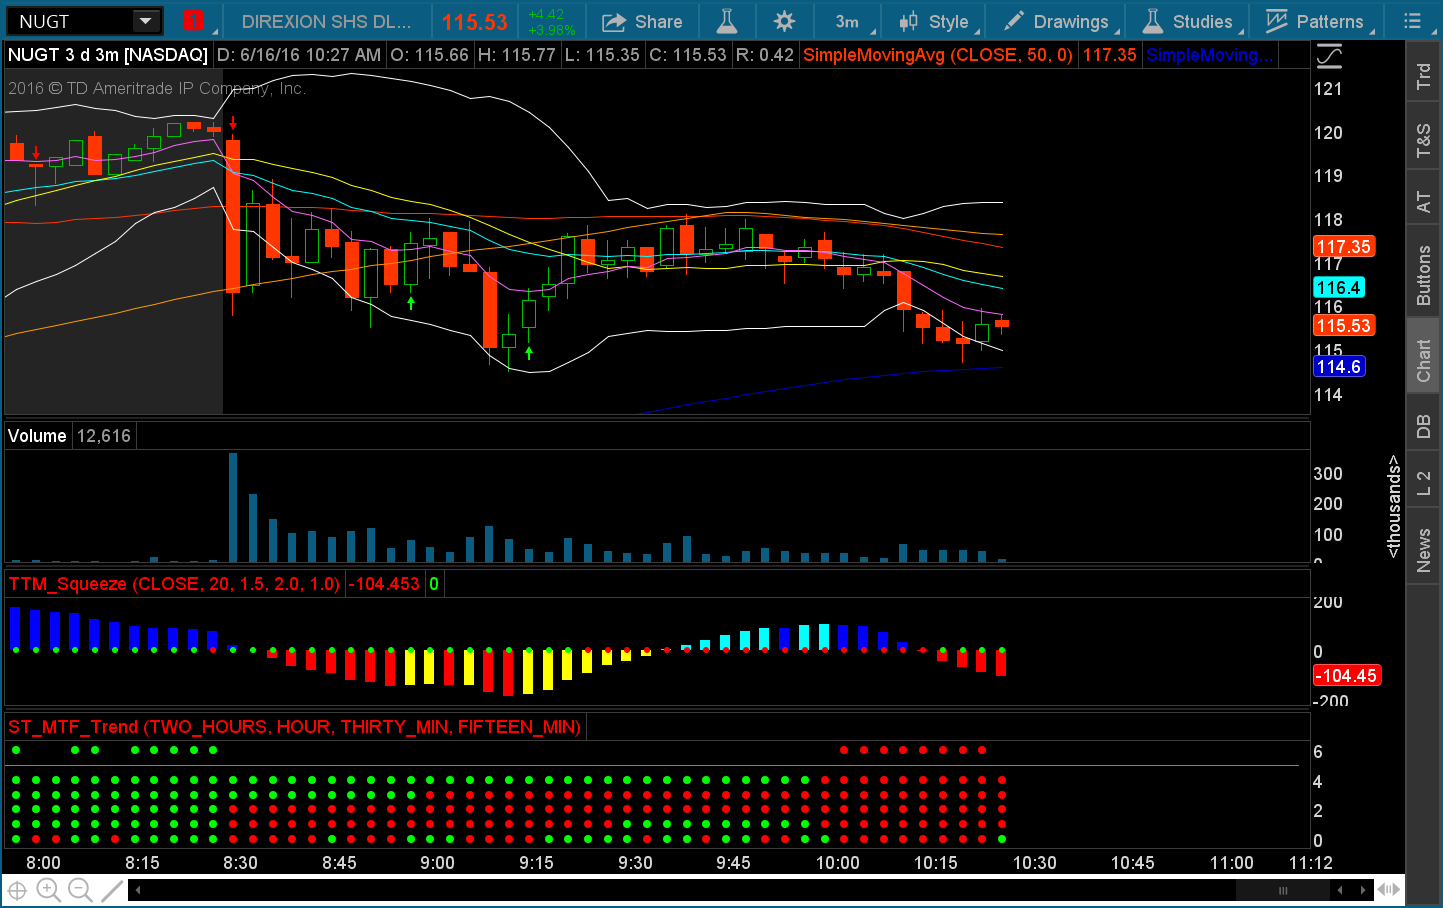
Got this recently…seems kinda cool. The red/green dots at the bottom signal bearish or bullish on each of the next 4 higher time frames based on the time frame of the current chart. Haven’t quite figured out exactly how to trade it since I missed most of the webinar Saturday. Hoping to catch up over the weekend…seems like it could be a powerful tool combined with the squeeze indicator.