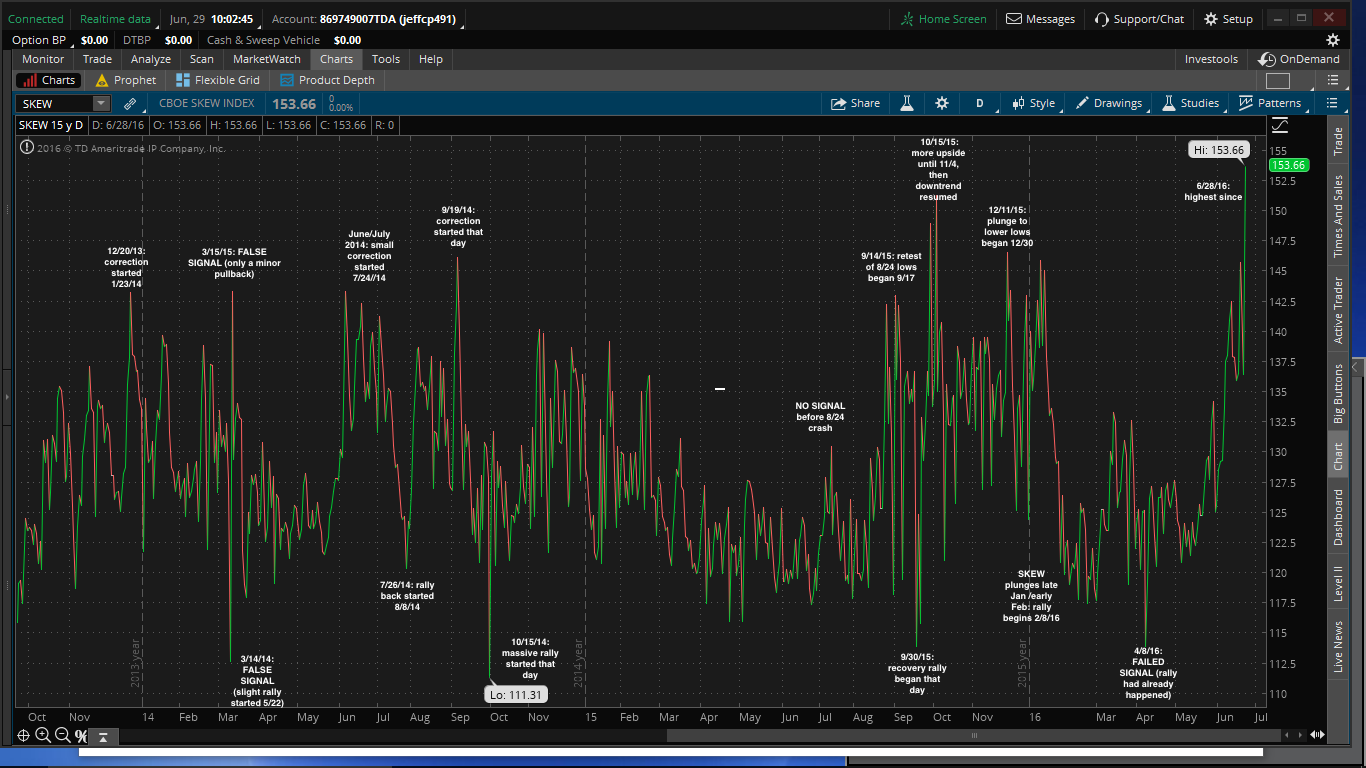
Below I’ve compiled a daily chart of the SKEW since 2013 to show how accurate it can be. Most peaks in the SKEW (above 140) are followed by corrections. We don’t always get a signal; the August 2015 crash was preceded by no SKEW peak. But when it does peak, a correction almost always follows. Slightly less reliable but still significant are signals below 120… we usually get a strong rally. 10/15/14 and 9/30/15 are good examples, with rallies beginning the very same day that brought us back to pre-correction highs.