
I never would have believed I would have to do this
Rolled 1 SPY 04/04/2025 516/521 Bull Put Spread to 1 SPY 512/520 04/07/2025 Bull Put Spread at $0.19 Credit
Hoping for a bear market rally soon
Daily Archives: Friday, April 4, 2025
Nibbling on some higher yield stocks
TROW at $83.00
SWK at $60.00
VTRS at $8.00
LYB at $60.00
TGT at $91.00
BBY at $60.00
UPS at $100.00
PSX at $99.00
#SP500 #FallingKnife – off a cliff today
T2108
Worden T2108 (% of stocks above the 40 day moving average) currently at 7.61, was as low as 6.56 intraday.
QQQ
#longLEAPs BTO QQQ 12/17/27 $270 call @ $190
Still buying, going deeper ITM down to the .90 Delta
Underlying hovering around $425
Rolling AMZN
Rolled $AMZN Apr 4 190 puts out to Apr 25 190 puts @ 3.10 credit.
Total credit in position: 4.36
$AMZN Apr 4 200 puts were assigned overnight. Sold the stock and rolled out to 4/25 200 puts for 1.11 credit.
Total credit in position: 3.35
COST AMZN MSTR
SPY
$SPY short term line in sand
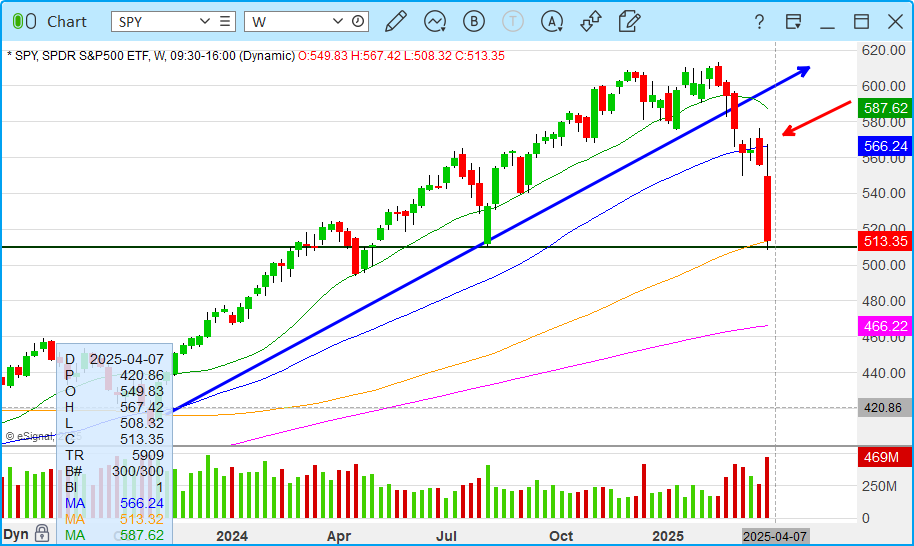
SPY
Rolling rest of April out but not down. Still decent basis reduction.
Rolled SPY Apr 17 2025 535.0 Put to May 16 2025 535.0 Put @ 5.75 credit (8.90 total now)
Rolled SPY Apr 17 2025 540.0 Put to May 16 2025 540.0 Put @ 4.25 credit (7.70 total now)
Rolled SPY Apr 17 2025 545.0 Put to May 16 2025 545.0 Put @ 3.25 credit (6.90 total now)
Rolled SPY Apr 17 2025 550.0 Put to May 16 2025 550.0 Put @ 3.00 credit (6.20 total now)
Rolled SPY Apr 17 2025 555.0 Put to May 16 2025 555.0 Put @ 2.75 credit (7.80 total now)
Rolled SPY Apr 17 2025 560.0 Put to May 16 2025 560.0 Put @ 2.50 credit (14.50 total now)
Still profitable for the year…
Still profitable for the year but gave back a lot of the gains for the year.
Fibonacci approaching a 268% retracement. My thought is if that holds we might have a good entry point. If not next stop down is probably around 4950 as the closest round number. Actual number probably 4963.
Cash is a position, trade smart!
Actually I am trying to throw on some SPX butterflies but there is no liquidity and most the $5 increment options have not traded so I cannot get a fill anyway.
Market looked at the T2107…
Market
looked at the
T2107 from TC2000 just 15 % of stocks are above the 200 day average, June ’22 and of course beginning of ’22 were lower.
T2108 just 8.8% of stocks are above the 40 day moving average. June ’22 was 8.02 and there was early ’20 were it was at about 1.53% .
Both haven’t shown a reversal sign as of yet. The down move can still continue. I will remain in cash as much as possible and not yet enter any trade in hope of a reversal.
SPX 0-dte trades for 4/4/25
#SPX0dte Sold to Open $SPX Apr 4th 5010/5030-5410/5430 condors for 1.50, IV 85.13%, deltas -.06 +.07
March Jobs Report
#Jobs — More gains, UE ticks higher
Gain of +228,000 non-farm payroll jobs, vs. expected gain of 140K
Unemployment up 0.1 to 4.2%
U6 unemployment 7.9%, down by 0.1%
Labor force participation up 0.1 to 62.5%
Average hourly earnings up by 0.3%; +3.8% Y/Y
February jobs revised down by -34K to +289K
January jobs revised down by -14K to +111K
