
There were squeezes in the 39, 78, and weekly charts which fired long.
The daily chart hasn’t fired yet, so I bought some Jul 8th 72 Calls this morning for $1.05.
Author Archives: prvtrader
Is BRexit scare over ?
All of a sudden the SPX took flight…what happened?
SPX Iron Condor with a Twist
STO Jul 20 SPX 2090/2115 BeCS for 3.25
STO Jul 20 SPX 1930/1905 BuPS for $3.10
BTO Jul 20 SPX 2040/2045 BuCS for $2.45
OIL…
Bought a few shares of OIL at $6.15.
The stop at $5.83
PCLN hit hard
PCLN is down $129.20 or 9.3% this morning.
DIS Squeeze and Pre-Earnings Trade
BTO Aug 19 DIS 100 Calls at $2.35; earnings is Aug 9th and it is on a squeeze, and it is at support, so it may bounce up from here. Fib levels are at around 102 (38.2%) and 100% of previous move, so it may hit that level….My Delta position is 137 so it should make some money if it goes to that level. Time decay is not that bad and if it stagnate, it can be turned into a Calendar or a Diagonal to lower the cost. Earnings should make this expiration to increase in IV and this is a Vega positive position.
BREXIT – All you need to know.
http://www.bbc.com/news/uk-politics-32810887
http://durableportfolios.com/UK-European-Union-Referendum?gclid=Cj0KEQjw1v66BRCV-6rh6s-Biu8BEiQAelpuiwdHYz1Ix48GKw49kggucYLzvsxldcBdua8WO3Lr6bYaAr8x8P8HAQ
http://www.cato.org/blog/britain-leaves-eu-will-implode?gclid=Cj0KEQjw1v66BRCV-6rh6s-Biu8BEiQAelpuiy2OfPPS3ahIw8jg6UcMiw_J7dFo5w3HOY23LOF3mSQaAgMv8P8HAQ
Out of FB BWBF…
STC Jun 17 FB 113/115/119 BW BF for $2.36 crd; Bought on FR for 1.16
Closing GS BePS
STC GS 150/160 BePS for $6.10 Bought it for $4.15 on Tue. 🙂
STC MA Calls for $0.88; had bought it for $1.90 yesterday….:-(
SPX Chart…
For those of you trading the SPX. 
Two Squeeze Plays; FB and MA
FB is on a squeeze on almost every time frame chart. It seems to want to come down, so I bought a BW Put BF for next week expiration 113/115/119 for $1.16; that is my max risk $116 pp. This trade will make money as long as FB finishes below the 117.87 BEP. Mort gave me the idea and I went with it.
Now MA looks like it wants to move higher since the squeezes in the 39 min and 78 min charts have all fire to the long side. So I bought some Calls; BTO Jun/24 MA 96.5 Call for $1.90.
LVS Squeeze
STC Jun 24th LVS 45 Call at $2.85 bought last Wed for $2.05.
It fired yesterday but today is not working as it should so I took the profit.
BePS on GS
GS is on a squeeze on the daily and weekly chart.
BTO Jul 16 GS 150/160 BePS for $4.15
I believe that if the Feds don’t rise interest GS may retest the Jan 20 lows.
SPX and Double Calendars Closing
BTC Jun 30 SPX 2135/2160 for $4.65 Sold for $6.15 on 5/11
BTC Jun 30 SPX 1970/1995 BuPS for $1.65 Sold for $8.30 on 5/5.
STC Jun 6/Jun 10 AMBA Double Calendar for $4.08 Bought yesterday for $0.80
STC Jun 6/Jun 10 AVGO Double Calendar for $0.92 Bought yesterday for $1.40
STC Jun 6/Jun 17 KORS Double Calendar for $2.06 Bought on 5/31 for $0.55
AVGO Double Cal.
BTO Jun3/Jun10 146P and 162.5C for $1.40
LVS on a daily Squeeze
BTO Jun 24 LVS 45 Calls at $2.15 at the open…
AMBA Double Calendar for tonight earnings.
BTO double calendar consisting of Jun 3 – Jun 10 38 Put and 43 Calls for $0.60 pp.
KORS double Calendar for tonight earnings.
Jun 3/ Jun 17 – 39.5 Puts and 44 Calls for $0.50 pp.
SPX Today….
This is my take on the SPX for today…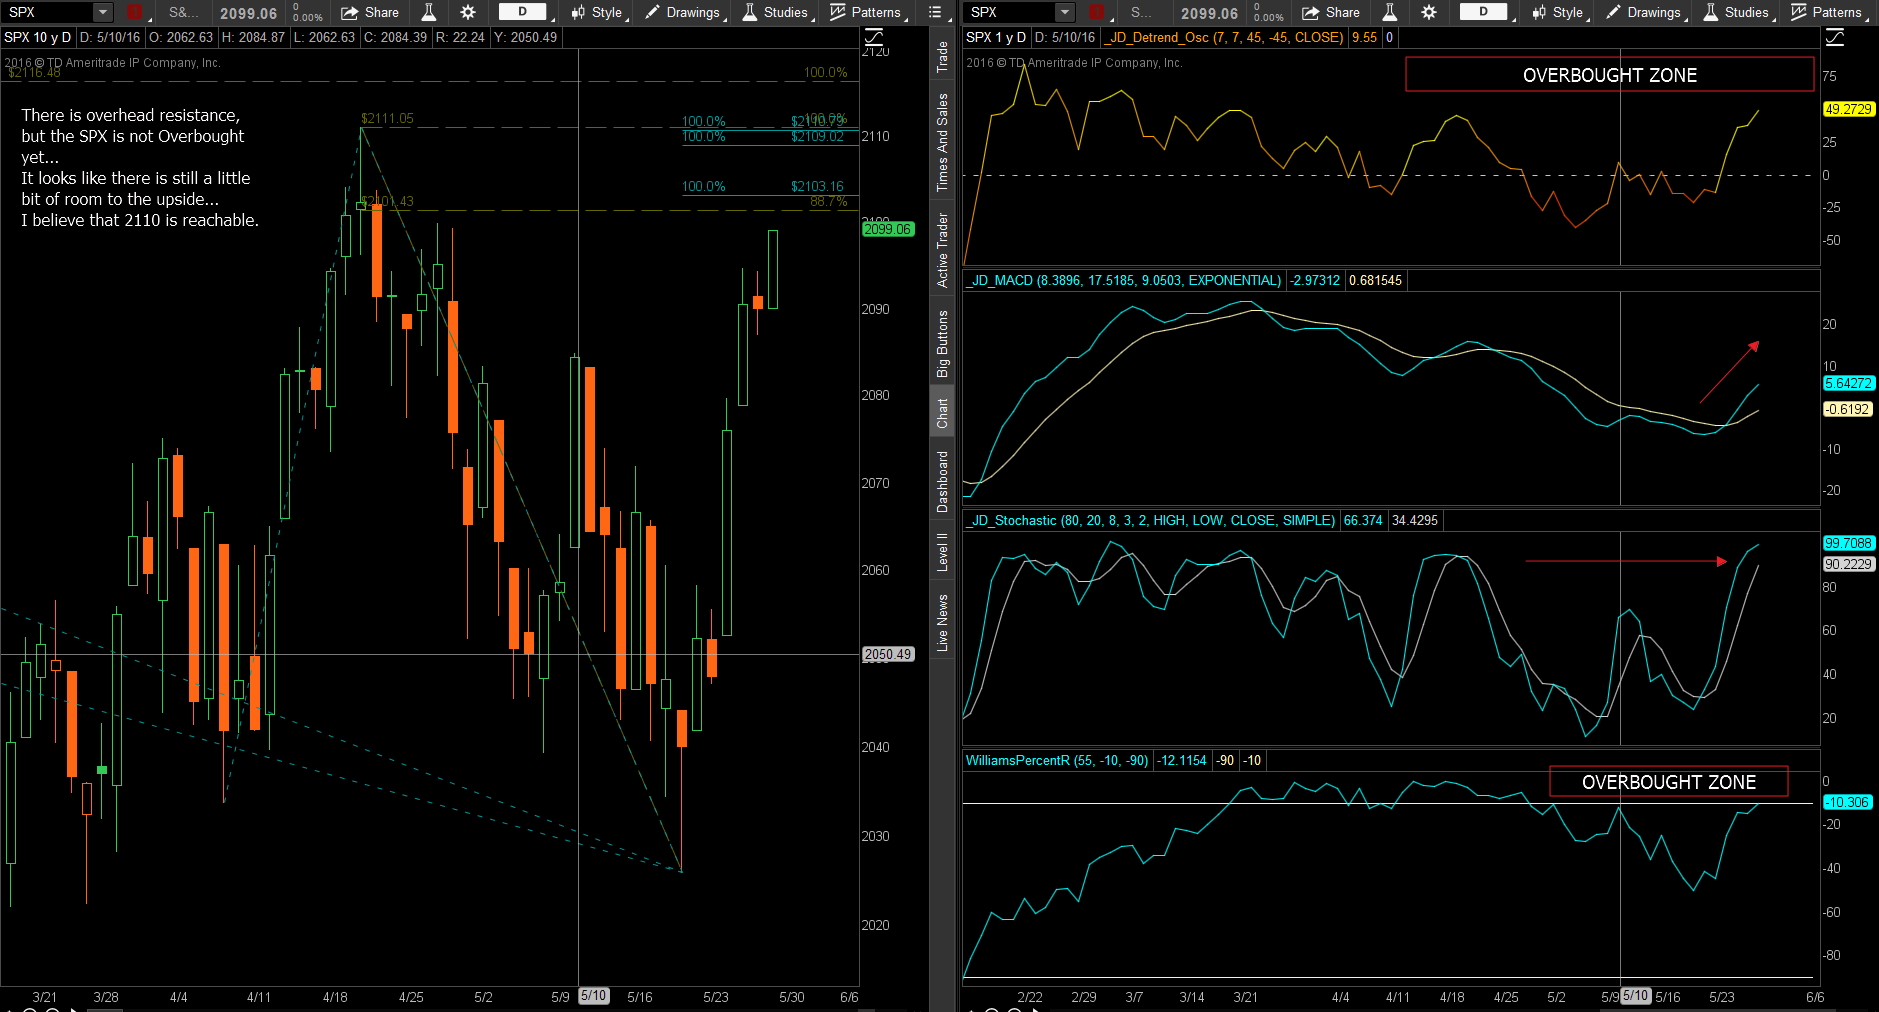
Market doesn’t seem to have conviction and direction
Like last year, the market staying at a shallow trading range; Jeff’s system is great for this market condition. Last year we made a bunch of money, until Aug, when the bottom fell off.
SPX Squeeze observation.
There is a squeeze in progress in the SPX monthly chart.
In the past, each time that it happened the SPX went to make huge moves.
5/08 down; 9/00 down; 3/95 up; 2/91 up; 1/84 up. It doesn’t happen often, but when it does, the SPX moves big. Missed the 7/2012 squeeze which lasted for 2 months and went up after if fired for 3 years.
It looks like the SPX…
It looks like the SPX is still stuck between 2110 and 2040; for now, but the chart looks like a descending triangle.

Transports and Oil holding the…
Transports and Oil holding the bulls down…maybe another day of nothing…which is great for Theta decay….
Daily Squeeze on SMH
BTO May 20 53 Calls for $2.10
Does it pay to sell Options before the Weekend?
TT did a study…
https://www.tastytrade.com/tt/daily_recaps/2016-04-27/episodes/selling-options-capturing-weekend-decay-04-27-2016
Follow the link.
Another SPX BePS
BTO May 20 SPX 2040/2015 BePS for $4.10
An SPX Bearish Debit Spread.
BTO Jun 3rd 2016 SPX 1980/1955 BePS for $2.30
The idea is not to hold it to expiration but to make maybe 50% on a market dip….
The max loss is $230 the max win is $2,270….It is a very long shot, but heck there has to be a dip before expiration with the market being overbought and all.
SPX at Resistance.
SPX is hitting strong resistance at 2080ish. Yesterday’s high of 2087.84 happens to be the 100% extension of two previous up moves….Next Resistance is at 2098-2101 level.
Main Support is at 2000 and at 1980-82
A Little FB Trade
STO May 13 FB 105/101 BuPS for $1.18
We’ll bail if FB reaches 105
I’ve been very quiet because…
I’ve been very quiet because we are getting in the earnings period and squeezes don’t work very well. So from now until the end of the earnings period, I’ll be just looking at ETFs.
If I would have been paying attention, I would have been able to catch the NUGT move up…it was on a squeeze for a while. Well next time.
NUGT stopped me out.
Closed the short NUGT Call for $7.20 and sold it for $3.80…That is a $3.40 loss…”Not Cool”
NUGT Trade
STO May 13 NUGT 95 Call at $3.80
Just getting one for now…
QQQ two trades; same objective.
BTO May 20 QQQ 111/108 BePS for $1.12
BTO May 20 QQQ 112/109 BePS for $1.32
DIS Trade
BTO Apr 15 DIS 96 Calls at $2.07 ea. debit.
Assuming will close yesterday’s gap.
SCTY Short Squeeze?
SCTY has been going up today like a rocket. The short float is at around 40%, so it could be a “short squeeze”
I have no position.
DIS Loss…:-<
BTC DIS 97/93 BuPS for $1.10 Sold for $0.52;
EA BeCS
STO EA 160429 67.5/69.5 BeCS for $0.52 crd.
EA is on a squeeze and has tried to penetrate the 67.5 level 3 times and failed. There is a higher probability of EA going down as it has done on the previous two similar up moves.
My expected target is the 61.8% retracement of this up move, which is the 58.12 level.
Earnings in 31 days on Thu May 5 AMC. This position will expire in 25 days, so no IV increase due to earnings.
Will get out if EA closes above 67.33
Why we trade from the Short Side (mostly)
Most, if not all of us, like to trade predominantly from the short side; do you know why?
The real reason is not that it is easier or that Theta decay works for the position; even though those are all valid.
The real reason is because normally, when trading from the short side we have a better probability to win than when trading from the long side.
Any stock, ETF, or Index can only move in 5 different ways:
1. Fast up
2. Slowly up
3. Stagnant
4. Slowly down
5. Fast down.
When we are short, we win in 3 out of the 5 and possibly even on 4 of the 5; when we are long, we need the underlying to move otherwise we lose, so we only win in 1 out of the 5.
If only I would have known this two years ago!
DIS Trade.
BTO May 6 96C and STO Apr 22 101 Call for $3.58; this is a Diagonal.
To pay for that. STO Apr 22 97/93 BuPS for $0.52 crd pp.
Position makes money if Dis finishes above 97 on 4/22….and the 96C for May 6 will still be there for free.
Almost forget: DIS is on a Squeeze on the daily chart.
SPX Support and Resistance Levels for Thu Mar 31, 2016
Support: 2053-55, 2046-48, 2040-41, 2030-32; 2018-2020; 2008-10; 2000-05
Resistance: 2070-75; 2082-84; 2090-2092; 2098-2102; 2120-22; 2134-36
YHOO Loss
BTC YHOO 36/38 BeCS for $0.95 Sold for $0.50 yesterday…a $0.45 loss!
The Importance of the Greeks!…
Back when I was taking my first options course, I remember the instructors emphasizing how important the Greeks were in trading options.
The truth is that, at the time, they didn’t look so important to me.
Well, after reviewing a lot of losing trades as well as some small winners, I found that most of my losers and those winners were I made very little, were due to not matching the right strategy with the market conditions; basically, the root of the problem was not watching the Greeks when placing the trades.
The majority of my problems came from trying to fit the wrong strategy for the market conditions at the time. Like selling credit spreads on a low volatility environment; buying options or debit spreads on a high volatility period; Using Iron Condors when the market was running hard. Using debit spreads on a squeeze; using Calendars or Diagonals on decreasing IV periods.
I wonder how much money I would have saved, by just looking at the damned Greeks!
What about you guys; do you watch the Greeks before placing a trade?
Interesting Article from a Fund Manager.
The Big Picture … Market Perspectives
By Bryan Rich
March 29, 2016, 3:30pm EST
There are two signficant events this week for markets. One came today. The other comes Friday (the employment report) which we’ll talk about later in the week.
First, today, Janet Yellen (the Fed Chair) gave a prepared speech in New York and answered questions. This is the first time we’ve heard from Yellen since the Fed surprised the market on March 16, by removing two (of what was previously four) rate hikes from their projections for the year.
In this environment, as we’ve said, by telegraphing a “less tight” policy, that’s effectively easing. And that has enormous ramifications for markets and the economy.
Still, the Fed’s action was just another leg in the coordinated policy response, by global central banks, to the bust in oil prices and the threats that it represented (i.e. bankruptcies, defaults, banking instability).
From the moment oil hit $26, the central banks have circled the wagons. The BOJ has acted (currency intervention), the ECB has acted (QE+), China (boosting bank lending) has acted and the Fed has acted (guiding a “less tight” path).
Source: Billionaire’s Portfolio, Reuters
The coordinated response from central banks has manufactured a 50% recovery in oil prices (moving many shaky energy companies away from the bankruptcy edge) and has reversed stocks from down on the year, back to positive territory.
So with this backdrop in mind, today, Yellen further cemented an easier stance than the Fed had in December. That further suppressed market interest rates (which maintains the fuel for housing and consumer credit recovery), pushed stocks higher (paper wealth, which makes people feel wealthier – they spend, they hire) and pushed the dollar lower, which underpins the recovery in commodities (further quelling the threat of the oil price bust). Expect that market reaction to continue.
The Fed has made it clear, they want to chase inflation and are happy to get behind the curve. We think we will look back at this Feb-March period (the coordinated actions) as the bottom in monetary policy (i.e. markets, inflation and growth go on a run from here, and global central bank policy ultimately turns from here).
Have a great night.
Regards,
Bryan
NUGT BeCS
STO Apr 29 NUGT 80/85 BeCS for $0.90 credit
SBUX closed
STC SBUX 57.5 Calls at $2.03; Bought yesterday for $1.68…not much but it pays lunch!
NFLX on Squeeze…
BTO Apr 22 NFLX 98.5/104 BuCS for $2.90, that is my max risk. Max profit is $2.60
POS = 2.90/5.5 = 53%
Earnings in 20 Days…may or may not hold through earnings.
YHOO BeCS
STO Apr 15 YHOO 36/38 BeCS for $0.50 at the open. It is at $0.55 now…
SBUX Squeeze Firing this morning.
I closed my Bearish Diagonal on SBUX for a $0.10 loss since FBUX fired long.
I Bought some Apr 8 SBUX 57.5 Calls for $1.68 to catch the move….
AMZN looks Bullish!
Normally I would buy calls when a stock or ETF is on a squeeze, but AMZN is too close to earnings for that.
So, I’m STO Apr 15 555/540 BuPS for $3.05
Thanks rknight52 for posting AMZN move….
SBUX Diagonal
SBUX is having earnings in 29 days; in order to try to take advantage of the IV into earnings I bought a Diagonal Put spread as follows: Bought the Apr 22, 61 Put and Sold the Apr 15, 57.5 Put for a net debit of $2.10
My stop is at $60, otherwise I’ll hold the position until the 57.5 expires or I make 60% of max profit.
Closed $NUGT IC for a…
Closed $NUGT IC for a $6.00 net loss….Well bad timing on my part. I knew it was on a squeeze and sold some puts yesterday, which eroded my Calls profits. Can’t trade against squeezes. They will fire violently
NUGT Short Put
STO Apr 22 NUGT 50 Put at $2.96
Thank Jeff…
NFLX Squeeze…
STO Apr 15 NFLX 103/107 BeCS for $1.18; This is the week before earnings….
RTN Spec. Trade
I did a low risk / high reward trade in RTN…BTO Apr 15 125/130 BuCS for $1.13; which is my max loss. The trade can make $5 – $1.13 = $3.87 pp So my POP is only 1.13 / 5 = 23% but I don’t mind because it on a squeeze and if it fires long I’ll make my profit, and if it doesn’t, well it is small loss.
AAPL Bearish Trade
BTO Apr 8 AAPL 107 Puts at $2.59…I got stopped out this morning when AAPL went up like a rocket, but I still think that it will come down. Big move up was totally rejected.
AAPL, GILD, FB, SPY Trades
Closed the AAPL BeCS for a Loss. Sold on 3/7 for $0.68 Bought for $1.30
Closed some of the GILD Calls for a win. Bought on 3/18 for $2.00 Sold today for $3.22.
Closed the FB Dia for a win. Bought on 3/8 for $5.75; Sold today for $7.50.
Rolled the SPY short leg for a $1.12 Credit.
NUGT question
If GC is down today; why is NUGT up?
GILD Squeeze
BTO Apr1 89.5 Calls for $2.00
SPX Support & Resistance for Fri, Mar 18, 2016
Resistance: 2040-43; 2052-55; 2060-65; 2077-82;2091-95
Support: 2031-30; 2020-16; (1991-89; 1987-86);(1969-67; 1960-56);1950-48; 1930-28; 1901-1898
There are several clusters on the Support side since the price action has been very lively this past week.
From 1991 to 1986 there are several Fib Supports there.
Also from 1969-1956 there are several Fib Retracement and Extensions that are within these numbers.
NUGT Chart
Look at the daily chart for NUGT. It shows a Squeeze forming that could trigger to the upside. 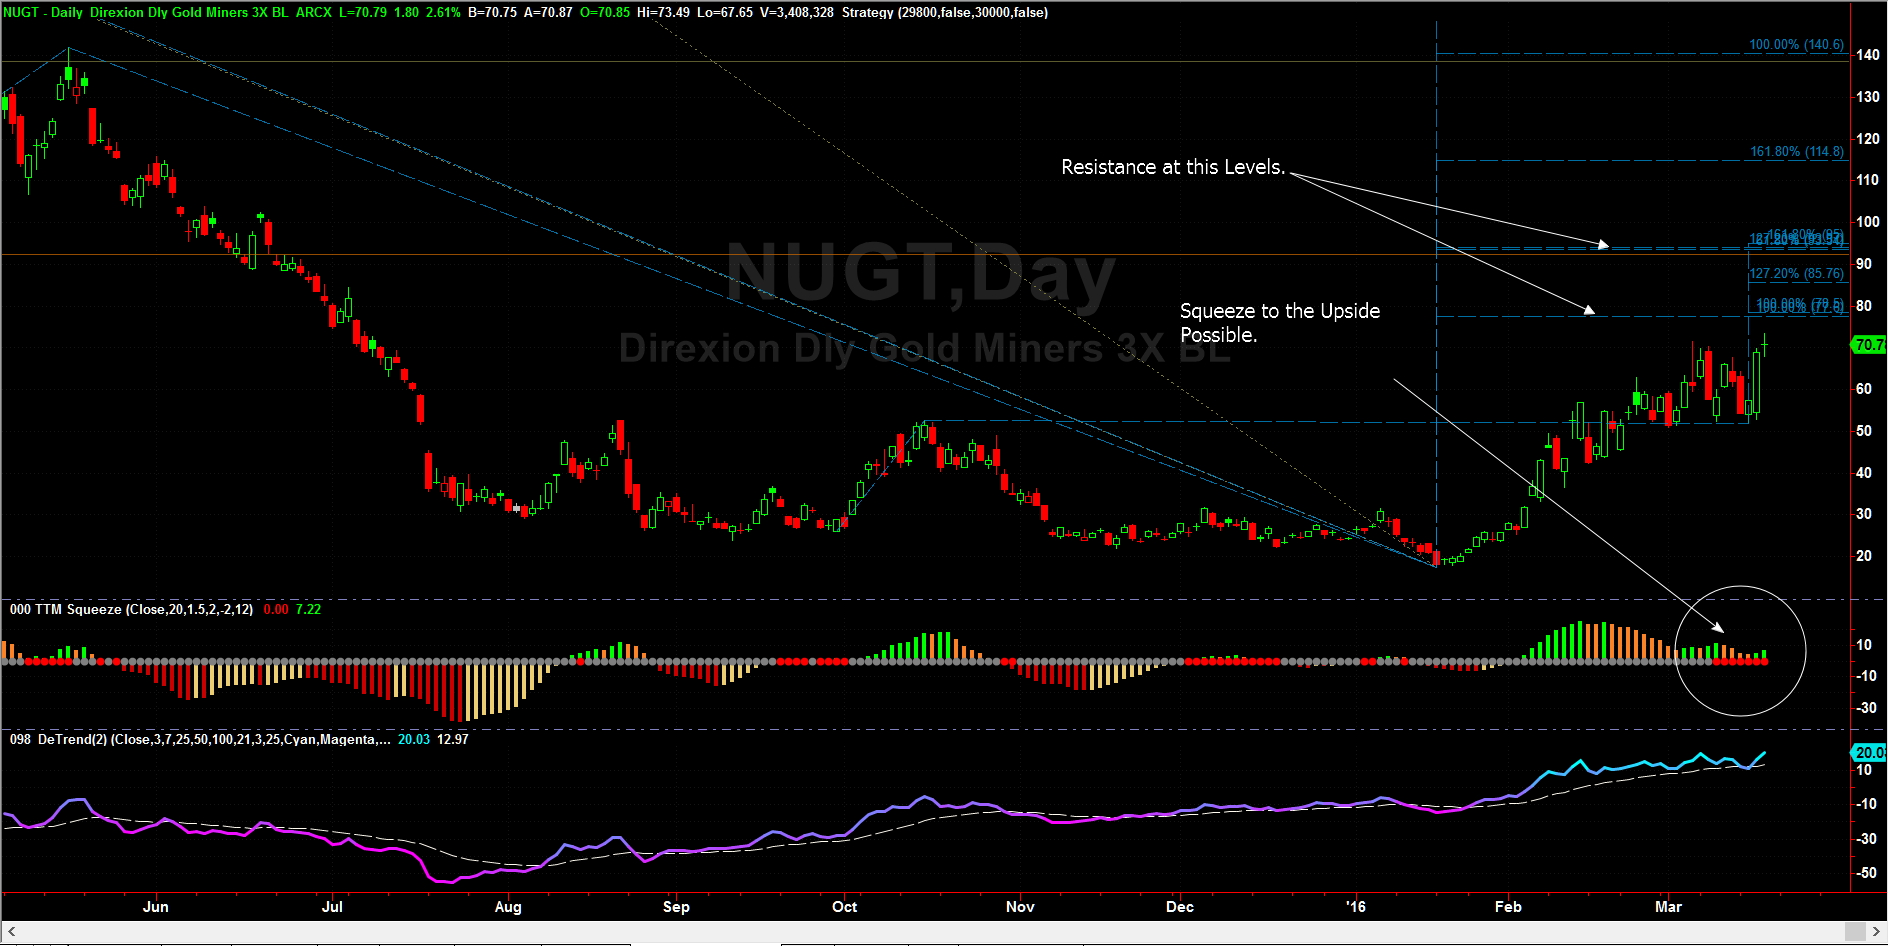
NUGT
STO Apr 22 NUGT 105 Call at $3.20
NUGT Resistance
71.46-72.60; 76.81-77.50 and 83.61-85.45
This levels may hold NUGT but not necessarily reverse it.
SPX Resistance
2028-2030; 2056-60; 2068-70; 2081-85 and 2100
There are others above that, but I don’t think we’ll get that high today….
SLB bearish Diagonal.
BTO SLB Apr 1st 71 Put/ Apr 22 73 Put for $1.74
There is a squeeze and earnings are due in 36 days, Apr 22 is 37 days away…I’m trying to take advantage of the increase in IV due to earnings and the bearish movement.
Fed’s leave rates Unchanged!
and reduced the number of increases from 4 to 2.
EXPE closed
BTC EXPE 105/98 BuPS at $0.65 Sold for $1.35 last week.
I’m using the TT method of getting out with 50% profit or closing the position at a small loss if the price reaches the short strike. So far it is working fine.
What to do when an Option Trade goes against you?
This is an interesting article from Dough Trading.
https://www.dough.com/blog/managing-options-trades
Jeff, I believe that this is something to look at when dealing with the SPX trades.
SBUX on a daily Squeeze
STO Apr 29th SBUX 56/53.5 BuPS at $0.47
PG on Squeeze
STO PG Apr 29th 78.5/75 BuPS at $0.66…
I will add Calls when it decides to start expanding….
GOOGL & LNKD Closed
BTC GOOGL 700/682.5 BuPS at $1.29 sold for $2.54
BTC LNKD 115/110 BuPS at $2.08 sold for $1.50 (ouch). I was long and wrong!
MCD closed
I closed the MCD 116 Calls for $8.30 which I had bought for $5.27…
Also closed the MCD 117/123 Diag for $6.03 for a $1.15 win…..
Happy days are here again!
LNKD on the move…
STO Apr 1 LNKD 115/110 BuPS for $1.50 crd.
STO Apr 1st FB 105/101…
STO Apr 1st FB 105/101 BuPS at $0.58 crd.
When it is Best to Sell an Option and to take Profits.
A nice segment from the guys at Tasty Trade covering time decay and the why they do what they do when selling options.
https://www.tastytrade.com/tt/daily_recaps/2016-03-11/episodes/tips-for-new-traders-the-role-of-time-decay-03-11-2016
It explains why they get out with 50% profit on all short options.
Why they prefer selling higher IV options.
And why they go out 45 days when selling OTM options.
Very interesting.
RTN Trade; Amazing!
That was an amazing trade; bought the options at the high and sold them right at the lows of the day…A quick $200 loss. Now If I could learn to do it in reverse, everything will be fine….:-P
