
BTO Apr 15 RTN 125 Calls at $2.19
Author Archives: prvtrader
MCD Open Interest
MCD OI on the Apr 22nd 116 Call is 24,898 the next higher OI is 82…go figure.
MCD Diagonal
MCD is on a squeeze and moving higher, so I added a Dia
BTO Apr 22 MCD 117 Call at $5.98 and STO Apr 1 MCD 123 Call at $1.10
As there are 41 to earnings the Apr 22nd has 42 DTE, so it should increase in IV while the Apr 1st won’t.
Support & Resistance for Fri Mar 11, 2016
The levels have not changed since yesterday.
Resistance: 2009-2011. 2020-2023. 2030-2032. 2050-2054. 2064-2066. 2080-2082. 2098-2100.
Support: 1978-80; 1962-60; 1956-55; 1933-35; 1909-10; 1886-90;
SPX BuPS Closed
BTC Apr 1st SPX 1750/1735 BuPS for $0.20 Sold for $1.50
GOOGL Credit Spread
STO Apr 1st GOOGL 700/682.5 BuPS for $2.54 Crd.
HON trade Closed
STC Apr 15 HON 105 Calls for $4.85 Bought for $3.75 last week.
USO trade closed
BTC Apr 15 USO 8.5 Puts for 0.15 Sold for 0.55
EXPE Credit Spread.
STO Apr 1st EXPE 105/98 BuPS for $1.32
EXPE is on a daily Squeeze, and began moving up this morning with the market.
Support & Resistance for the SPX on Thu, Mar 10 2016
Resistance: 2009-2011. 2020-2023. 2030-2032. 2050-2054. 2064-2066. 2080-2082. 2098-2100.
Support: 1978-80; 1962-60; 1956-55; 1933-35; 1909-10; 1886-90;
MCD Squeeze
MCD is on a squeeze; Earnings in 43 days. Possible up move since it is on a daily and weekly squeeze. There is a likelihood of an increase in IV due to earnings.
So I BTO the Apr 22 MCD 116 Call at $5.27.
FB Diagonal going into Earnings.
FB earnings are 42 days from now. So to take advantage of the increase in IV I bought a Diagonal.
BTO Apr 22 FB 103 Call and STO Apr 1st FB 110 Call for $5.67
STO Apr 1st USO 10…
STO Apr 1st USO 10 Calls at $0.55; I have some Apr 1st 8.5 Puts so this closes the short strangle. I’ll buy stock if USO goes over 10.25 to cover.
Support & Resistance for Tue, Mar 8th, 2016
Support:
1988 – 1990 Yesterday’s support
1974-78 (K-Node)
1953-59 (K-Node)
1933 (38.2% ret of rally)
1920 (161.8% of previous move down)
1909-10 (50% retracement of rally)
1886-90 (61.8% ret of rally)
Resistance:
2009-2010 (61.8% ret of last drop)
2020-2023 (78.6% ret of last drop)
2050-2055 (K-Node of several moves and ret)
2064-66 (78.6% ret of previous move down)
2080 – previous significant high.
- Ret – retracement.
K-Node is a level where several retracements lines and extensions converge.
STO Apr 29 SPY 206/201…
STO Apr 29 SPY 206/201 BuPS for $2.45
AAPL BeCS
STO Apr 30 AAPL 107/110 BeCS for $0.68
A Correction or a Continuation of the Downtrend on the SPX?
A week ago, all the talking heads were sure that the market was going to 1500; now they are sure that the market is going to go to new highs after this correction…Well, the possible supports are at 1962-60; 1933-30 and 1886-84. The 62-60 level is the 23.6% and if it bounces from there, it may try to push back and retest the 1999-2001 level….The same could be true for the 38.2% retracement…if it breaks through those two, then it will not be a correction, but possibly a continuation of the downtrend….
I wish I had a crystal ball!
Food for Thought:
Vertical Spreads Basics:
Vertical Spreads are Directional plays with predefined risk/reward, normally used as a stock replacement strategy.
Credit spreads have a greater probability of success but higher risk, while debit spreads have a higher reward/less risk.
Credit spreads are better when IV percentile is high while Debit spreads normally work best when the IVp is lower.
TastyTrades Vertical Spreads (credit or debit) Basic Concepts:
https://www.tastytrade.com/tt/shows/tasty-bites/episodes/trading-verticals-06-05-2013
Several other segments talking about credit spreads: (that is a lot of very good free informational education so take a look at it)
https://www.tastytrade.com/tt/search?utf8=%E2%9C%93&search=Credit+spreads&commit=Search
Credit Spread Optimal Setup: (this is a very important segment).
https://www.tastytrade.com/tt/shows/market-measures/episodes/credit-spreads-optimal-premium-levels-10-08-2015
We’ve been placing SPX credit spreads selling Delta 10 and utilizing a spread width from 10 pts. to 25 pts. The reason for this has been that the probability of success is greater the farther out we go; well, that is correct, but only when we hold the position to the end, win or lose.
However, on a Delta 10, 25 pts. spread on the SPX we risk $2,250 to make $150. So to avoid such a big loss, we mostly bail when the loss exceeds 2.5 or 3X the max profit. Once we do that the probabilities of success are not what we expect, but a lot less. So we are shortchanging and lying to ourselves believing that we are trading a high probability, non-directional strategy.
On the last link above, the guys at TT show the right way to trade this strategy.
They go out to 40-45 DTE and use a spread width equal to 2.5% of the price of the underlying and Sell at Delta 30 and get a premium greater than 20% of max loss.
On the SPX the spread width of 2.5% is 50 pts spread. 2000 X 0.025 = 50.
So with the SPX trading at 2000 as per Friday’s Mar 4th 2016 close, to sell a BeCS we will go to Apr monthly and sell the 2045 at $15.30 and buy the 2095 for $2.80 for a credit of $12.50.
Max loss = 5000 – 1250 = 3,750.
Prob. of Success = 3,750 / 5000 = 75%.
I believe this makes more sense.
What do you guys think?
Closed all my BeCS…
No more BeCS…big loss…won’t even roll them to the upside…too much bullishness or short covering.
We’ll wait for the reversal.
Closing Dia on SPY and IWM
STC – SPY 188 Apr 15 / 198 Mar 11 for $9.59 bought for $7.62
STC – IWM 99 Apr 8 / 104.5 Mar 26 for $4.96 Bought for $3.93
STC – SPY Apr 8 189.5 / Mar 26 199.5 for $8.18 Bought for $7.07
SPY Diagonal
Apr 1 SPY 192 Call / Mar 18 SPY 202 Call for a $7.13 Dbt.
OIL purchase
Bought a few shares of OIL at $5.05 this morning. It is on daily squeeze and trying to break to the upside.
Support & Resistance for Thu Mar 3, 2016
Resistance: 1984-86;2010-12; 2023-25; 2030-32; 2050-54;2065-66, 2081-83
Support: 1961-59; 1950-48; 1932-30; 1915-14; 1895-93; 1875-73
Market may thread water to wait for the Jobs Report tomorrow, unless it doesn’t…
AAPL trade
Yesterday I bought some AAPL calls to catch the squeeze expansion…I bought the 95, then an equal number of 98 and 102.
So today when the AAPL wasn’t moving higher I converted the position into a broken wing butterfly by selling one AAPL Mar 18 101 for $1.90 for every long option I had.
If all my long options’ strikes would have been below the 101 strike, this position would have been a regular vertical debit spread…however, since I have a higher strike options at 102, the position becomes a butterfly. What makes it a broken wing is that I have 2 options below the 101 strike for each option that I have above the 101 strike.
What that does to the position is that it caps the max profit but it also reduces my max loss to the cost of the position, and it doesn’t have any upside risk.
This position makes money as long as AAPL finishes above 98.44.
Closing BeCS for loss…
It looks like we are going higher, so I closed 2 BeCS for a loss…Now I got to sell something to makeup the loss, but I won’t be doing any BeCS, so it’ll have to be something else.
Support & Resistance Levels for Wed, Mar 3, 2016
Resistance hasn’t changed from yesterday’s number, except that the 1960 level was taken out by price.
Support 1959-61; 1950-47; 1930-26; 1914 and 1894 etc…
SPX Rally
SPX hitting resistance now at 1971.66…This is a critical resistance level since it is a K-Node from several different retracements and extensions.
Squeeze Trade…
BTO Mar 18 AAPL 95 Calls for $3.50 dbt.
There is a squeeze in AAPL daily chart, and it looks like it is breaking to the upside.
Support & Resistance for Super Tuesday
Resistance 1960-62; 1971-73; 1975-78; 1984-85; 2010-12;2023-25
Support: 1900-04; 1885-87; 1865-69.
Same as yesterday….
New Bearish SPY Diagonal
BTO Apr 15 SPY 202 and STO Mar 24 SPY 189.5 Puts for $7.23 Debit.
Current Economic News.
Euro-area inflation came well below expectations.
China cut its reserve ratio requirements.
The G20 meeting didn’t come up with a viable plan to booster the world economy.
The Germans sovereign debt yields fell once again.
Ireland elections had no clear winner.
Progressive candidates made progress in the Iranian Parliamentary Elections.
Bullish bets on oil increased to the highest level since Nov as hedge funds and other speculators increased their net long positions.
Oil producers operating in Iraq’s Kurdish region fell by as much as 40%
Support & Resistance for Mon Feb 29th, 2016
Resistance 1960-62; 1971-73; 1975-78; 1984-85; 2010-12;2023-25
Support: 1900-04; 1885-87; 1865-69.
Well it was a long…
Well it was a long shot so I’m going to get max loss on the Broken Wing Butterfly on the SPX…$190 going once….
BTO SPY Apr2 189.5 Call…
BTO SPY Apr2 189.5 Call and STO Mar4 199.5 Call for a 8.83 Debit.
BTO IWM Apr2 99 Call and STO Mar4 104.5 Call for a 3.93 Debit.
SPX Resistance for tomorrow Friday, Feb 26, 2016
Resistance for Tomorrow: 1960-62; 1977-1984; 2020-2023; 2031-32;
Support: 1897-96; 1880-79; 1863-62.
A Iron Broken Wing Butterfly…
A Iron Broken Wing Butterfly is normally a credit and it is made by selling A Call and a Put at the same (or close) strike and then buying the wings OTM….The difference between a regular Butterfly and the Iron Bfly is that on the regular Bfly you sell either 2 Calls or 2 Puts and then buy a lower priced Call or Put and a higher priced Call or Put. Normally the higher priced option ends up ITM and becomes somewhat difficult to close.
To make it into a broke wing, you can do either shorten the spread on one side or sell more spreads on one side than the other.
Hope this helps.
STO SPX Feb 26 BWBF…
STO SPX Feb 26 BWBF 1935/1925/1920 for $8.10 Credit Max Loss is $190.
SPX Support and Resistance Levels for Thu Feb 25, 2016
Support at 1916-17 and 1907-09 and then where it turned up yesterday at 1890-94….1897 is a 61.8% of the previous down move and 1876 is the 100% of that move.
Resistance is still at the 1945-47 level…for the SPX to move higher, it needs to break above this level…There is intermediate resistance at 1934-35 and 1939-41 Levels which could slowdown the SPX somewhat.
IMHO, today could be one of those boring days…good for Theta decay.
STC XOP Apr 2nd 27.5…
STC XOP Apr 2nd 27.5 Put for $4.02 Bough for $3.29, since the crude seems to be moving higher now.
Apparently a report that Shell is closing their shale production in the US caused the stir.
So now I’m short the Mar 18 23.5 Puts.
SPX Support Levels
GM. Today’s support levels for the SPX are the same as yesterday’s.
1930-28; K-Node at 1917-20; top of gap at 1896-1900; 1894-95 and 1860-62.
An open question on the UVXY trades.
The UVXY is the Pro-Shares Ultra VIX Short Term Futures ETF…so when the IV goes up it goes up.
So now that the market is going down, and VIX is goin up then the UVXY is moving higher.
But I see you guys selling BeCS on the UVXY.
Could some one tell me please why?
What is the reason for selling BeCS now when by waiting you may get a better price?
I’ve never traded this and would like to understand the reason for your trades.
Thanks,
I’m watching the SPX 1917-18…
I’m watching the SPX 1917-18 Level since it is a Fib K-Node plus it will close yesterday’s gap. That should hold the market for a bit…IMHO.
SPX Support for Tue Feb 23, 2016
Support at 1894-95 and 1860-62 retracement from the 2/11 low to the 2/22 high.
There is also Support at 1928-1930; K-Node at 1917-20 and the top of the gap on 2/17 1896-1900.
Resistance levels are the same as yesterdays.
XOP Bearish Diagonal.
STO Mar 18 23.5 Put and BTO Apr 2nd 27.5 Put Total debit of $2.48 pp
Resistance for Monday Feb 22, 2016
GM
Resistance for Mon Feb 22, 2016
1934
1945-50 K-Node
1960
1970-72
1977-80
2000-2002
2009-2010
2023-25
Support and Resistance Levels for Friday Feb 19, 2016
Good Morning.
Resistance Levels are the same as yesterday’s
1930-35; 1945-49; 1958-61 etc…
Support Levels are:
1884.62 (38.2%) and 1866.16 (61.8%) of previous up move. The 50% (not a Fib level) is at 1870.39
There is the high of Feb 10 at 1881.60 which is very close to the 1884.62 (38.2%); so that area could hold the market.
1850 could be psychological level, but it is not a Fib Level.
Below that we have: 1810-1806; 1800-1803; 1730-1728 and 1690-85
Keep in mind that these levels could hold the market but may or may not be reversal levels.
I failed to post the 23.6 Level of the previous move at 1902.22 and that one as you can see is very close to the 1900 psychological level…
PUT Diagonals IWM and SPY
Opened 2 Put Diagonals…BTO IWM Apr1 105.5 Put and STO IWM Mar18 96 Put for $5.16.
BTO SPY Apr1 199 Put and STO Mar 18 186 Put for $6.64
My stops will be if the SPX breaks above 1948….
Resistance Levels for Feb 18, 2016
1930 – 1935; 1945-49; 1958-61; 1972 and then 2010.44 2028.38 and 2047-53;
Levels to watch are the resistance at 1947.20 which was the high of Feb 1st, and also the 1945-49 which falls on the triangle trend line and the 100% extension of a previous move (Low of 1/20 to high of 2/1).
Yesterday’s move was the expansion of the squeeze on a daily chart. According to theory the move could run from 6 to 8 bars following yesterday’s high. If this is the case the SPX could run up to the Dec Highs and beyond.
I believe that the 1945-49 level may hold the market for this week though…that an $10 will get you a starbucks latte…
Closing SPX BeCS
I closed some of my Mar 11 SPX 1965/1980 at $4.95 Sold it for $1.25 last week…Ouch! Well now that I did this, you can be sure that the SPX will drop! 🙂
I will roll them once the Market decides to slow down this ride.
SPX Resistance for Today.
GM
Resistance today for the SPX: 1898-1900; 1904-1908; 1917-1920; 1930-35 and 1946-50
We’ll probably open above 1900 so that would become support.
Remember that at 2:00 PM the FOMC report today…so it can go either way.
Also FOMC member Bullard is scheduled to speak at 6:00PM EST.
Industrial production rises 0.9% in Jan 0.5% above what was expected…that pushed the futures higher this morning….
Closed SPX BePS
Closed the SPX Mar 4th 1890/1880 for $4.10; bought it for $5.20 on Friday….So I lost $1.10
OPEC News: http://www.bloomberg.com/news/articles/2016-02-16/oil-freeze-iraq-ready-to-cap-output-iran-to-maintain-share
OPEC News:
http://www.bloomberg.com/news/articles/2016-02-16/oil-freeze-iraq-ready-to-cap-output-iran-to-maintain-share
Fibs Resistance at 1878-1880; 1886-1895;…
Fibs Resistance at 1878-1880; 1886-1895; 1925-28; 1935-1945 and 1998-2000.
BTO SPX Mar 11 1895/1880…
BTO SPX Mar 11 1895/1880 BePS at $8.20…There is a K-Node at 1893-95 so I’ll place my stop at 1905.50 to get out if it breaks above the K-Node….The max Loss at that level should be less than $185 pp….
There is a lot of…
There is a lot of resistance above this level on the SPX; there is 1862-65, then 1893-1900 and then 1945-50; if we push over the 1900 level, there may be enough short covering to push it to the next level at 1945-50…Who knows.
Price action today has been really sluggish, but we’ll see.
Today’s SPX supports: Intermediate Supports…
Today’s SPX supports:
Intermediate Supports at 1820-27 and 1806-10 which are 61.8% extensions from previous moves.
Also at 1820 which is from the low of 10/15/14
and 1812 from the low of 1/20/16
As you can see there is a lot of support around the 1820-1810 area.
There is also a major support is at 1803 which is the 38.1% Fib Retracement from low of Jun 4 2012…to high of May 20 2015….
and 1780 which is the 61.8% extension of the previous down move from Dec 29 15 to Jan 20 16.
Below those tighten your seat belts.
Watch the 8 period stochastic, if it starts turning up at any one of these levels it is normally a sign that the level might hold for at least today….
Nice segment today on TT…
Nice segment today on TT about rolling vs not rolling….quite interesting results.
https://www.tastytrade.com/tt/daily_recaps/2016-02-09/episodes/rolling-puts-02-09-2016
It seems that yesterday’s bounce…
It seems that yesterday’s bounce was just that; a profit taking bounce at the end of the day. IMHO, the entire world’s economy is in shambles….it seems that the monetary polices of the ECB and the Feds are not only not working, but sinking the world economy into chaos.
We need a bounce badly….
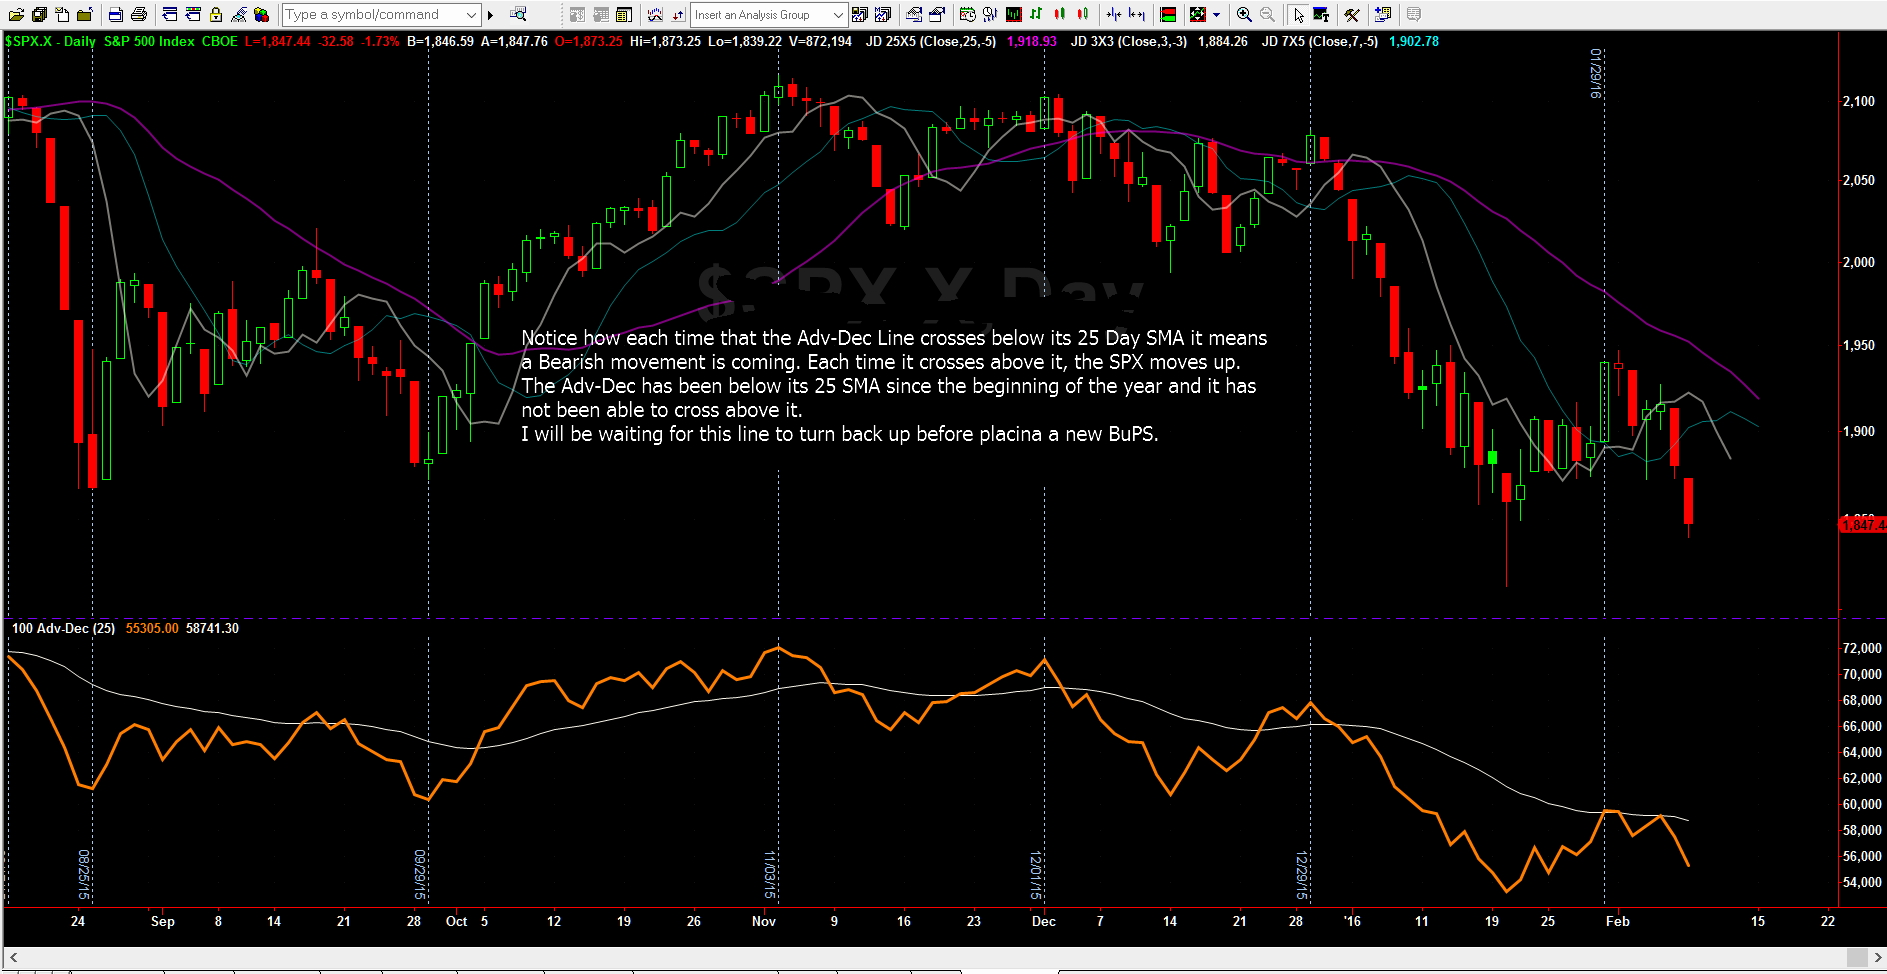
I wanted to post the…
I wanted to post the following two charts which in my estimation are pointing to more downside. 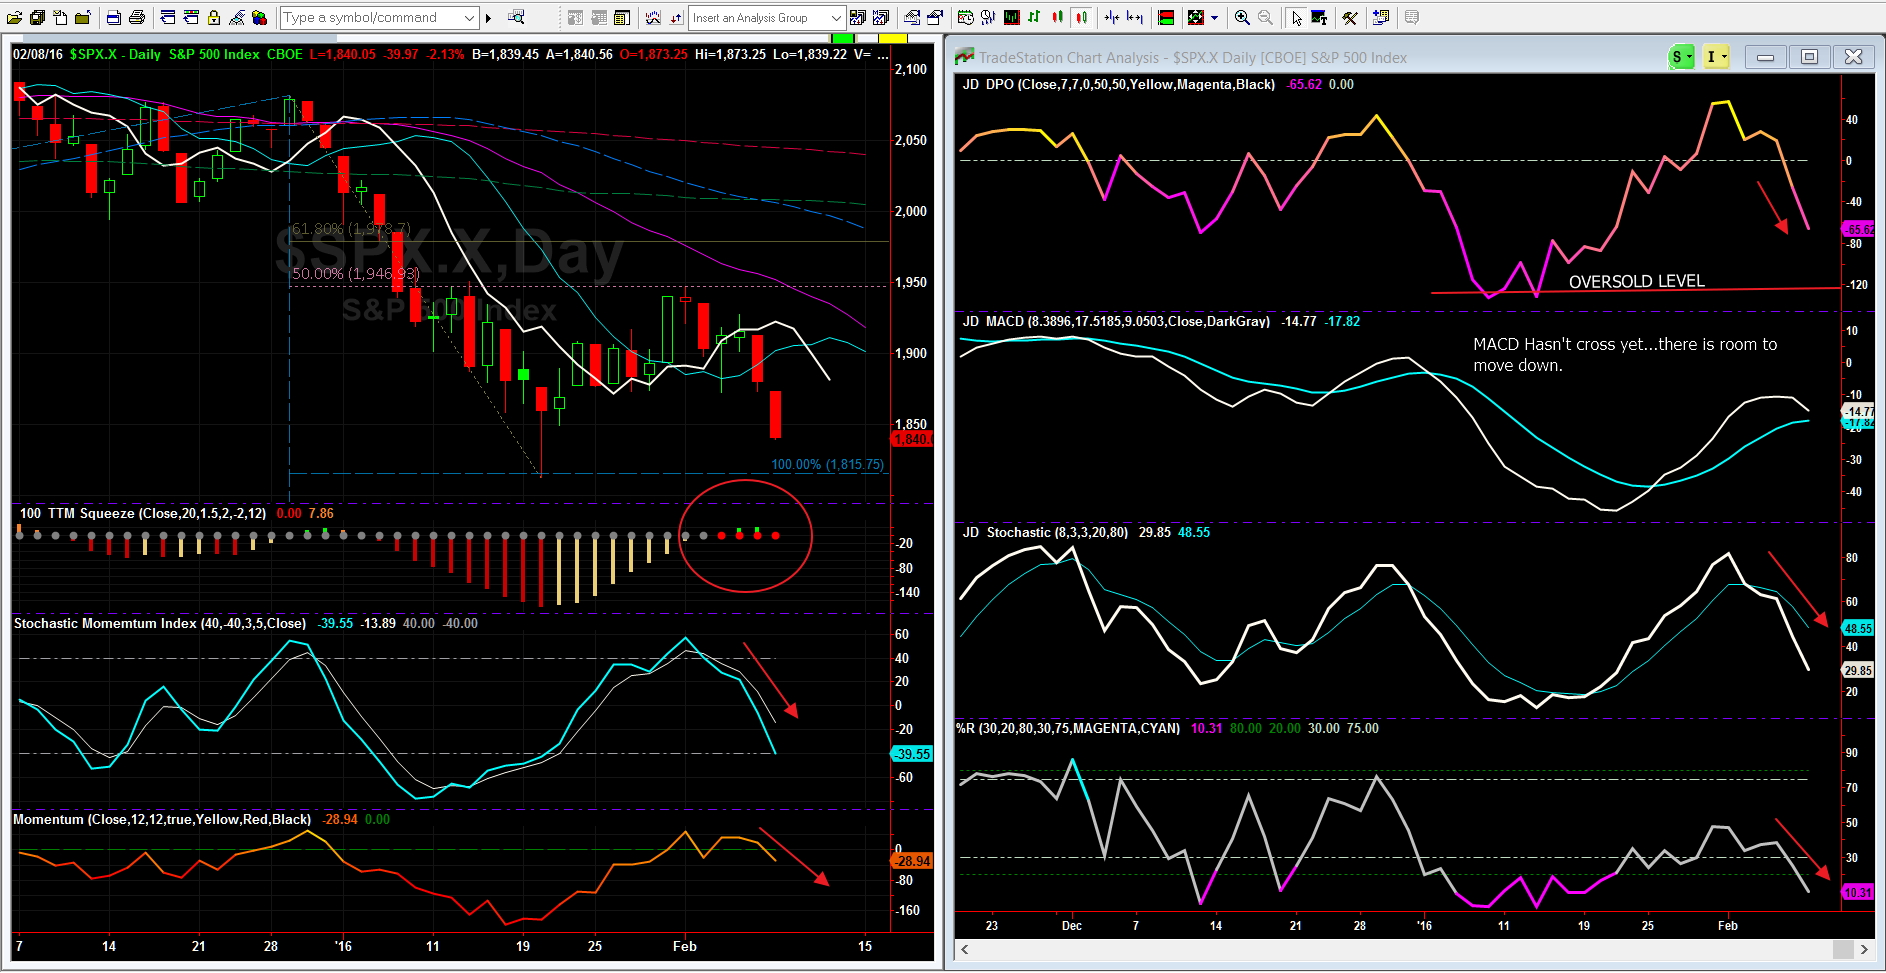
I’ve been wondering; what would…
I’ve been wondering; what would be the easier (less riskier) directional trade strategy; A Vertical spread (debit or credit) or a Diagonal spread?
Would love to hear your thoughts.
STO 3/18 SPX 2020/2035 BeCS…
STO 3/18 SPX 2020/2035 BeCS $1.60 crd. and 1735/1720 BuPS at $1.85 crd. 44 DTE. small 1 lot trade…
POS = 76.3% R/R = 3.23 Max Loss $1,145 Max win = $355
I don’t plan to get either Max Loss or Max Win.
If I cut my loss at 1/2 of Max then the POS = 570 / 1500 = 38% which comes to show that the Probability of Success is based on holding the position to the end and any exit to avoid the large loss reduces the POS.
However, using the 50% loss and taking only 60% of Max profit improves the R/R = 2.7
STO Feb 12 SPX 2020/2005…
STO Feb 12 SPX 2020/2005 BeCS and 1860/1845 BuPS at $2.80
STO Feb 26 SPX 2025/2040…
STO Feb 26 SPX 2025/2040 BeCS and 1830/1815 BuPS for $3.15 Crd.
The 1915-20 level seems to…
The 1915-20 level seems to have held…but, the SPX may go back up to retest that level.
There is strong Resistance at…
There is strong Resistance at 1915-20 Level….
Then is 1950 and 1978-80
SPX support at 1895 and…
SPX support at 1895 and 1888 and 1878…
SPX Resistance at 1905-1908 and…
SPX Resistance at 1905-1908 and 1915-1920; The strongest is the 1920 where there is a k-node and symmetry.
To calculate the probability of…
To calculate the probability of winning of any vertical spread use the following:
Prob Win% = Max Loss per position / Strike Difference.
So Jeff spread at 1990/2015 is a 25 pt. spread his max loss = 2500 – 125 = 2375.
His prob of Win = 2375/25 = 95%
Resistance at 1926-30; 1940; 1955-62;…
Resistance at 1926-30; 1940; 1955-62; 1975-77; 2002-05 and finally at 2014.
Good Morning… Bad News this…
Good Morning…
Bad News this morning (if you’re long)
Markets are in turmoil.
Chinese stocks close just 29 minutes after open
China’s stock exchanges closed for the day at 9:59 a.m. local time after the CSI 300 Index fell more than 7 percent. The selloff was sparked after the central bank cuts its yuan reference rate by the most since August. China’s foreign reserves dropped by a record $108 billion in December as its defense of the yuan becomes more costly.
European stocks follow China’s lead
The Stoxx Europe 600 Index slid as much as 3.6 percent, the most since August, before trading 3.2 percent lower at 10:40 a.m. in London. Germany’s DAX Index is trading below 10,000 for the first time since October. In the U.K., mining stocks have been hardest hit with Anglo American PLC down more than 10 percent. The pound dropped to a five-year low.
U.S. futures point to ugly open
Contracts on the Standard & Poor’s 500 Index slid 2.2 percent to 1,938 as of 10:50 a.m. in London. U.S. markets closed lower yesterday following the release of the Fed minutes from the December meeting which provided little clarity on the rate-path. Market indicators show the chances of a Fed rate rise by April have dropped to 43 percent today, from 52 percent on Tuesday. U.S. treasuries continued their longest advance since 2014.
Oil plunges to 2003 low
U.S. oil futures in New York slid to the lowest in 12 years with West Texas Intermediate dropping as much as 5.5 percent before trading down 2.5 percent at $33.12 a barrel at 11:13 a.m. London time. Volatility in the oil market may increase today as tensions in the Middle East rise following Iran’s accusation that Saudi Arabia was responsible for a missile attack on its embassy in Yemen. Industrial metals are also suffering today, with copper on the London Metal Exchange dropping 1.2 percent to $4,565 a metric ton, while nickel slumped 2 percent and zinc declined 2.2 percent. Gold is the only bright spot, trading above $1100 an ounce earlier this morning.
DIS Iron Condor Jan 130/120…
DIS Iron Condor Jan 130/120 BeCS and Jan 100/95 BuPS for $1.05 Cr. this trade came up this morning in Tasty Trade. I didn’t make it, but I’m going to watch and see if it makes money….
STC Jan 15 2016 HON…
STC Jan 15 2016 HON 105 Puts at $6.55, bought them last week for $4.10.
I’ll buy some Puts again if HON reaches 100.
A squeeze trade gone sour….got…
A squeeze trade gone sour….got stopped out of FB at $3.04; I didn’t pay attention to my indicators, they were pointing bearish, but since it was FB, I went bullish and bought Calls….Ain’t that stupid of my part?
BTO Dec 24 EA 67…
BTO Dec 24 EA 67 Put at $2.30 Another Squeeze play.
BTO Jan 8/16 EXPE 128…
BTO Jan 8/16 EXPE 128 Call at $2.80
BTO Jan 10/16 HON 105 Put at $4.25
Both on a daily squeeze and also on a monthly squeeze.
