
CODX STO 4/17/20 10.0 PUTS @.70 .75 .80. Also short the 12.5, &14.0 Calls, same expiration.
Monthly Archives: April 2020
And 1 more SPY
#ShortPuts – An older one that’s been underwater forever. Happy to be out with a nice gain…
Bought to Close SPY APR 17 2020 275.0 Put @ 1.40 (sold for 5.60)
More SPY
#ShortPuts – Feel like I have to book these on a move like today. Looking to get back in for Friday or next week if we ever have a down day…
Bought to Close SPY APR 15 2020 271.0 Put @ .16 (sold for 2.10)
Bought to Close SPY APR 17 2020 260.0 Puts @ .18 (sold for 1.69)
SPY
#ShortPuts – Paying the nickel to get out a day early…
Bought to Close SPY APR 15 2020 265.0 Put @ .05 (sold for 1.55)
A TRADE:
#SHORT PUTS RCL STO 4/17/20 34.0 PUTS @1.24 Laying it off against ITM covered calls @35.0
GS earnings analysis
#Earnings $GS reports tomorrow morning. Below are details on earnings one-day moves over the last 12 quarters.
Jan. 15, 2020 BO -0.18%
Oct. 15, 2019 BO +0.31%
July 16, 2019 BO +1.86%
April 15, 2019 BO -3.81%
Jan. 16, 2019 BO +9.54% Biggest UP
Oct. 16, 2018 BO +3.01%
July 17, 2018 BO -0.18%
April 17, 2018 BO -1.64%
Jan. 17, 2018 BO -1.86%
Oct. 17, 2017 BO -2.60%
July 18, 2017 BO -2.59%
April 18, 2017 BO -4.71% Biggest DOWN
Avg (+ or -) 2.69%
Bias -0.24%, small negative bias on earnings.
With stock at 177.50 the data suggests these ranges:
Based on current IV (expected move into Friday per TOS): 167.70 to 187.30 (+/- 5.5%)
Based on AVERAGE one-day move over last 12 quarters: 172.72 to 182.28
Based on MAXIMUM one-day move over last 12 Q’s (9.5%): 160.57 to 194.43
Based on DOWN max only (-4.7%): 169.14
Open to requests for other symbols.
ZM put spread
Sold $ZM 5/15 120/110 bull put spread @ 2.00
AMD ROKU Roll
#coveredcalls
$AMD BTC 4/17 52 call and STO 5/1 55 call at .30 added credit
$ROKU BTC 4/17 97 call and STO 5/1 110 call at 4.60 debit
TSLA
Up another 80 today
https://www.zerohedge.com/technology/130-billion-tesla-has-unilaterally-decided-tell-its-landlords-itll-be-paying-less-rent
XBI
#ShortPuts – Jumping back in with a starter position outside the expected move.
Sold XBI MAY 15 2020 75.0 Puts @ 1.20
T
#ShortPuts – Pretty aggressive roll up on these the other day so booking now. Hopefully get a pullback into earnings next week…
Bought to Close T APR 17 2020 30.0 Puts @ .21 (sold for 1.85)
JPM
#ShortPuts – Jumping back in outside the expected move and down near recent lows.
Sold JPM MAY 8 2020 85.0 Puts @ 1.20
JPM XBI
#Earnings #ShortPuts – Nice start to the day…
Bought to Close JPM APR 17 2020 92.5/80.0 Bull Put Spreads @ .37 (sold for 1.20 average)
Bought to Close XBI APR 17 2020 75.0 Puts @ .05 (sold for 4.55 total after rollups starting at 60 🙂 )
VIX
Vix futures and VXX below 40 for the first time in a month
NUGT Rolled
#coveredcalls
BTC 4/24 11.50 and STO 5/15 15 call at .89 debit. Stock at 11.57
SPY
#ShortPuts – Booking and re-selling…
Bought to Close SPY APR 13 2020 270.0 Put @ .03 (sold for 1.35)
Sold SPY APR 15 2020 271.0 Put @ 2.10
#coveredcalls #shortputs #shortcalls AAL APA…
#coveredcalls #shortputs #shortcalls AAL APA GPS HFC NUGT
NUGT bought 100 shares sold 1 April 17, 11.50 call for 10.76, NUGT is around 11.50
HFC sold April 17, 25 covered call for 1.10, cost basis is 22.28, HFC is around 25
GPS Sold April 17, 8 put for .40, GPS is around 8.30
APA bought 100 shares sold 1 April 17 10 call for 8.13, APA is around 8.30
AAL bought 100 shares sold 1 April 17, 11 call for 10.39
#coveredcalls CPRI NBL OXY HAL…
#coveredcalls CPRI NBL OXY HAL
CPRI bought 100 shares, sold 1 April 17, 12 call for 11.29
NBL bought 100 shares sold 1 April 17 7.50 call for 6.90
OXY bought 100 shares sold 1 April 17, 16 call for 14.69
HAL bought 100 shares sold 1 April 17, 8 call for 7.59
JPM
#BullPutSpreads #Earnings – Will take the stock if I have to but spreading it for now until I can get a little more out of my GILD, T, XBI, and XOP positions in same account.
Thanks @Iceman and @thomberg1201 for the earnings reminder.
Sold JPM APR 17 2020 92.5/80.0 Bull Put Spreads @ 1.16
JPM earnings analysis
#Earnings $JPM reports tomorrow morning. Below are details on earnings one-day moves over the last 12 quarters.
Jan. 14, 2020 BO +1.16%
Oct. 15, 2019 BO +3.01%
July 16, 2019 BO +1.07%
April 12, 2019 BO +4.68%
Jan. 15, 2019 BO +0.73%
Oct. 12, 2018 BO -1.09%
July 13, 2018 BO -0.45%
April 13, 2018 BO -2.70%
Jan. 12, 2018 BO +1.65%
Oct. 12, 2017 BO -0.28%
July 14, 2017 BO -0.91%
April 13, 2017 BO -1.17%
Avg (+ or -) 1.58%
Bias 0.48%, positive bias on earnings.
With stock at 99.00 the data suggests these ranges:
Based on current IV (expected move into Friday per TOS): 91.39 to 106.61 (+/- 7.7%)
Based on AVERAGE one-day move over last 12 quarters: 97.44 to 100.56
Based on MAXIMUM one-day move over last 12 Q’s (4.7%): 94.37 to 103.63
Based on DOWN max only (-2.7%): 96.33
NOTE: 5-day maxes are virtually the same as 1-day: -2.8% and +4.6%. But projected move into Friday is higher than any of these previous moves (+/- 7.7%)
Open to requests for other symbols.
TNA
#CoveredCalls – Sold TNA APR 24 2020 23.0 Calls @ .81
SPY
BTO Apr 22 276/274 Puts BEPS 0.85
SPY
#ShortPuts – Adding a few…
Sold SPY APR 17 2020 260.0 Put @ 1.70
Sold SPY APR 20 2020 260.0 Puts @ 1.95
Episode 4 – Binger’s Delight
Bill Withers, Kenny Rogers & the First Edition, and more shows and movies than you can shake a Pick at for your quarantine streaming checklist.
Econ Calendar for week of 4/13/20
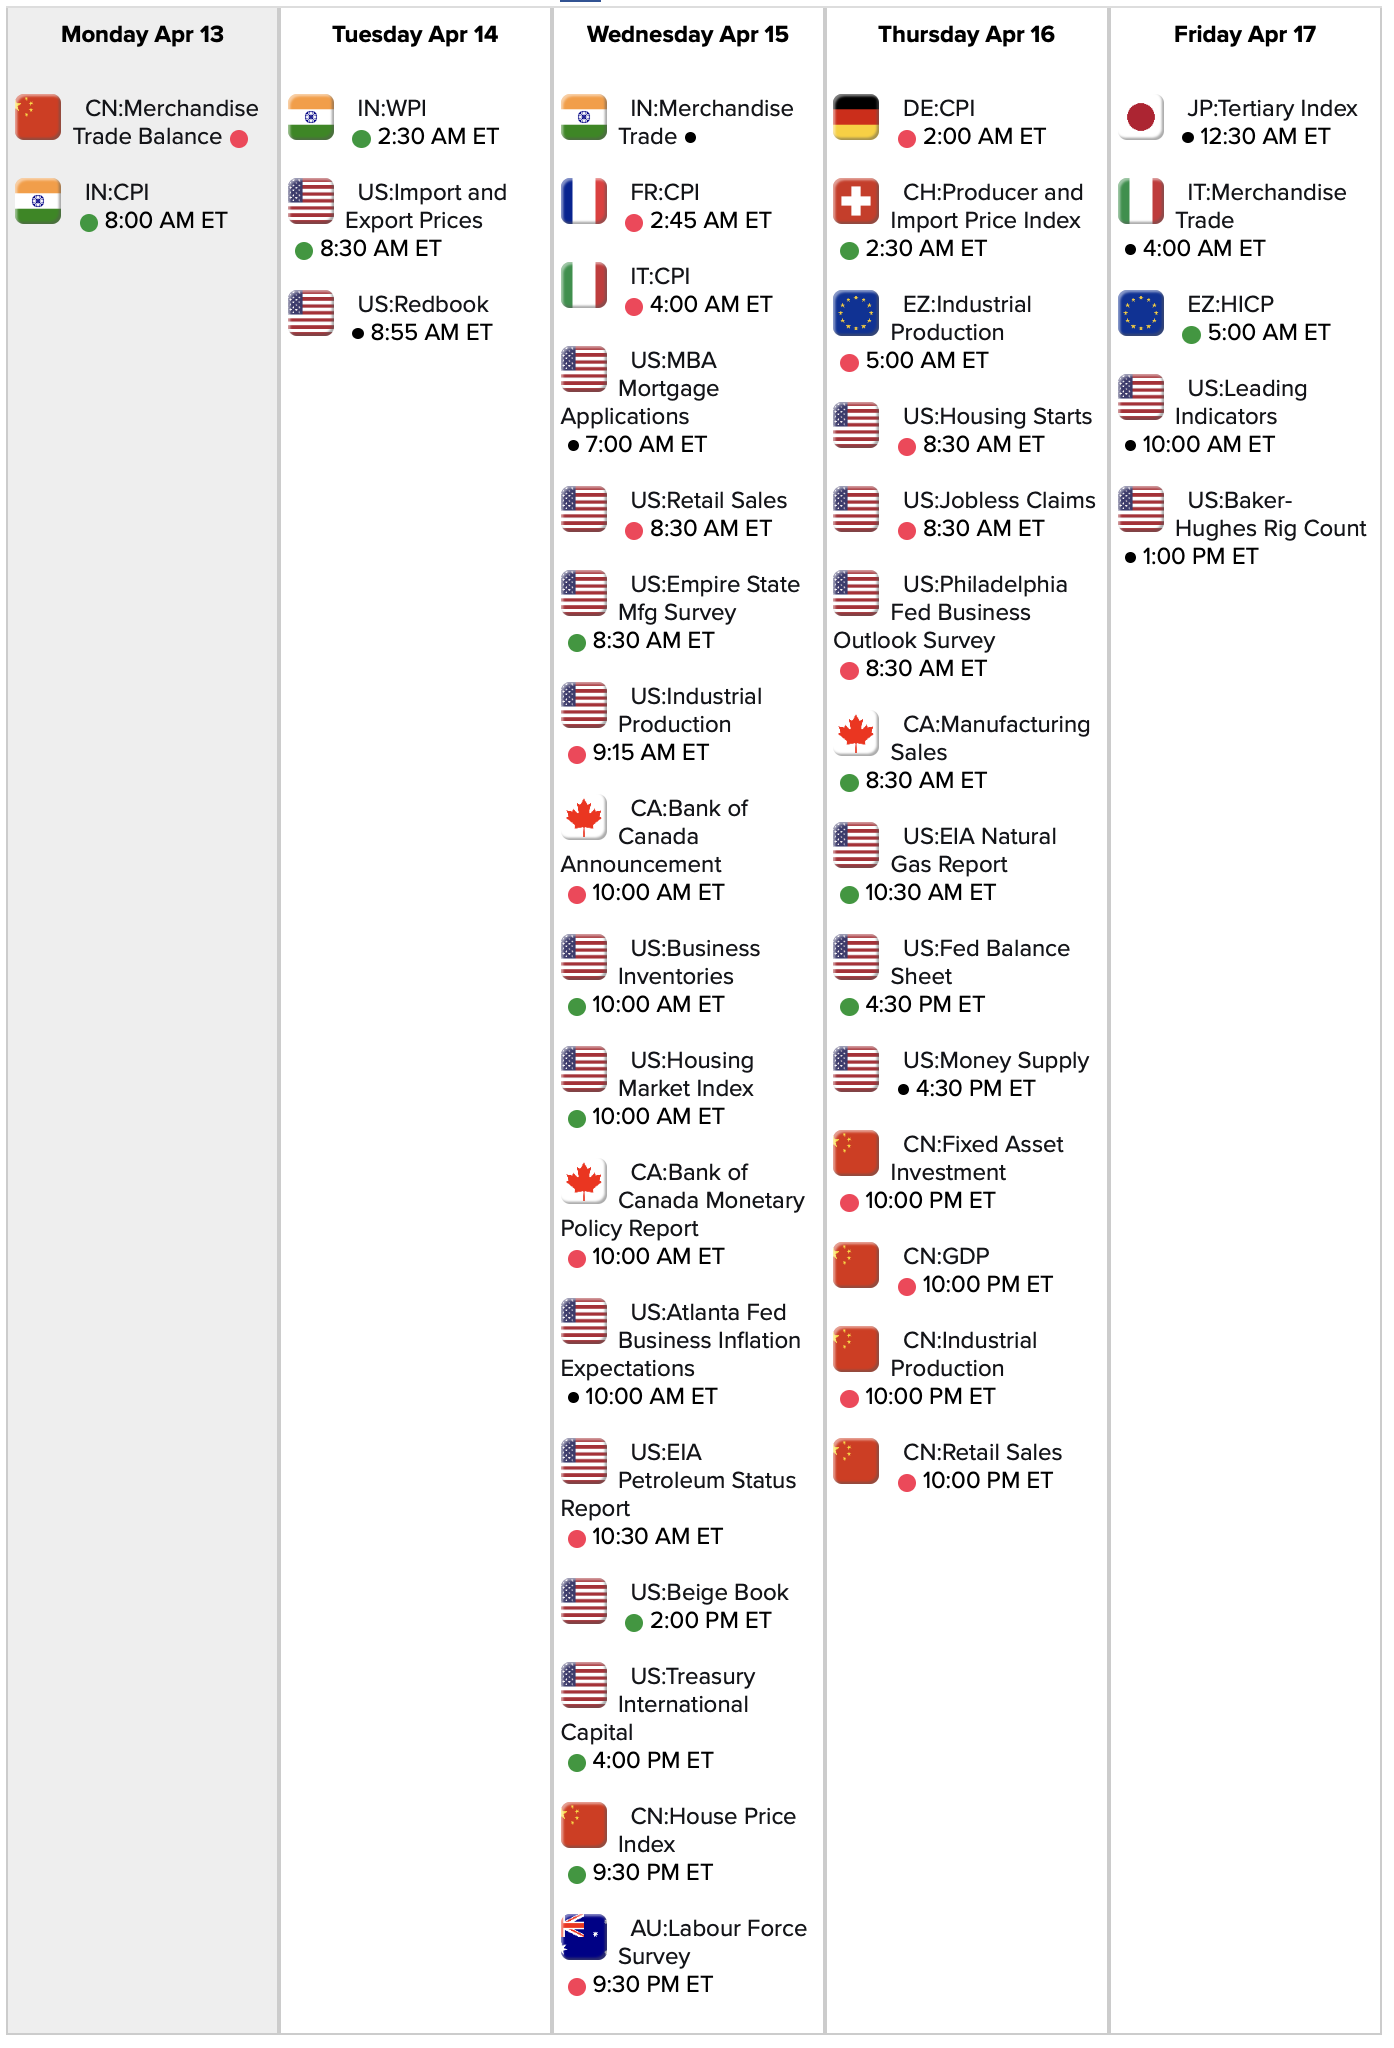

Link to calendar: https://research.investors.com/economic-calendar/
#coverdcalls #shortputs #longcallspread BOOT TSLA…
#coverdcalls #shortputs #longcallspread BOOT TSLA
End of day Thursday
BOOT bought 100 shares @16, sold April 17 call for 1.50.
BOOT sold April 17, 15 put for .50.
TSLA bought April 24, 550/570 long call spread for 10.94 as a hedge.
OptionExpiration
Happy with the following covered call assignments
HAL 7
APA 5
HFC 25
SLB 13
Thanks to Iceman for the strategy, primarily low priced, beaten up energy related companies
Looking for input on tracking trades
Curious if traders have a way of tracking the profitability of a “CC position” over time. I find it challenging to keep track of whether or not I am making money with a strategy after multiple steps (roll up, down, roll out). I see many traders carrying a lot of positions with lots of rolls. I made the worksheet below as a first attempt for tracking. Any ideas or suggestions are welcome. I am using actual data from a trade from last week where I established the CC then rolled the short call out from Apr 9 to Apr 17. So far I have lost $2,400 on the stock and gained $4,400 on the options for net gain of $2,000. When I did the roll the stock was trading at $4.70. It gets complicated managing this across 10 different positions. If you want a copy of the worksheet to evolve let me know in the replies.

HAL Covered Call Roll
5 CC established net $6.83.
Rolled 5 Apr 9 $7.50 Call (bought $.88) to Apr 17 $7.50 (sold $1.15).
With roll credit cost reduced by $.27 to $6.83.
Stock trading at $8.35.
Buying it this time
#SPX1dte After getting slammed for the third time this year on a Monday, I am going long the condor for this three-day weekend.
Bought to Open $SPX April 13th 2590/2610-2920/2940 condors for 1.55. Any gap open will give me at least a small profit. The tough part will be whether to wait and see if we get another 5%+ day…
ROKU ROLL (Shall we dance)
#coveredcalls
BTC 4/9 92 call and STO 4/17 97 call at added $1 credit. Stock at 91.66
SPY
#ShortPuts – As an experiment throwing a little put ladder out there for next week. Maybe talk Mr. Market down just a little…
Sold SPY APR 13 2020 270.0 Put @ 1.35
Sold SPY APR 15 2020 265.0 Put @ 1.55
Sold SPY APR 17 2020 260.0 Put @ 1.67
XOP adding calls to create a strangle
Sold $XOP 5/15 53 calls @ 1.12 (22 delta) to create a short strangle with my 35 puts. Total premium taken now 3.42.
LABU SPCE SPY TQQQ TSLA UDOW
#CoveredCalls #ShortPuts – A few rolls to finish the week…
LABU: Various covered calls rolled out and up to May monthly for small credits.
SPCE: Covered and prior to earnings.
Rolled SPCE APR 9 2020 14.0 Calls to APR 24 2020 15.0 Calls @ .09 credit
SPY: Will continue selling puts against these covered calls on (if) any weakness.
Rolled SPY APR 9 2020 255.0 Calls to APR 24 2020 258.0 Calls @ .01 credit
Rolled SPY APR 9 2020 253.0 Call to MAY 15 2020 260.0 Call @ .25 credit
TQQQ: Covered and hoping for more stock next week.
Rolled TQQQ APR 09 2020 47.0 Call to APR 24 2020 50.0 Call @ even
TSLA: Covered and rolling to week after earnings.
Rolled TSLA APR 09 2020 475.0 Call to MAY 01 2020 500.0 Call @ .83 debit (total premium now 25.00)
UDOW: Trying for more stock.
Sold UDOW APR 17 2020 50.0 Put @ 2.85
Bought to Close UDOW APR 17 2020 30.0 Put @ .15 (sold for 3.29)
Happy Easter everyone!
#rolling TSLA Rolled April 17,…
#rolling TSLA
Rolled April 17, inverted 300/450 to May 15, 320/450 inverted ugly strangle for 3.24. This deep in the money call move is essentially receiving $2,000.
Earnings are coming up April 22 according to TDA. I’ll add some upside protection next week.
Rolling AMD NUGT TQQQ RCL
#coveredcalls
$AMD BTC 4/9 50 call and STO 4/17 52 call at .48 credit
$NUGT BTC 4/9 9 call and STO 4/17 10 call at .12 debit
$TQQQ BTC 4/24 55 call and STO 4/17 57 call at .05 debit
#shortcalls
$RCL BTC 4/9 35 call and STO 5/1 40 call at 1.00 debit Stock at 42.55.
Joyous Easter and Passover to all. Early but rolling is exhausting. 😉
SDC
Rolled 200 Apr 9 $4.50 to Apr 17 $4.50 for $.32 credit. Paid $4.52 for stock when call established. $4.70 now.
#shortputs #closing XOP Bought May…
#shortputs #closing XOP
Bought May 15, 7 put for .20, sold March 24, pre split, for .89.
#coveredcalls #rolling T Rolled 29.50…
#coveredcalls #rolling T AAL
T Rolled 29.50 covered call to April 17 for .38
AAL Rolled 10 call to April 17 for .38
NVDA put spread
Sold $NVDA 5/15 250/240 bull put spread @ 3.00
Two expirations
Two positions expiring today.
CCL Covered Call 04/9/20 $12.50 net cost $11.68
HAL Covered Call 04/09/20 $7.50 net cost $6.84
SDC
Bought Covered Call Apr 9 $4.50 Net $4.38
SPXpire
#SPX1dte Expiring: $SPX April 8th 2505/2525-2800/2820 condors, sold yesterday for 1.25
SPY
#ShortPuts – Filled just after the close…
Bought to Close SPY APR 09 2020 260.0 Puts @ .15 (sold for 1.35 and 1.40)
XOP short puts
Sold $XOP 5/15 35 puts @ 2.30
A TRADE:
AAL STO 4/17/20 11.0 PUTS @1.09 Will either acquire the stock which I don’t mind to do, or keep the nice premium.
NTAP
#CoveredCalls – Never hurts to try. This filled with the mid sitting at .27 🙂 🙂
Bought to Close NTAP APR 9 2020 46.5 Calls @ .01 (sold for 1.31)
TRADES:
TLRY 4/17/20 STO 6.5 PUTS @.51
TLRY 4/17/20 STO 8.0 CALLS @.40
T
#ShortPuts – Taking a little bit of a directional position for next week rolling to just in the money. Earnings the following week.
Rolled T APR 17 2020 26.0 Puts to APR 17 2020 30.0 Puts @ .87 credit (1.84 total now)
#xme sto april 17 /17…
#xme
sto april 17 /17 strike @ .46
#coveredcalls CCL Bought 100 shares…
#coveredcalls CCL
Bought 100 shares and sold the April 17, 11.50 call for 10.48 debit. CCL is at 12.00.
TRADES:
RCL BTO STOCK @36.32
RCL STO 4/17/20 40.0 CALLS @2.60
RCL STO 4/9/20 31.0 PUTS @.82
TLRY STO 3/9/20 8.0 CALLS @.24
TSLA advice
I have this horrible inverted April 17, 300/450 strangle. I’m down about 12k on it. I can pick up about $2,500 on another roll to May, I can take short shares right before earnings at a basis of 430 and sell puts, weekly or way out in time, or any other manuevers one can think of.
Does anyone have any suggestions?
Thank you
#ung STO 13.50 put april…
#ung
STO 13.50 put april 17 .41 cents
UVXY call spread
Sold $UVXY 5/1 70/80 bear call spread @ 1.39
#shortputs X Sold April 24,…
#shortputs X LB #coveredcalls T
X Sold April 24, 6 put for .27
LB sold April 17, 13 put for .50
T bought 100 shares, sold April 9, 29.50 call for 29.05
SPY
#ShortPuts – Added a little to yesterday…
Sold SPY APR 09 2020 260.0 Puts @ 1.35
SPX 1-dte
#SPX1dte Sold to Open $SPX April 8th 2505/2525-2800/2820 condors for 1.25, IV: 43%, SPX 2664, deltas -.05, +.04.
Went a little farther out than usual delta-wise after yesterday’s beating.
SPY
#ShortPuts – Half size and down where I’d get a better price on a covered call roll…
Sold SPY APR 09 2020 260.0 Puts @ 1.40
QQQ iron condor
Sold $QQQ 5/15 175/180/220/225 iron condor @ 1.77
#coveredcalls M Bought 100 shares,…
Bought 100 shares, sold May 15, 6 call for 5.18.
SPY
#ShortPuts – Taking another one off at about 50 percent of max gain…
Bought to Close SPY APR 17 2020 250.0 Put @ 2.70 (sold for 5.20)
#closing #shortputs MU Bought May…
Bought May 15, 35 put for .49. sold April 1 for 2.15
SPY
#ShortPuts – Taking these off early. Looking to sell Thursday on any weakness…
Bought to Close SPY APR 08 2020 255.0 Puts @ .20 (sold for 1.74)
SPXpire badly
#SPX1dte My Friday condor was blown out on the upside… I foolishly thought we had calmed down enough that we wouldn’t have a 7% up day. Full loss… sold for 1.75. This means I’ve done nothing but tread water on this strategy this year.
A TRADE:
#SHORT CALL RCL STO 4/9/20 32.0 CALL @1.16
#TRADES: #SHORT CALLS AAL 4/9/20…
ROKU put spread
Sold $ROKU 5/15 80/75 bull put spread @ 1.46
SPY
#ShortPuts #ShortCalls #CoveredCalls – Booking and rolling again…
Bought to Close SPY APR 06 2020 254.0 Puts @ .05 (rolled up this morning to get 1.83 total credit)
Sold SPY APR 08 2020 255.0 Puts @ 1.74
Rolled SPY APR 6 2020 251.0 Call to APR 09 2020 253.0 Call @ .09 debit (covered with 2.05 credit received)
Rolled SPY APR 6 2020 257.0 Calls to APR 8 2020 260.0 Calls @ .05 debit (1.15 total so far)
GILD
#ShortPuts – Jumping back in this one. Selling just before earnings…
Sold GILD APR 24 2020 70.0 Puts @ 1.90
#hardroborrow UVXY I had to…
#hardroborrow UVXY
I had to buy the short 100 shares UVXY position, hard to borrow according to TD Ameritrade. They gave me until noon to get out of town.
#shortputs NUGT Sold April 9,…
#shortputs NUGT
Sold April 9, 9 put for .79
#shortputspread #closing AAPL Bought April…
#shortputspread #closing AAPL
Bought April 17, 220/230 put spread for .98 sold for 2.35 on April 2, thanks Ramie for the trade.
#assignment UVXY I was assigned…
#assignment UVXY
I was assigned short 100 shares of IVXY from an April 17, 25/35 short call spread sold February 27 for 1.65. I sold the long call for 16.20-Yay. My cost basis is just under 43, UVXY is around 51.
XBI
#ShortPuts – Just to get these all in the same strike…
Rolled XBI APR 17 2020 70.0 Puts to XBI APR 17 2020 75.0 Puts @ .93 credit (4.50 avg credit now)
