
#SPX1dte Sold to Open $SPX May 26th 2840/2860-3025/3045 condors for 1.10. IV: 14.5%, SPX 2953, deltas: -.06, +.04
Expiring: May 22nd 2855/2875-3010/3030 condors, sold for 1.35 yesterday.
#SPX1dte Sold to Open $SPX May 26th 2840/2860-3025/3045 condors for 1.10. IV: 14.5%, SPX 2953, deltas: -.06, +.04
Expiring: May 22nd 2855/2875-3010/3030 condors, sold for 1.35 yesterday.

Link to calendar: https://research.investors.com/economic-calendar/
#SPX7dteLong Bought to open $SPX May 29th 2920/2940-2950/2970 condors for 17.35, with SPX at 2945.
#Earnings $AZO reports Tuesday morning before the bell. Options trades need to be placed today to capture any earnings move. Below are details on earnings one-day moves over the last 12 quarters.
March 3, 2020 BO -2.11%
Dec. 10, 2019 BO +6.92% Biggest UP
Sept. 24, 2019 BO -4.41%
May 21, 2019 BO +5.56%
Feb. 26, 2019 BO +5.10%
Dec. 4, 2018 BO +6.74%
Sept. 18, 2018 BO -1.97%
May 22, 2018 BO -9.48%
Feb. 27, 2018 BO -11.06%
Dec. 5, 2017 BO +0.42%
Sept. 19, 2017 BO -5.00%
May 23, 2017 BO -11.84% Biggest DOWN
Avg (+ or -) 5.88%
Bias -1.76%, negative bias on earnings.
With stock at 1100.00 the data suggests these ranges:
Based on current IV (expected move into Friday per TOS): 1025.76 to 1174.24 (+/- 6.7%)
Based on AVERAGE one-day move over last 12 quarters: 1035.27 to 1164.73
Based on MAXIMUM one-day move over last 12 Q’s (11.8%): 969.76 to 1230.24
Based on UP max only (+6.9%): 1176.12
NOTE: 5-day historical maximums are +5.7 and -9.9%. So LESS than the one day moves on both sides, meaning the big one day moves were somewhat retraced 5 days after earnings.
Open to requests for other symbols.
#Earnings Bought to close $EXPE May 22nd 79 calls for .10. 79/81 call spreads sold Wednesday for .90.
#SPX1dte Sold to Open $SPX May 22nd 2855/2875-3010/3030 condors for 1.35. IV: 21.0%, SPX 2951, deltas -.06, +.07
#Earnings $NVDA reports tonight. Below are details on earnings one-day moves over the last 12 quarters.
Feb. 13, 2020 AC +7.02%
Nov. 14, 2019 AC -2.66%
Aug. 15, 2019 AC +7.25%
May 16, 2019 AC -2.28%
Feb. 14, 2019 AC +1.81%
Nov. 15, 2018 AC -18.75% Biggest DOWN
Aug. 16, 2018 AC -4.90%
May 10, 2018 AC -2.15%
Feb. 8, 2018 AC +6.69%
Nov. 9, 2017 AC +5.26%
Aug. 10, 2017 AC -5.32%
May 9, 2017 AC +17.82% Biggest UP
Avg (+ or -) 6.83%
Bias 0.82%, positive bias on earnings.
With stock at 356.00 the data suggests these ranges:
Based on current IV (expected move into Friday per TOS): 330.23 to 381.77 (+/- 7.2%)
Based on AVERAGE one-day move over last 12 quarters: 331.70 to 380.30
Based on MAXIMUM one-day move over last 12 Q’s (18.8%): 289.25 to 422.75
Based on UP max only (+17.8%): 419.44
Open to requests for other symbols.

Sold to Open $EXPE May 22nd 79/81 call spreads for .90. Risking 1.10.
#SPX7dteLong Bought to Open $SPX May 27th 2950/2970-2980/3000 condors for 17.00, with SPX at 2972.
#SPX1dte Sold to Open $SPX May 20th 2820/2840-2995/3015 condors for 1.00. IV: 22.1%, SPX 2930, deltas -.04, +.06.
#SPX7dteLong About 15 minutes ago, on the way up, Sold to Close $SPX May 22nd 2860/2880 call spreads for 18.00. Then, on the huge spike down, sold 2850/2830 put spread for 1.75. Could have gotten more but how was I to know there’d be a party goin’ on? Condors bought for 18.10 on Friday, sold for 19.75 today.
#Earnings Sold to close $KSS May 22nd 19 puts for 1.45. Bought yesterday for 1.40. Didn’t get the big drop I was betting on so happy to pretend it never happened.
#SPX7dteLong Bought to Open $SPX May 26th 2940/2960-2970/2990 condors for 17.15, with SPX at 2964
#Earnings $KSS reports tomorrow morning. Below are details on earnings one-day moves over the last 12 quarters.
March 3, 2020 BO -2.62%
Nov. 19, 2019 BO -19.48% Biggest DOWN
Aug. 20, 2019 BO -6.88%
May 21, 2019 BO -12.33%
March 5, 2019 BO +7.31% Biggest UP
Nov. 20, 2018 BO -9.22%
Aug. 21, 2018 BO +1.71%
May 22, 2018 BO -7.42%
March 1, 2018 BO -5.05%
Nov. 9, 2017 BO +0.93%
Aug. 10, 2017 BO -5.79%
May 11, 2017 BO -7.83%
Avg (+ or -) 7.21%
Bias -5.56%, strongly negative bias on earnings.
With stock at 19.00 the data suggests these ranges:
Based on current IV (expected move into Friday per TOS): 16.45 to 21.55 (+/- 13.4%)
Based on AVERAGE one-day move over last 12 quarters: 17.63 to 20.37
Based on MAXIMUM one-day move over last 12 Q’s (19.5%): 15.30 to 22.70
Based on UP max only (+7.3%): 20.39
NOTE: 5-day historical maximums are +2.5 and -19.5%. So positive move is LESS and negative move is the same.
Open to requests for other symbols.
#SPX7dteLong Sold to Close $SPX May 18th 2920/2940-2950/2970 condors for 10.50. Bought for 16.80. This was the cheapest one I have purchased, and it’s simply hilarious that when I posted the trade last Monday I said that “probability of profit has dropped.” Sho’nuff!
KSS is confirmed for tomorrow morning earnings report.
#Earnings $HD reports tomorrow morning. Below are details on earnings one-day moves over the last 12 quarters.
Feb. 25, 2020 BO -0.96%
Nov. 19, 2019 BO -5.43% Biggest DOWN
Aug. 20, 2019 BO +4.39% Biggest UP
May 21, 2019 BO +0.26%
Feb. 26, 2019 BO -0.88%
Nov. 13, 2018 BO -0.23%
Aug. 14, 2018 BO -0.53%
May 15, 2018 BO -1.62%
Feb. 20, 2018 BO -0.13%
Nov. 14, 2017 BO +1.63%
Aug. 15, 2017 BO -2.65%
May 16, 2017 BO +0.59%
Avg (+ or -) 1.61%
Bias -0.46%, negative bias on earnings.
With stock at 247.00 the data suggests these ranges:
Based on current IV (expected move into Friday per TOS): 232.83 to 261.17 (+/- 5.7%)
Based on AVERAGE one-day move over last 12 quarters: 243.03 to 250.97
Based on MAXIMUM one-day move over last 12 Q’s (5.4%): 233.59 to 260.41
Based on UP max only (+4.4%): 257.84
NOTE: 5-day historical maximums are +4.6 and -9.2%. So positive move is the same but it has moved to the downside further in 5 days versus one day.
Open to requests for other symbols.
#SPX1dte Bought to close $SPX May 18th 2930/2950 call spreads for 14.75. Condors sold for 1.25 on Friday.
Pretty sure this spread will end the day at 20.00, so I’m cutting losose now to avoid full loss. Looking to do the same with the 7dteLong because that one may end the day at 0.00.
#SPX7dteLong One hour before open, sold to close $SPX May 20th 2810/2830 call spreads for 18.50. Will try to close put side today on any small push down. Condors sold for 18.30 last Wednesday.
My expirations today, both 7dte and 1dte, are in trouble at the moment. My best hope will be a close below 2920. Otherwise I will be mitigating losses.
#SPX1dte Sold to Open $SPX May 18th 2730/2750-2930/2950 condors for 1.25, IV 18.8%, SPX 2859, deltas -.04, +.06.
Expiring: May 15th 2730/2750-2930/2940 condors, sold yesterday for 1.00.
#SPX7dteLong Bought to Open $SPX May 22nd 2830/2850-2860/2880 condors for 18.10, with SPX at 2854.
Expiring at max profit: May 15th 2920/2900 put spreads for 20.00. Condors bought last Friday for 17.05.
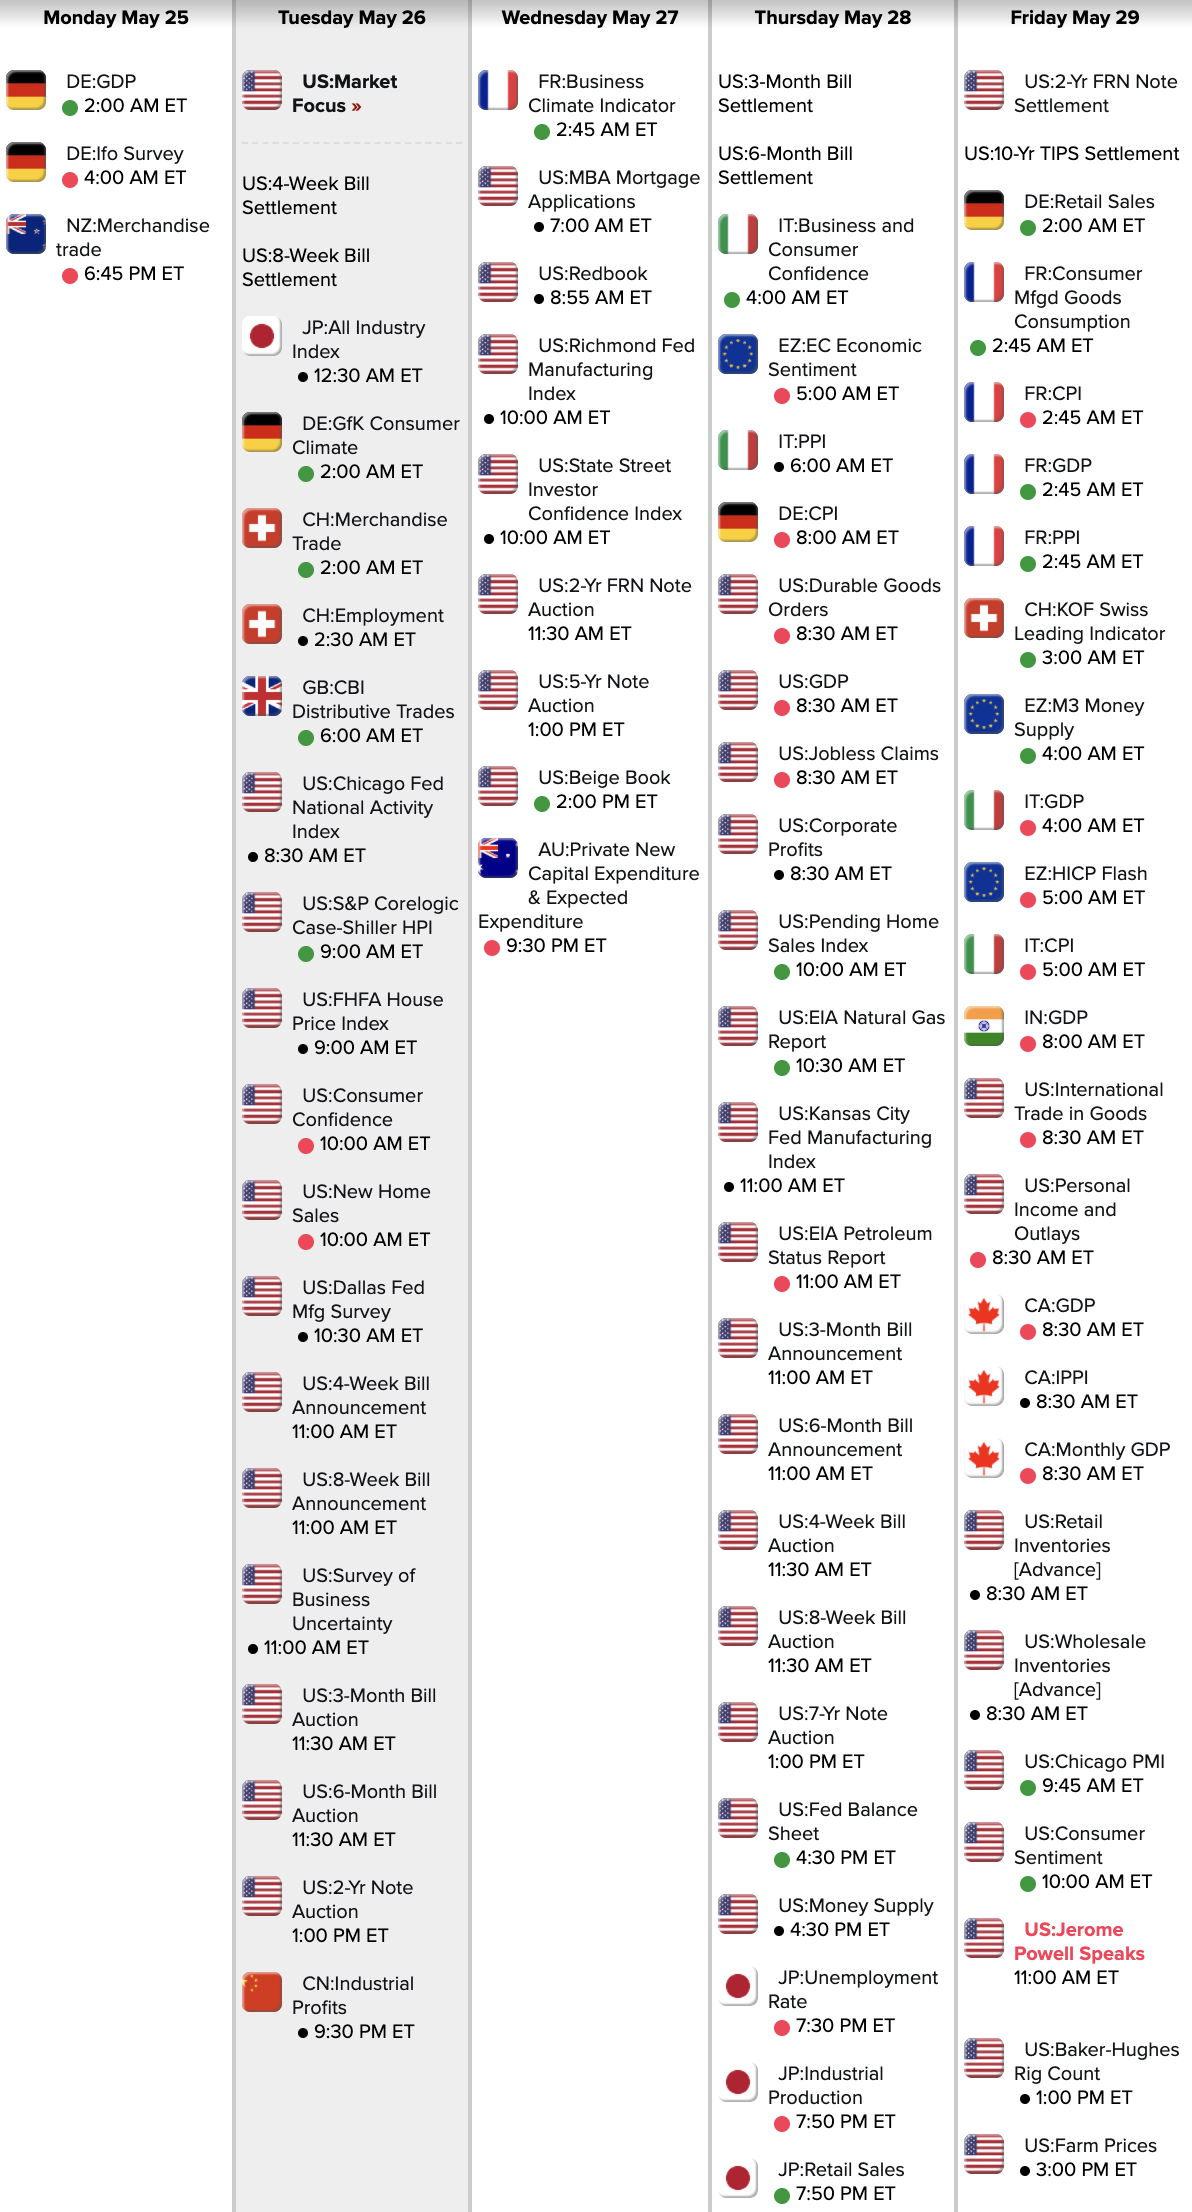
#FOMC Jerome Powell speaks Thursday

Link to calendar: https://research.investors.com/economic-calendar/
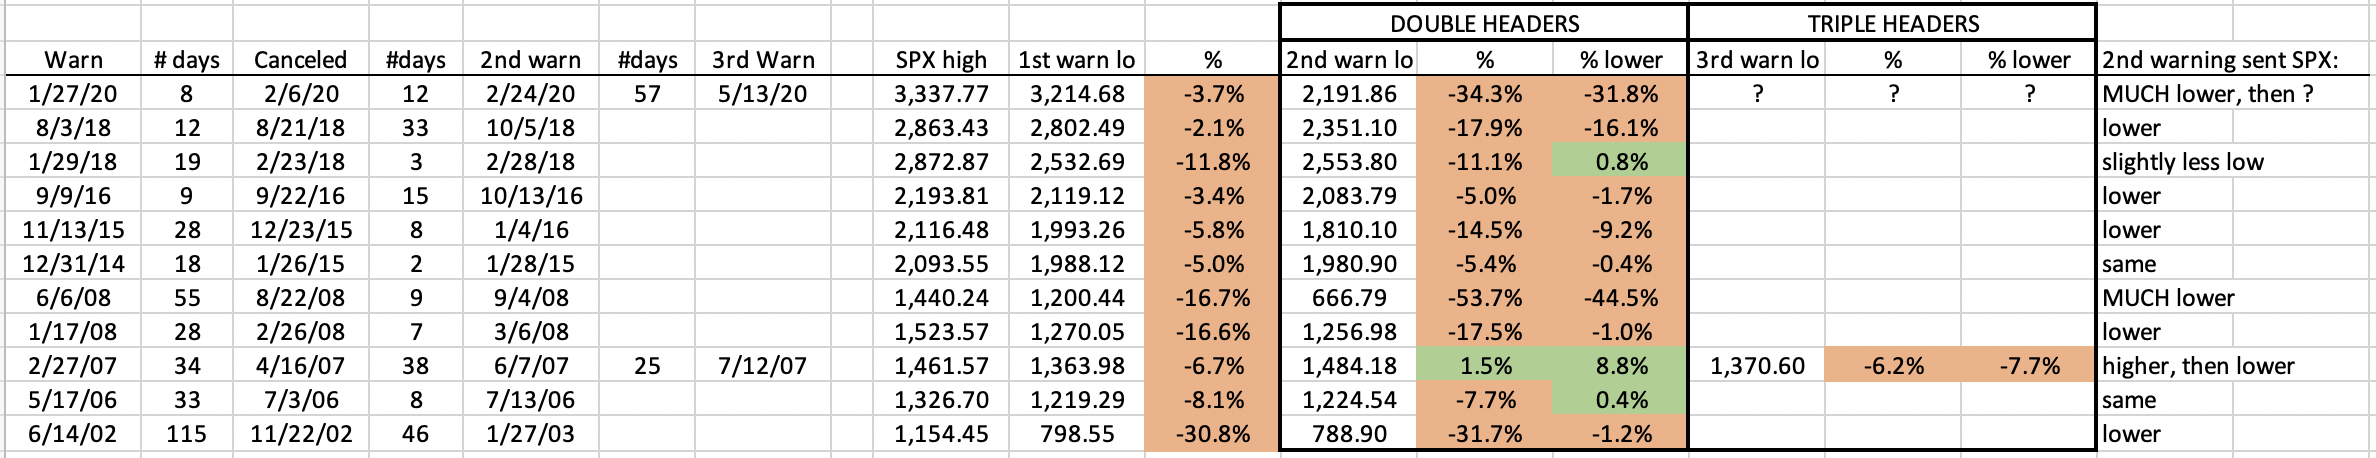
#VIXIndicator Since 1999, what happened this week has happened once previously: a Downside Warning going into effect after it had been canceled, with no Upside Warning in between… and then that happening AGAIN. It’s a “triple-header” of Downside Warnings (DW).
The Downside Warning was reinstated on Wednesday after being canceled Monday. The DW that preceded the big drop was on February 24th, and that was a double-header already, after the first DW on January 27.
Double-headers usually result in the SECOND drop being deeper than the first. That certainly happened this time, with the second drop being exceeded only by the 2008 financial crisis. The only triple header before now was in 2007, when the second warning didn’t go as low as the first, but the third went lowest of all.
So we don’t have enough data to build a historical model of what we are in now. But it’s interesting to see the history of these market double/triple dips.
Below is a chart of all occurrences of doubles/triples since 1999:
#SPX1dte Sold to Open $SPX 2730/2750-2920/2940 condors for 1.00, IV 25.6%, SPX 2846, deltas -.05, +.05
#Earnings $AMAT reports tonight. Below are details on earnings one-day moves over the last 12 quarters.
Feb. 12, 2020 AC +3.05%
Nov. 14, 2019 AC +8.95% Biggest UP
Aug. 15, 2019 AC -1.12%
May 16, 2019 AC +2.49%
Feb. 14, 2019 AC -3.95%
Nov. 15, 2018 AC +1.08%
Aug. 16, 2018 AC -7.71%
May 17, 2018 AC -8.24% Biggest DOWN
Feb. 14, 2018 AC +3.89%
Nov. 16, 2017 AC -2.33%
Aug. 17, 2017 AC +2.73%
May 18, 2017 AC +0.38%
Avg (+ or -) 3.83%
Bias -0.07%, no significant bias on earnings.
With stock at 52.00 the data suggests these ranges:
Based on current IV (expected move into Friday per TOS): 49.22 to 54.78 (+/- 5.3%)
Based on AVERAGE one-day move over last 12 quarters: 50.01 to 53.99
Based on MAXIMUM one-day move over last 12 Q’s (9.0%): 47.35 to 56.65
Based on DOWN max only (-8.2%): 47.72
Open to requests for other symbols.
#VIXIndicator The Downside Warning was reinstated at the close Wednesday, as VIX closed over 25% higher than Monday’s close.
#SPX7dteLong Bought to Open $SPX May 20th 2780/2800-2810/2830 condors for 18.30, with SPX at 2814.
#VXXGame Sold to close $SVXY Jan 2021 35 calls for 4.40. Bought for 4.114 (avg price) on March 26 & 27. What a bust… this thing hardly moved. TQQQ much better choice to get long at lows.
#SPX1dte Pretty sharp move at day’s end, but IV on tomorrow’s expiry is only 22%. I’m skipping this as tomorrow could be a sharp bounce or a sharp drop.
#VIXIndicator would have fired an upside warning today if the close was calm. This is why it takes 3 consecutive days of VIX closes before it fires… too many head-fakes with only 1 or 2 days.
#SPX7dteLong In premarket, GTC order filled: Sold to close $SPX May 13th 2870/2890 call spreads for 18.60. Condors sold last Wednesday for 17.90. Will sell put side today.
#SPX7dteLong Bought to Open $SPX May 18th 2920/2940-2950/2970 condors for 16.80, with SPX at 2942. These are getting cheaper, which also means probability of profit has dropped.
#SPX1dte Expiring: May 11th 2825/2845-2990/3010 condors, sold Friday for .95
#VIXIndicator The VIX closed below the 78.6% retracement, so that cancels the DW. Crazy stuff on a day with jobs numbers like that. If we can close well Monday and Tuesday it will set up nicely for a further rally higher.
#SPX1dte Sold to Open $SPX May 11th 2825/2845-2990/3010 condors for .95, IV 14.75%, SPX 2929, deltas -.06, +.05
Expiring: May 8th 2760/2780-2950/2970 condors, sold yesterday for 1.15.
#SPX7dteLong Bought to Open $SPX May 15th 2900/2920-2930/2950 condors for 17.05, with SPX at 2922.
Expiring: May 8th 2840/2860 call spreads for maximum credit, 20.00. Condors bought last Friday for 18.40.
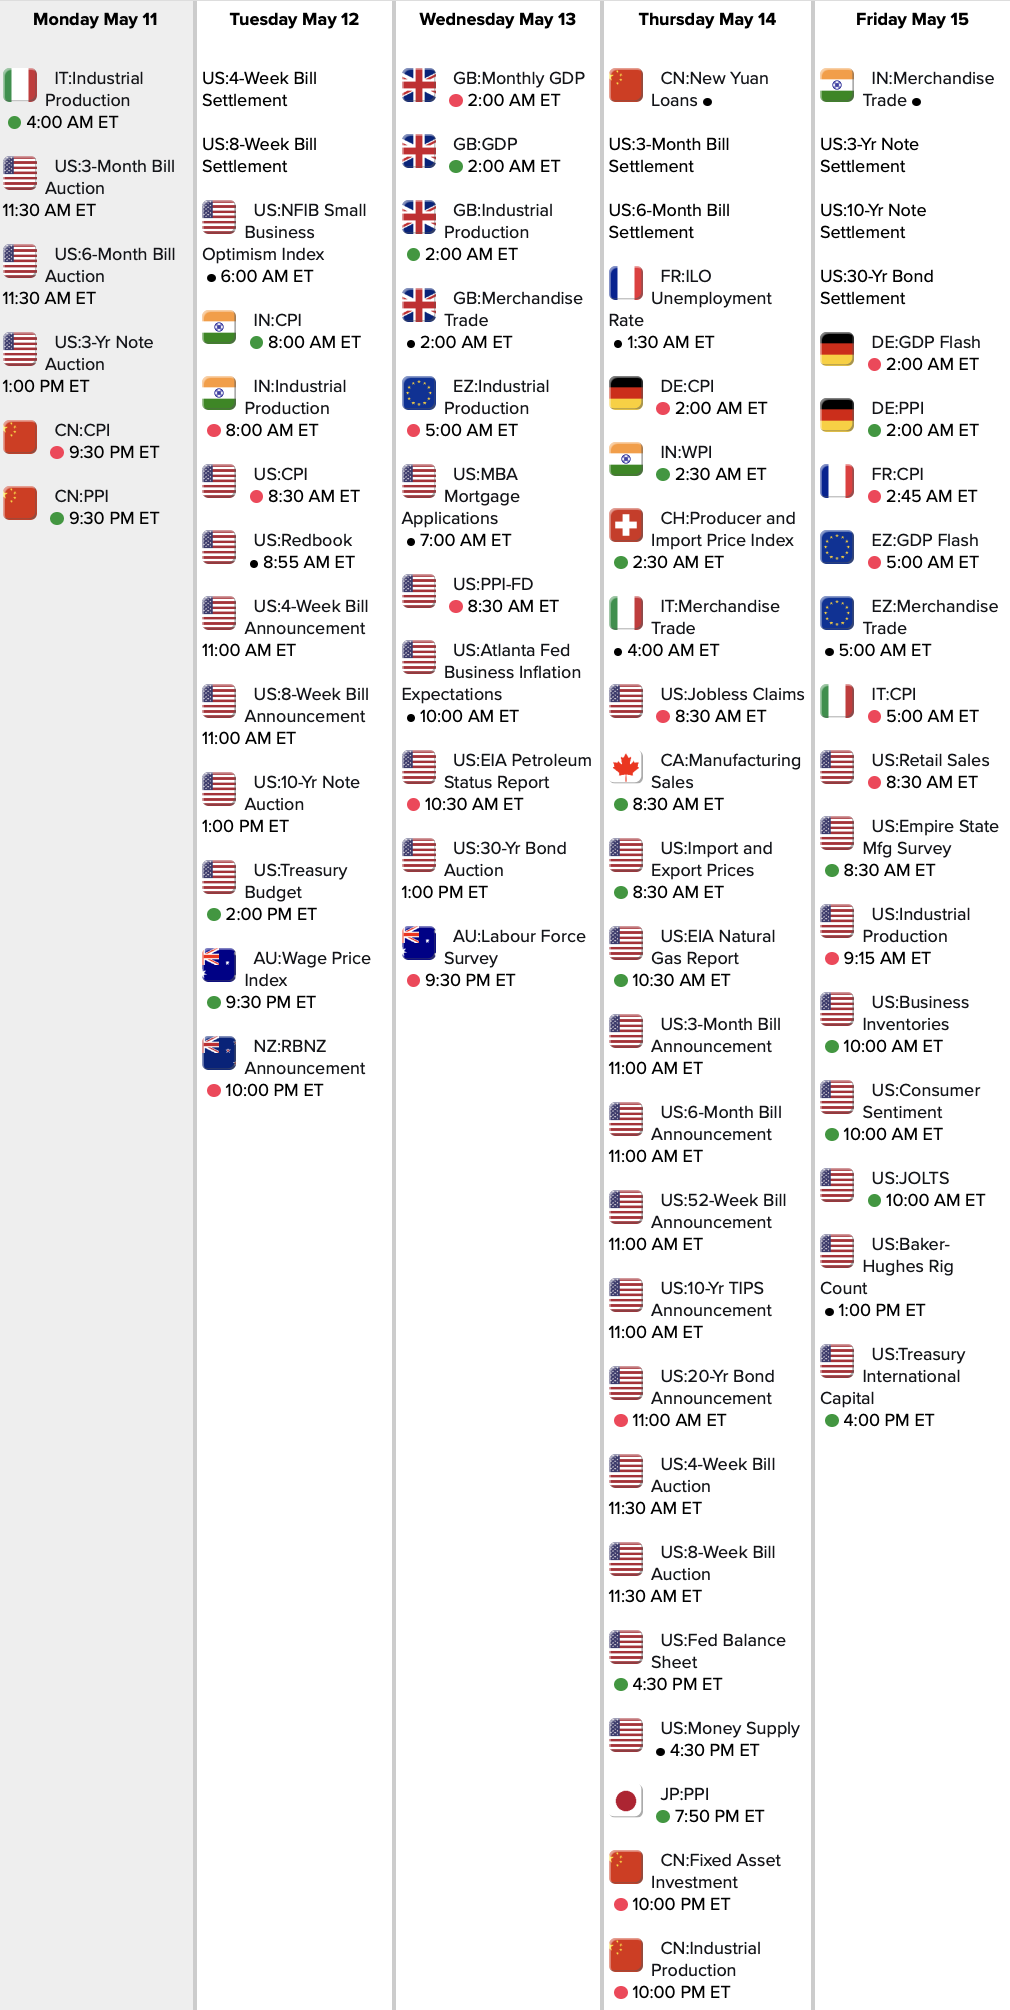
Link to calendar: https://research.investors.com/economic-calendar/
#SPX7dteLong
In the pre-market, filled on GTC order, Sold $SPX May 11th 2840/2860 call spreads for 18.00. Condors bought for 18.20 on Monday. Will sell the put side today. Right now I’m asking 1.80, which I can get with a minor pullback.
#Jobs — biggest losses since WW2
Loss of 20,500,000 non-farm payroll jobs, vs. expected 21.5M loss
Unemployment at 14.7%, up by 10.3%, vs. expected 16%
U6 unemployment at 22.8%, up by 14.1%
Avg Hourly Earnings up 4.3%
Labor force participation 60.2%, down by 2.5, lowest in over a decade
March revised down from -701K to -870K
February revised up from +214K to +230K
#SPX1dte Sold to Open $SPX May 8th 2760/2780-2950/2970 condors for 1.15, IV: 25.5%, SPX 2877, deltas -.05, +.05.
#Earnings $OLED reports tonight. Below are details on earnings one-day moves over the last 12 quarters.
Feb. 20, 2020 AC -2.46%
Oct. 30, 2019 AC +15.27%
Aug. 1, 2019 AC -1.64%
May 2, 2019 AC +8.76%
Feb. 21, 2019 AC +23.03%
Nov. 1, 2018 AC -20.50% Biggest DOWN
Aug. 9, 2018 AC +13.54%
May 3, 2018 AC +12.43%
Feb. 22, 2018 AC -15.81%
Nov. 2, 2017 AC +9.52%
Aug. 3, 2017 AC -1.30%
May 4, 2017 AC +23.87% Biggest UP
Avg (+ or -) 12.34%
Bias 5.39%, strong positive bias on earnings.
With stock at 150.00 the data suggests these ranges:
Based on current IV (expected move into Friday per TOS): 135.19 to 164.81 (+/- 9.9%)
Based on AVERAGE one-day move over last 12 quarters: 131.48 to 168.52
Based on MAXIMUM one-day move over last 12 Q’s (23.9%): 114.20 to 185.81
Based on DOWN max only (-20.5%): 119.25
Open to requests for other symbols.
#SPX7dteLong Bought to open $SPX May 13th 2840/2860-2870/2890 condors for 17.90, with SPX at 2859.
#SPX1dte Expiring: May 6th 2770/2790-2940/2960 condors, sold yesterday for 1.20.
#Earnings $SQ reports tonight. Below are details on earnings one-day moves over the last 12 quarters.
Feb. 26, 2020 AC +3.55%
Nov. 6, 2019 AC +5.00%
Aug. 1, 2019 AC -14.05% Biggest DOWN
May 1, 2019 AC -7.98%
Feb. 27, 2019 AC +2.42%
Nov. 7, 2018 AC -9.02%
Aug. 1, 2018 AC +8.65%
May 2, 2018 AC +1.13%
Feb. 27, 2018 AC +0.30%
Nov. 8, 2017 AC +3.40%
Aug. 2, 2017 AC -4.68%
May 3, 2017 AC +8.86% Biggest UP
Avg (+ or -) 5.75%
Bias -0.20%, slight negative bias on earnings.
With stock at 69.00 the data suggests these ranges:
Based on current IV (expected move into Friday per TOS): 63.23 to 74.77 (+/- 8.4%)
Based on AVERAGE one-day move over last 12 quarters: 65.03 to 72.97
Based on MAXIMUM one-day move over last 12 Q’s (14.1%): 59.31 to 78.69
Based on UP max only (+8.9%): 75.11
Open to requests for other symbols.
I don’t believe the market will keep shrugging this stuff off.
JUST IN: U.S. private payrolls fell by more than 20.2 million in April, the worst loss in the ADP survey’s history. https://t.co/E37a0IjOc5 pic.twitter.com/FRcGtXXVa6
— CNBC (@CNBC) May 6, 2020
#SPX1dte Sold to Open $SPX May 6th 2770/2790-2940/2960 condors for 1.20, IV 23.15%, SPX 2869, deltas -.06, +.04.
#SPX7dteLong Sold to close $SPX May 6th 2950/2970 call spreads for 1.50. Sold put side for 19.00 yesterday. Condors bought for 17.55 last Wednesday, so 2.95 profit overall.
#Earnings $DIS reports tonight. Below are details on earnings one-day moves over the last 12 quarters.
Feb. 4, 2020 AC -2.32%
Nov. 7, 2019 AC +3.76% Biggest UP
Aug. 6, 2019 AC -4.94% Biggest DOWN
May 8, 2019 AC -1.03%
Feb. 5, 2019 AC -1.10%
Nov. 8, 2018 AC +1.72%
Aug. 7, 2018 AC -2.21%
May 8, 2018 AC -1.78%
Feb. 6, 2018 AC -1.32%
Nov. 9, 2017 AC +2.04%
Aug. 8, 2017 AC -3.87%
May 9, 2017 AC -2.15%
Avg (+ or -) 2.35%
Bias -1.10%, negative bias on earnings.
With stock at 105.00 the data suggests these ranges:
Based on current IV (expected move into Friday per TOS): 97.71 to 112.29 (+/- 6.9%)
Based on AVERAGE one-day move over last 12 quarters: 102.53 to 107.47
Based on MAXIMUM one-day move over last 12 Q’s (4.9%): 99.81 to 110.19
Based on UP max only (+3.8%): 108.95
NOTE: Expected move into Friday expiration is much higher than historical moves.
Open to requests for other symbols.
#SPX7dteLong Bought to open $SPX May 11th 2810/2830-2840/2850 condors for 18.20, with SPX at 2840.
Expiring: May 4th 2880/2860 long put spreads at max profit: 20.00. Condors bought for 17.65 last Monday.
#SPX1dte expiring: May 4th 2690/2710-2930/2950 condors, sold Friday for 1.05.
#SPX7dteLong In the pre-market, sold to close $SPX May 6th 2940/2920 put spreads for 19.00. Condors bought for 17.55 last Wednesday. Profit already made, but will try to sell the 2950/2970 call spreads for a bit extra on any push higher.
Looking for the May 4th 2880/2860 put spread to expire today at full profit, 20.00.
#Earnings $REGN reports tonight. Below are details on earnings one-day moves over the last 12 quarters.
Feb. 6, 2020 BO +4.75%
Nov. 5, 2019 BO +6.93%
Aug. 6, 2019 BO +0.23%
May 7, 2019 BO -6.34% Biggest DOWN
Feb. 6, 2019 BO -3.43%
Nov. 6, 2018 BO +0.75%
Aug. 2, 2018 BO +6.99% Biggest UP
May 3, 2018 BO -1.25%
Feb. 8, 2018 BO -3.58%
Nov. 8, 2017 BO +2.66%
Aug. 3, 2017 BO -2.03%
May 4, 2017 BO +6.70%
Avg (+ or -) 3.80%
Bias 1.03%, positive bias on earnings.
With stock at 540.00 the data suggests these ranges:
Based on current IV (expected move into Friday per TOS): 509.48 to 570.52 (+/- 5.7%)
Based on AVERAGE one-day move over last 12 quarters: 519.46 to 560.54
Based on MAXIMUM one-day move over last 12 Q’s (7.0%): 502.25 to 577.75
Based on DOWN max only (-6.3%): 505.76
NOTE: 5-day max moves are -9.1% and +9.9%.
Open to requests for other symbols.
Online Offerings Overload, Extraction, The Lighthouse, The Beastie Boys Story, Fiona Apple, New Music Picks, Essential Picks, Listener NitPick // Find more details, links and playlists at http://thepickcast.com
#SPX1dte Sold to Open $SPX May 4th 2695/2710-2930/2950 condors for 1.05, IV 22.5%, SPX 2833, deltas: -.04, +.04
#SPX7dteLong Bought to Open $SPX May 8th 2810/2830-2840/2850 condors for 18.40, w/SPX at 2829.
#Jobs report for April is Friday… it’ll be a doozy!

#Earnings Bought to close $AMZN 2325/2320 put spreads for 4.70. Sold for 1.50 yesterday.
Finally, the market seems to be doing what it should have been doing for weeks… dropping. Of course it was right after I decided to take bullish earnings trades! At least I got out of TSLA, but saving a few pennies by dumping out before expiration on this one. Not sure if I’m going to roll or just accept the loss. Gotta deal with my threatened SPX puts for now.
$TSLA trade closed with profit before the drop…. $AMZN not gonna work…
$TSLA drops after CEO Elon Musk says stock price is "too high." https://t.co/wb2mDn0Q4F
— CNBC (@CNBC) May 1, 2020
#Earnings Things looking a bit murky today, so closed $TSLA May 1st 720/715 put spreads for .30. Sold for 1.25 on Wednesday. Also have $AMZN put spread currently ATM.
#SPX1dte Sold to Open $SPX May 1st 2800/2820-2990/3010 condors for 1.30. IV 25.6%, SPX 2906, deltas -.07, +.04
Expiring: Apr 30th 2830/2850-3015/3035 condors, sold yesterday for 1.00.
#Earnings
Sold to Open $AMZN May 1st 2325/2320 put spreads for 1.50. With stock at 2430, that’s 4.3% OTM.
#Earnings $AAPL reports tonight. Below are details on earnings one-day moves over the last 12 quarters.
Jan. 28, 2020 AC +2.09%
Oct. 30, 2019 AC +2.26%
July 30, 2019 AC +2.04%
April 30, 2019 AC +4.90%
Jan. 29, 2019 AC +6.83% Biggest UP
Nov. 1, 2018 AC -6.63% Biggest DOWN
July 31, 2018 AC +5.89%
May 1, 2018 AC +4.41%
Feb. 1, 2018 AC -4.33%
Nov. 2, 2017 AC +2.61%
Aug. 1, 2017 AC +4.72%
May 2, 2017 AC -0.30%
Avg (+ or -) 3.92%
Bias 2.04%, strongly positive bias on earnings.
With stock at 292.50 the data suggests these ranges:
Based on current IV (expected move into Friday per TOS): 279.77 to 305.23 (+/- 4.4%)
Based on AVERAGE one-day move over last 12 quarters: 281.04 to 303.96
Based on MAXIMUM one-day move over last 12 Q’s (6.8%): 272.52 to 312.48
Based on DOWN max only (-6.6%): 273.11
Open to requests for other symbols.
#Earnings $AMZN reports tonight. Below are details on earnings one-day moves over the last 12 quarters.
Jan. 30, 2020 AC +7.37%
Oct. 24, 2019 AC -1.09%
July 25, 2019 AC -1.55%
April 25, 2019 AC +2.54%
Jan. 31, 2019 AC -5.38%
Oct. 25, 2018 AC -7.81% Biggest DOWN
July 26, 2018 AC +0.51%
April 26, 2018 AC +3.60%
Feb. 1, 2018 AC +2.87%
Oct. 26, 2017 AC +13.21% Biggest UP
July 27, 2017 AC -2.48%
April 27, 2017 AC +0.71%
Avg (+ or -) 4.09%
Bias 1.04%, positive bias on earnings.
With stock at 2430.00 the data suggests these ranges:
Based on current IV (expected move into Friday per TOS): 2276.91 to 2583.09 (+/- 6.3%)
Based on AVERAGE one-day move over last 12 quarters: 2330.53 to 2529.47
Based on MAXIMUM one-day move over last 12 Q’s (13.2%): 2109.00 to 2751.00
Based on DOWN max only (-7.8%): 2240.22
Open to requests for other symbols.
#SPX7dteLong Yesterday an hour before market close,
Sold to close $SPX May 1st 2840/2860 call spreads for 18.40.
This morning, half hour before the open,
Sold to close May 1st 2830/2810 put spreads for 1.20.
Condors bought last Friday for 18.05, sold this week for 19.60.
#SPX7dteLong Bought to Open $SPX May 6th 2920/2940-2950/2960 condors for 17.60. (SPX at 2945)
#SPX1dte Sold to Open $SPX Apr 30th 2830/2850-3015/3035 condors for 1.00, IV 23.5%, SPX 2842, deltas -.05, +.05.
#SPX1dte Bought to close $SPX Apr 29th 2960/2980 call spreads for 2.00. Condors sold yesterday for 1.10.
#Earnings Sold to Open $TSLA May 1st 720/715 put spreads for 1.25, when stock is at 787.00. -8.5% OTM. Frankly, I’m too nervous to sell the call side. In October, it was up 17.7% after one day, but 28.8% after 3 days.
#Earnings $TSLA reports tonight. Below are details on earnings one-day moves over the last 12 quarters.
Jan. 29, 2020 AC +10.29%
Oct. 23, 2019 AC +17.66% Biggest UP
July 24, 2019 AC -13.61% Biggest DOWN
April 24, 2019 AC -4.26%
Jan. 30, 2019 AC -0.56%
Oct. 24, 2018 AC +9.13%
Aug. 1, 2018 AC +16.18%
May 2, 2018 AC -5.54%
Feb. 7, 2018 AC -8.62%
Nov. 1, 2017 AC -6.79%
Aug. 2, 2017 AC +6.50%
May 3, 2017 AC -5.00%
Avg (+ or -) 8.68%
Bias 1.28%, positive bias on earnings.
With stock at 792.00 the data suggests these ranges:
Based on current IV (expected move into Friday per TOS): 705.26 to 878.74 (+/- 11.0%)
Based on AVERAGE one-day move over last 12 quarters: 723.27 to 860.73
Based on MAXIMUM one-day move over last 12 Q’s (17.7%): 652.13 to 931.87
Based on DOWN max only (-13.6%): 684.21
Open to requests for other symbols.
#Earnings $FB reports tonight. Below are details on earnings one-day moves over the last 12 quarters.
Jan. 29, 2020 AC -6.13%
Oct. 30, 2019 AC +1.80%
July 24, 2019 AC -1.93%
April 24, 2019 AC +5.84%
Jan. 30, 2019 AC +10.81% Biggest UP
Oct. 30, 2018 AC +3.80%
July 25, 2018 AC -18.96% Biggest DOWN
April 25, 2018 AC +9.06%
Jan. 31, 2018 AC +3.31%
Nov. 1, 2017 AC -2.04%
July 26, 2017 AC +2.91%
May 3, 2017 AC -0.62%
Avg (+ or -) 5.60%
Bias 0.65%, positive bias on earnings.
With stock at 194.00 the data suggests these ranges:
Based on current IV (expected move into Friday per TOS): 181.69 to 206.31 (+/- 6.3%)
Based on AVERAGE one-day move over last 12 quarters: 183.13 to 204.87
Based on MAXIMUM one-day move over last 12 Q’s (19.0%): 157.22 to 230.78
Based on UP max only (+10.8%): 214.97
Open to requests for other symbols.
#SPX1dte Sold to Open $SPX Apr 29th 2765/2785-2960/2980 condors for 1.10, IV 25%, SPX 2882, deltas -.05, +.05.
Extra expiration on Thursday (end-of-month) so this starts four straight days of 1-dte.
#SPX7dteLong Sold to close $SPX Apr 29th 2810/2830 call spreads for 18.00, filled overnight (forgot order was in, otherwise would have increased bid)
Just now, sold to close Apr 29th 2800/2780 put spread for 1.15.
Condors sold for 18.35 last Wednesday, sold for 19.15 today.
#Earnings $AMD reports tonight. Below are details on earnings one-day moves over the last 12 quarters.
Jan. 28, 2020 AC -5.97%
Oct. 29, 2019 AC +0.30%
July 30, 2019 AC -10.09%
April 30, 2019 AC -2.96%
Jan. 29, 2019 AC +19.94% Biggest UP
Oct. 24, 2018 AC -15.44%
July 25, 2018 AC +14.33%
April 25, 2018 AC +13.69%
Jan. 30, 2018 AC +6.75%
Oct. 24, 2017 AC -13.47%
July 25, 2017 AC +4.60%
May 1, 2017 AC -24.22% Biggest DOWN
Avg (+ or -) 10.98%
Bias -1.05%, negative bias on earnings.
With stock at 56.00 the data suggests these ranges:
Based on current IV (expected move into Friday per TOS): 50.97 to 61.03 (+/- 9.0%)
Based on AVERAGE one-day move over last 12 quarters: 49.85 to 62.15
Based on MAXIMUM one-day move over last 12 Q’s (24.2%): 42.44 to 69.56
Based on UP max only (+19.9%): 67.17
Open to requests for other symbols.
#Earnings $GOOGL reports tonight. Below are details on earnings one-day moves over the last 12 quarters.
Feb. 3, 2020 AC -2.50%
Oct. 28, 2019 AC -2.19%
July 25, 2019 AC +9.62% Biggest UP
April 29, 2019 AC -7.50% Biggest DOWN
Feb. 4, 2019 AC +0.91%
Oct. 25, 2018 AC -1.79%
July 23, 2018 AC +3.89%
April 23, 2018 AC -4.76%
Feb. 1, 2018 AC -5.28%
Oct. 26, 2017 AC +4.26%
July 24, 2017 AC -2.93%
April 27, 2017 AC +3.71%
Avg (+ or -) 4.11%
Bias -0.38%, slightly negative bias on earnings.
With stock at 1270.00 the data suggests these ranges:
Based on current IV (expected move into Friday per TOS): 1199.46 to 1340.54 (+/- 5.6%)
Based on AVERAGE one-day move over last 12 quarters: 1217.78 to 1322.22
Based on MAXIMUM one-day move over last 12 Q’s (9.6%): 1147.83 to 1392.17
Based on DOWN max only (-7.5%): 1174.75
Open to requests for other symbols.
#SPX7dteLong Earlier in the day, STC $SPX Apr 27th 2840/2860 call spreads for 19.30. Condors bought for 18.35 last Monday.
Bought to Open $SPX May 4th 2860/2880-2890/2910 condors for 17.65. First time I have gotten under 18.00, meaning volatility is dropping.
#SPX1dte Expiring: Apr 27th 2710/2730/2935/2955 condors, sold Friday for 1.05.
#Earnings $FFIV reports tonight. Below are details on earnings one-day moves over the last 12 quarters.
Jan. 27, 2020 AC -5.04%
Oct. 23, 2019 AC +5.50%
July 24, 2019 AC -0.65%
April 24, 2019 AC -1.08%
Jan. 23, 2019 AC -2.22%
Oct. 24, 2018 AC +6.10% Biggest UP
July 25, 2018 AC +1.07%
April 25, 2018 AC +0.89%
Jan. 24, 2018 AC -5.05%
Oct. 25, 2017 AC +3.97%
July 26, 2017 AC -7.16%
April 26, 2017 AC -7.50% Biggest DOWN
Avg (+ or -) 3.85%
Bias -0.93%, negative bias on earnings.
With stock at 130.00 the data suggests these ranges:
Based on current IV (expected move into Friday per TOS): 121.47 to 138.53 (+/- 6.6%)
Based on AVERAGE one-day move over last 12 quarters: 124.99 to 135.01
Based on MAXIMUM one-day move over last 12 Q’s (7.5%): 120.25 to 139.75
Based on UP max only (+6.1%): 137.93
NOTE: 5-day max moves are -7.97% and +4.33%, so slightly more bearish than the one-day.
Open to requests for other symbols.
#FOMC Meeting Announcement on Wednesday

Link to calendar: https://research.investors.com/economic-calendar/
