
#SPX1dte Sold $SPX Apr 27th 2710/2730-2935/2955 condors for 1.05, IV 20.4%, SPX 2840, deltas -.04,+.04
Expiring: 2675/2695-2880/2900 condors, sold yesterday for 1.00.
#SPX1dte Sold $SPX Apr 27th 2710/2730-2935/2955 condors for 1.05, IV 20.4%, SPX 2840, deltas -.04,+.04
Expiring: 2675/2695-2880/2900 condors, sold yesterday for 1.00.
#SPX7dteLong. Bought to open $SPX May 1st 2810/2830-2840/2860 condors for 18.05.
Earlier, sold to close Apr 24th 2840/2820 put spreads for 15.20, and 2850/2870 calls spreads for .30. Bought last week for 18.30. Second loss on this strategy… still learning a bit as I go, but could have waited a bit later in the morning and gotten 17.00+ for put side.
The SPX has been consolidating around 2800 for over a week, making this strategy less palatable.
SPX1dte Sold to Open, 4 minutes after the market closed:
$SPX Apr 24th 2675/2695-2880/2900 condors for 1.00, IV 27.75%, SPX 2797, deltas: -.04,+.04
#Earnings $SKX reports tonight. Below are details on earnings one-day moves over the last 12 quarters.
Feb. 6, 2020 AC +4.05%
Oct. 22, 2019 AC -3.36%
July 18, 2019 AC +11.96%
April 18, 2019 BO -10.43%
Feb. 7, 2019 AC +15.19%
Oct. 18, 2018 AC +13.78%
July 19, 2018 AC -20.99%
April 19, 2018 AC -27.04% Biggest DOWN
Feb. 8, 2018 AC +7.54%
Oct. 19, 2017 AC +41.44% Biggest UP
July 20, 2017 AC +0.67%
April 20, 2017 AC -2.56%
Avg (+ or -) 13.25%
Bias 2.52%, positive bias on earnings.
With stock at 25.00 the data suggests these ranges:
Based on current IV (expected move into Friday per TOS): 21.80 to 28.20 (+/- 12.8%)
Based on AVERAGE one-day move over last 12 quarters: 21.69 to 28.31
Based on MAXIMUM one-day move over last 12 Q’s (41.4%): 14.64 to 35.36
Based on DOWN max only (-27.0%): 18.24
Open to requests for other symbols.
#SPX1dte Expired: $SPX Apr 22nd 2595/2615-2840/2860 condors, sold yesterday for 1.25.
Something I’ve been trying for a couple weeks but haven’t yet shared because it was in “test phase”… since volatility is here to stay for awhile, I have been buying one-week-out ATM condors with only 10-points between the shorts. The idea is that the market moves, and we most likely will be higher or lower a week from now.
So far it worked five times in a row… then the 6th one today was the first loss! But I’m going to stick with it as long as it continues to work and volatility is with us.
Today’s closing trade:
Last Wednesday, bought to Open $SPX Apr 22nd 2760/2780-2790/2810 condors for 18.35. (opening price has consistently been 18.25-18.40)
Today, sold to close the put side for 3.50 at 9:49am PT. Call side expired at 8.02. Total credit 11.52, so 6.80 loss.
All of the other ones I have done have either expired for 20.00, or closed a day or more early for 19.00+.
It is difficult to have much control over these trades unless you wish to go for pure speculation and leg out on ups and downs during the week. Otherwise you are at the mercy of the market on expiration day. Today was a bit nerve-wracking because SPX hovered in my dead zone for most of the morning. When it started trending upward, I took the profit on put side (first time I have legged out). Call side looked to be a 100% winner until the last 5 minutes, when it quickly turned from a 5.15 winner to a 6.80 loser. If I had exited before the drop i probably could have gotten 17.00 or so maximum, since the short 2810 call kept a lot of value until the last couple minutes of the day.
Bought to Open $SPX Apr 29th 2780/2800-2810/2830 condors for 18.40.
Also currently holding
Apr 24th 2820/2840-2850/2870
Apr 27th 2810/2830-2840/2860
#Earnings $LRCX reports tonight. Below are details on earnings one-day moves over the last 12 quarters.
Jan. 29, 2020 AC +4.26%
Oct. 23, 2019 AC +13.90%
July 31, 2019 AC -1.36%
April 24, 2019 AC +4.93%
Jan. 23, 2019 AC +15.69% Biggest UP
Oct. 16, 2018 AC +1.31%
July 26, 2018 AC +7.19%
April 17, 2018 AC -4.03%
Jan. 24, 2018 AC -4.99% Biggest DOWN
Oct. 17, 2017 AC +3.05%
July 26, 2017 AC -2.12%
April 18, 2017 AC +6.85%
Avg (+ or -) 5.81%
Bias 3.72%, strongly positive bias on earnings.
With stock at 260.00 the data suggests these ranges:
Based on current IV (expected move into Friday per TOS): 234.20 to 285.80 (+/- 9.9%)
Based on AVERAGE one-day move over last 12 quarters: 244.90 to 275.10
Based on MAXIMUM one-day move over last 12 Q’s (15.7%): 219.21 to 300.79
Based on DOWN max only (-5.0%): 247.03
Open to requests for other symbols.
#Earnings $NFLX reports tonight. Below are details on earnings one-day moves over the last 12 quarters.
Jan. 21, 2020 AC -3.58%
Oct. 16, 2019 AC +2.46%
July 17, 2019 AC -10.27% Biggest DOWN
April 16, 2019 AC -1.31%
Jan. 17, 2019 AC -3.98%
Oct. 16, 2018 AC +5.28%
July 16, 2018 AC -5.24%
April 16, 2018 AC +9.18%
Jan. 22, 2018 AC +9.97%
Oct. 16, 2017 AC -1.57%
July 17, 2017 AC +13.54% Biggest UP
April 17, 2017 AC -2.64%
Avg (+ or -) 5.75%
Bias 0.99%, positive bias on earnings.
With stock at 435.00 the data suggests these ranges:
Based on current IV (expected move into Friday per TOS): 385.03 to 484.97 (+/- 11.5%)
Based on AVERAGE one-day move over last 12 quarters: 409.98 to 460.02
Based on MAXIMUM one-day move over last 12 Q’s (13.5%): 376.10 to 493.90
Based on DOWN max only (-10.3%): 390.33
Open to requests for other symbols.
#SPX1dte Sold to Open $SPX Apr 22nd 2596/2615-2840/2860 condors for 1.25, IV 36%, SPX 2736, delats -.05, +.05
STC $TQQQ Jan 2021 90 calls for 6.50. Bought for 2.50 on March 16th
STC $TQQQ Jan 2021 85 calls for 7.80. Bought for 1.90 on March 27th
I will enter these again when market drops further.
#SPX1dte The bullish slant didn’t come through but got to keep the credit.
$SPX April 20th long call spread and short put spread expired, put on Friday for .55 credit.
#SPX1dte. Given the clearly bullish fervor that has gripped Wall Street, however irrational, I’m selling a more aggressive put spread and buying a call spread, all for a net credit.
Sold $SPX Apr 20th 2775/2755 put spreads
Bought $SPX Apr 20th 2790/2900 call spreads
Total credit: 0.55
IV 24%, SPX 2872, deltas: -.10, +.05
Expiring today: Apr 20th 2655/2675-2895/2915 condors, sold yesterday for 1.20


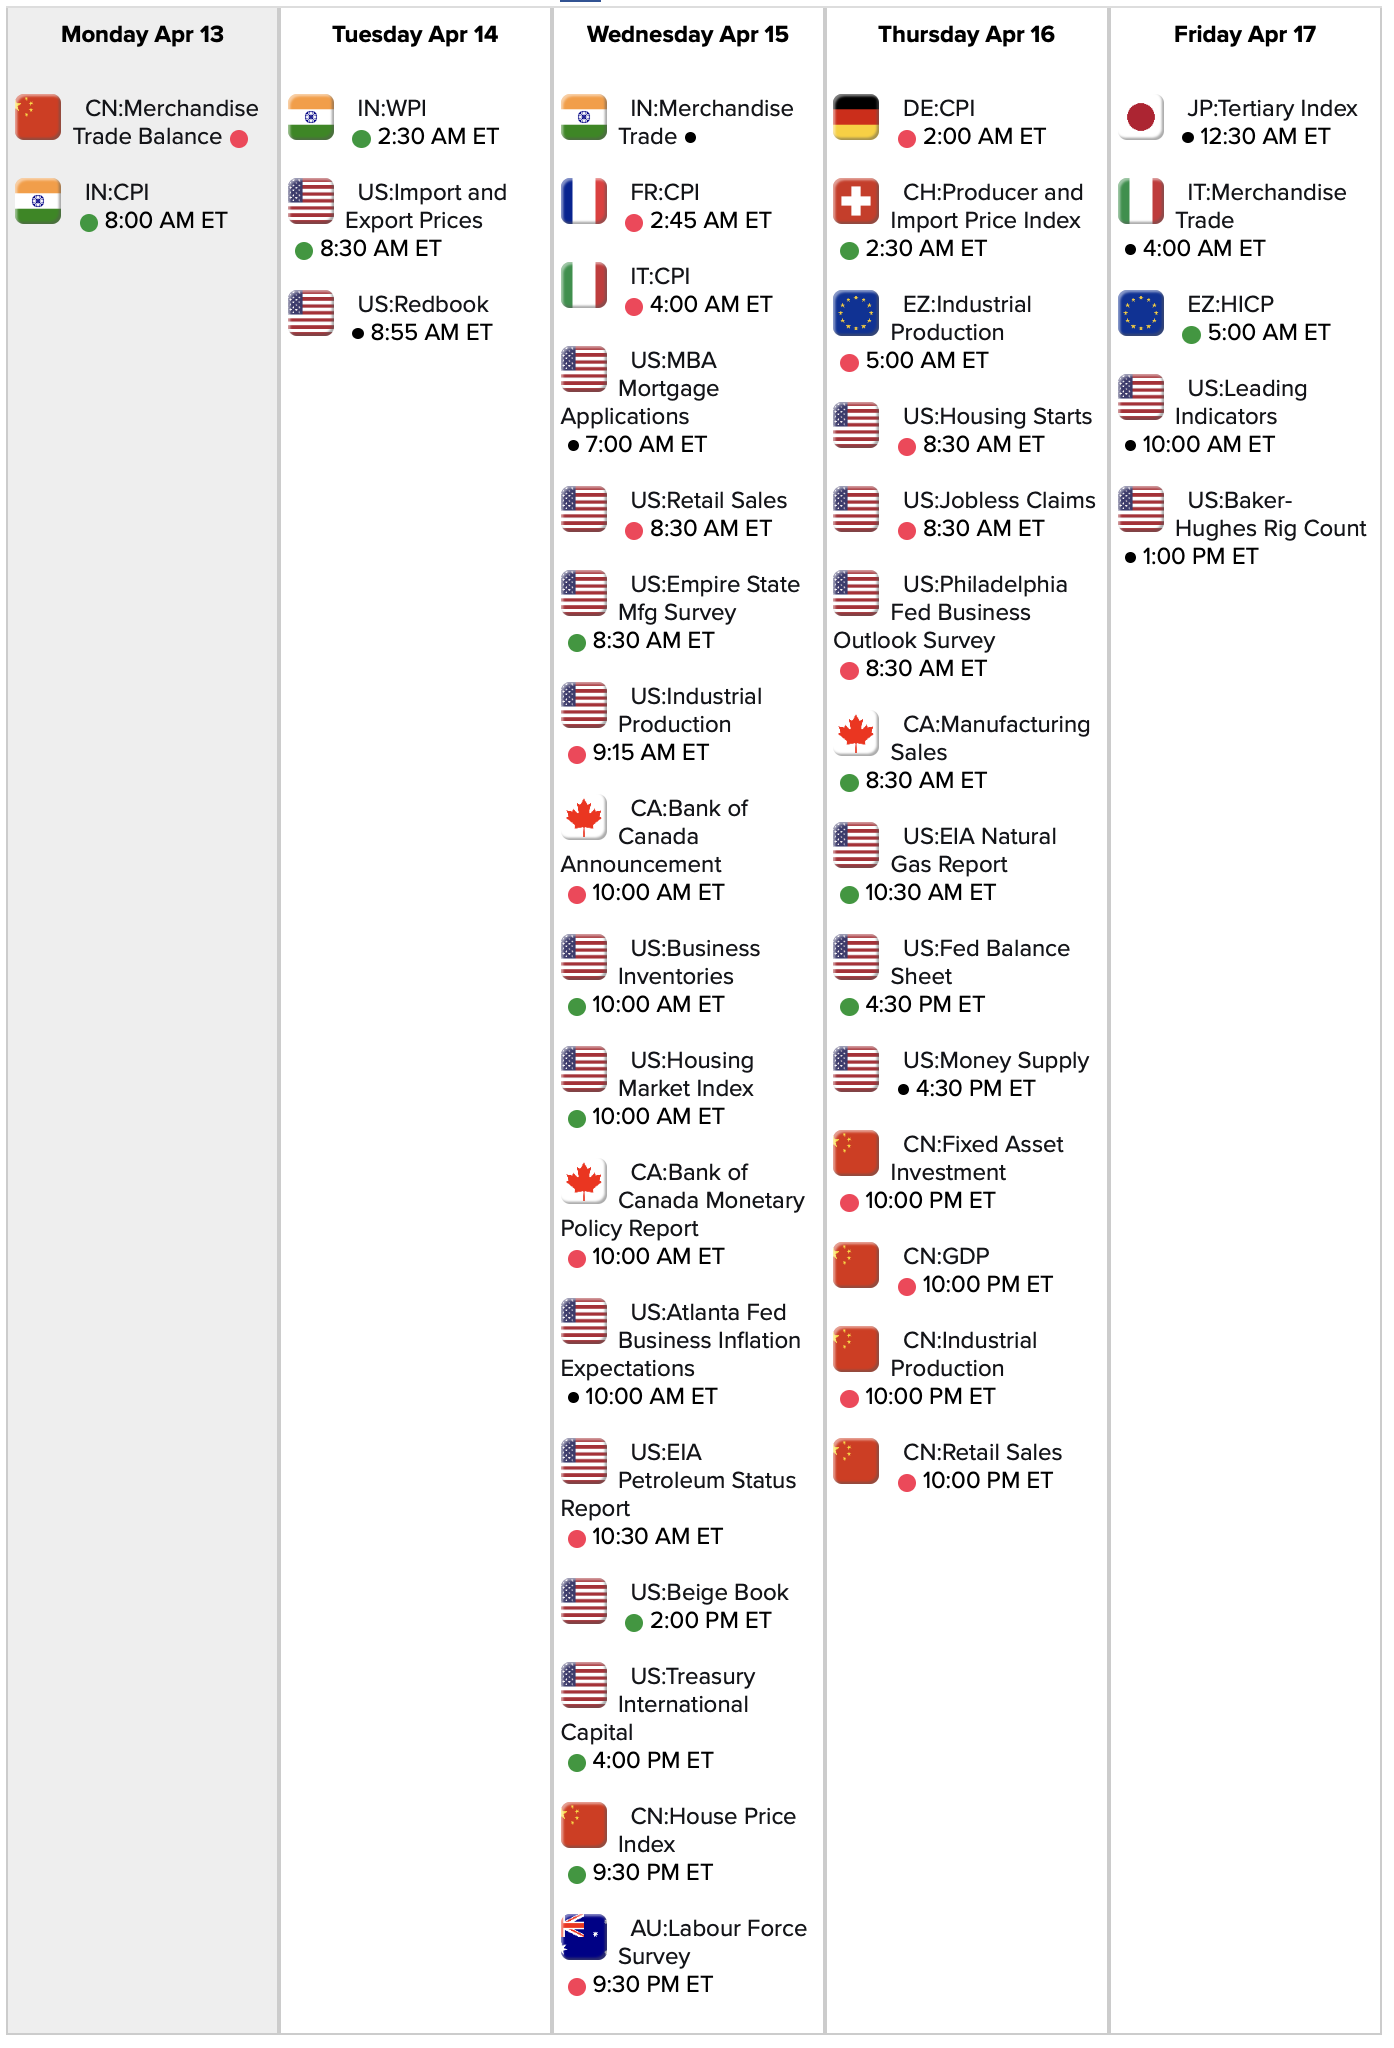
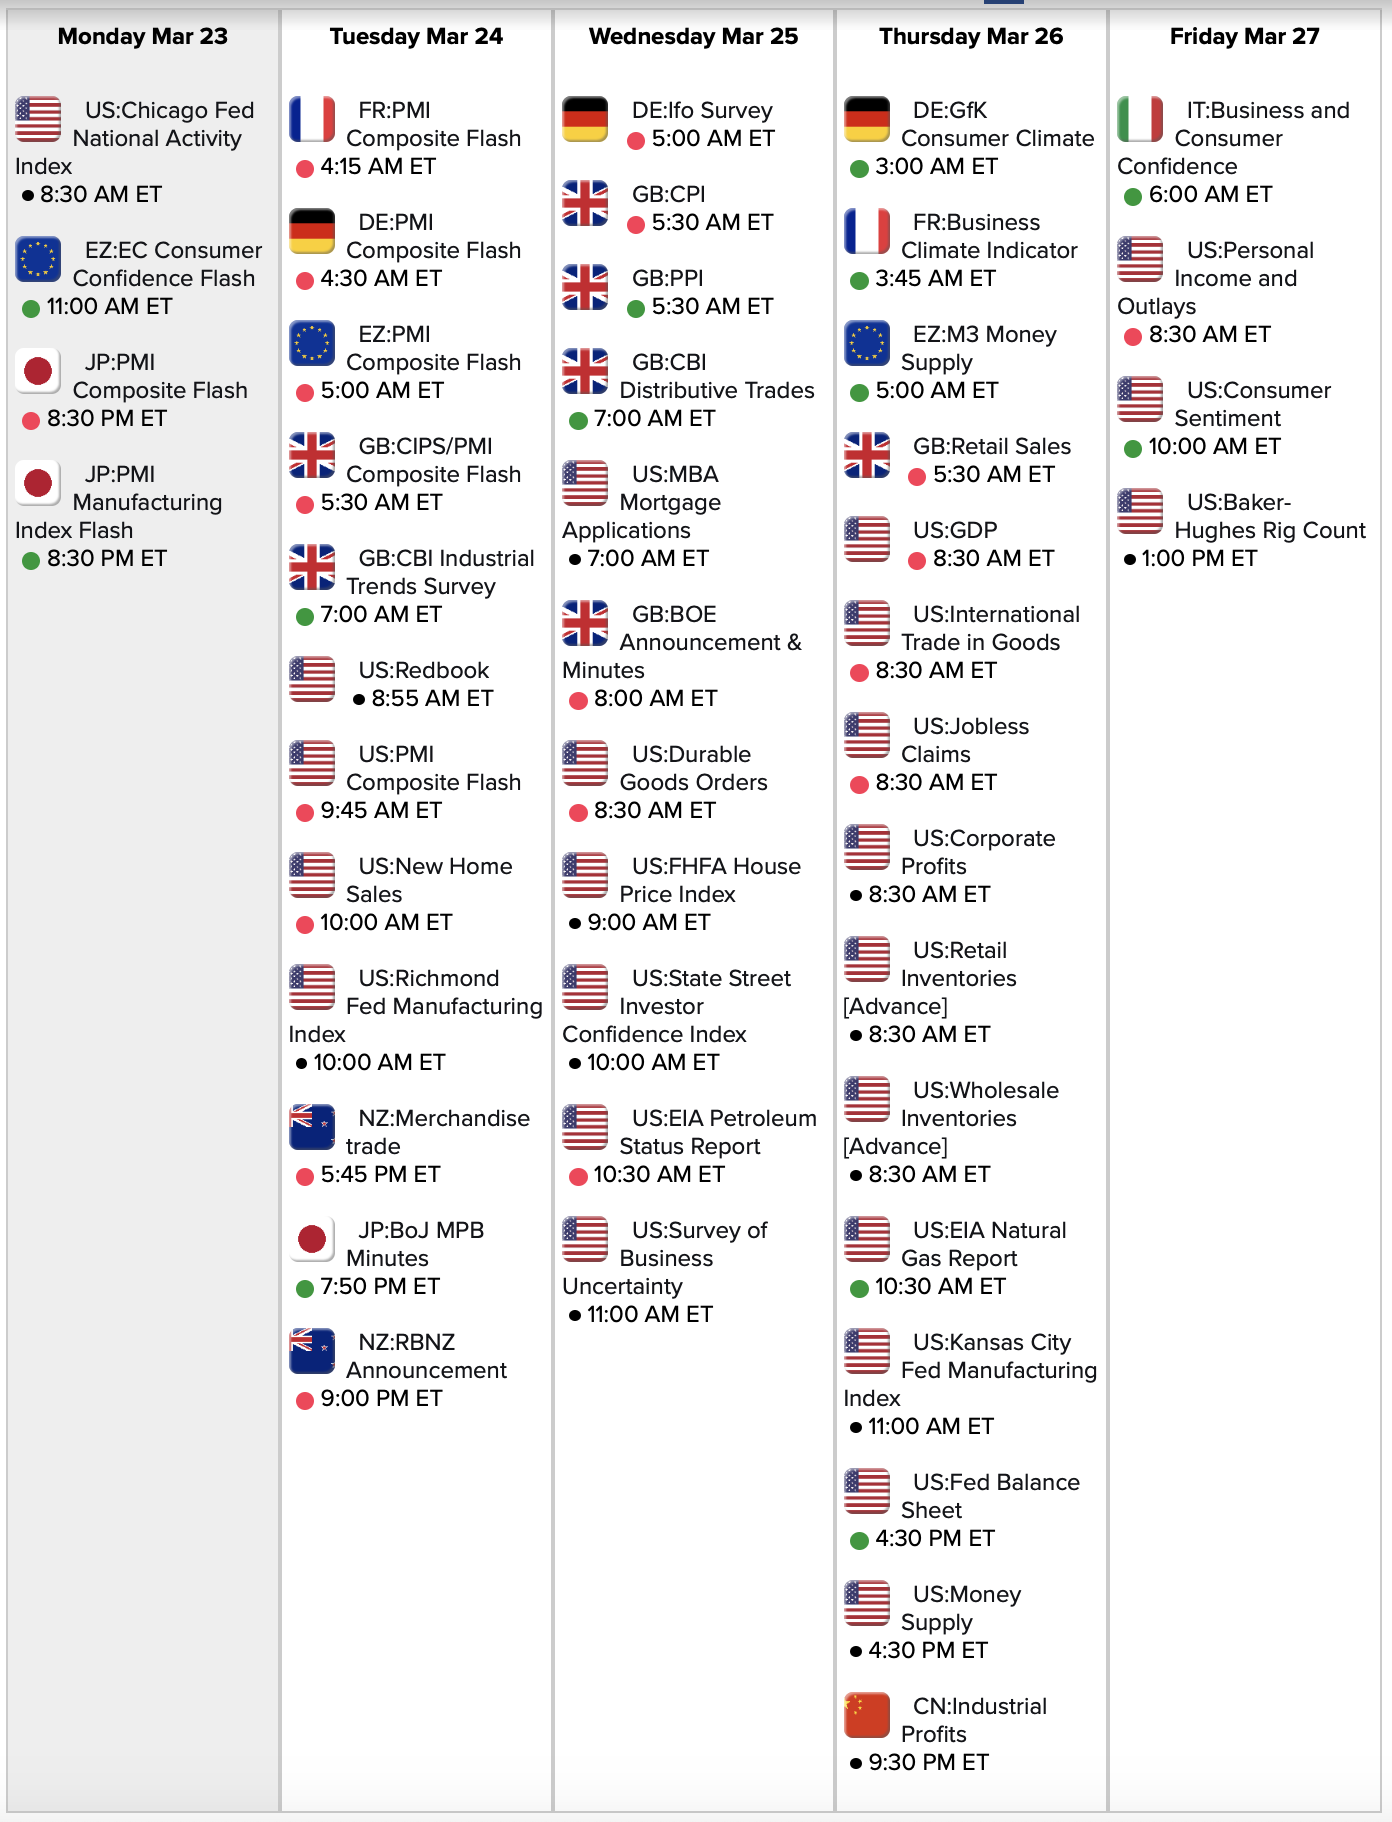
Link to calendar: https://research.investors.com/economic-calendar/
S&P 500 ETF jumps 2% after hours on report Gilead drug showing effectiveness treating coronavirus
https://www.cnbc.com/2020/04/16/sp-500-etf-jumps-2percent-after-hours-on-report-gilead-drug-showing-effectiveness-treating-coronavirus.html?__source=twitter%7Cmain
#SPX1dte Sold to Open $SPX April 17th 2655/2675-2895/2915 condors for 1.20. IV: 33%, SPX 2795, deltas -.04, +.06
$PG announces tomorrow morning
#Earnings $ISRG reports tonight. Below are details on earnings one-day moves over the last 12 quarters.
Jan. 23, 2020 AC -4.19%
Oct. 17, 2019 AC +6.96%
July 18, 2019 AC -1.45%
April 18, 2019 AC -7.00% Biggest DOWN
Jan. 24, 2019 AC -3.93%
Oct. 18, 2018 AC -3.45%
July 19, 2018 AC -0.86%
April 17, 2018 AC +8.17% Biggest UP
Jan. 25, 2018 AC -2.12%
Oct. 19, 2017 AC +3.39%
July 20, 2017 AC -4.55%
April 18, 2017 AC +6.36%
Avg (+ or -) 4.37%
Bias -0.22%, small negative bias on earnings.
With stock at 510.00 the data suggests these ranges:
Based on current IV (expected move into Friday per TOS): 484.03 to 535.97 (+/- 5.1%)
Based on AVERAGE one-day move over last 12 quarters: 487.28 to 532.28
Based on MAXIMUM one-day move over last 12 Q’s (8.2%): 468.33 to 551.67
Based on DOWN max only (-7.0%): 474.30
Open to requests for other symbols.
$SPX1dte Sold to Open $SPX April 15th 2705/2725-2940/2960 condors for 1.15, IV: 31.8%, SPX 2841, deltas -.05, +.04.
#Earnings $GS reports tomorrow morning. Below are details on earnings one-day moves over the last 12 quarters.
Jan. 15, 2020 BO -0.18%
Oct. 15, 2019 BO +0.31%
July 16, 2019 BO +1.86%
April 15, 2019 BO -3.81%
Jan. 16, 2019 BO +9.54% Biggest UP
Oct. 16, 2018 BO +3.01%
July 17, 2018 BO -0.18%
April 17, 2018 BO -1.64%
Jan. 17, 2018 BO -1.86%
Oct. 17, 2017 BO -2.60%
July 18, 2017 BO -2.59%
April 18, 2017 BO -4.71% Biggest DOWN
Avg (+ or -) 2.69%
Bias -0.24%, small negative bias on earnings.
With stock at 177.50 the data suggests these ranges:
Based on current IV (expected move into Friday per TOS): 167.70 to 187.30 (+/- 5.5%)
Based on AVERAGE one-day move over last 12 quarters: 172.72 to 182.28
Based on MAXIMUM one-day move over last 12 Q’s (9.5%): 160.57 to 194.43
Based on DOWN max only (-4.7%): 169.14
Open to requests for other symbols.
#Earnings $JPM reports tomorrow morning. Below are details on earnings one-day moves over the last 12 quarters.
Jan. 14, 2020 BO +1.16%
Oct. 15, 2019 BO +3.01%
July 16, 2019 BO +1.07%
April 12, 2019 BO +4.68%
Jan. 15, 2019 BO +0.73%
Oct. 12, 2018 BO -1.09%
July 13, 2018 BO -0.45%
April 13, 2018 BO -2.70%
Jan. 12, 2018 BO +1.65%
Oct. 12, 2017 BO -0.28%
July 14, 2017 BO -0.91%
April 13, 2017 BO -1.17%
Avg (+ or -) 1.58%
Bias 0.48%, positive bias on earnings.
With stock at 99.00 the data suggests these ranges:
Based on current IV (expected move into Friday per TOS): 91.39 to 106.61 (+/- 7.7%)
Based on AVERAGE one-day move over last 12 quarters: 97.44 to 100.56
Based on MAXIMUM one-day move over last 12 Q’s (4.7%): 94.37 to 103.63
Based on DOWN max only (-2.7%): 96.33
NOTE: 5-day maxes are virtually the same as 1-day: -2.8% and +4.6%. But projected move into Friday is higher than any of these previous moves (+/- 7.7%)
Open to requests for other symbols.
Bill Withers, Kenny Rogers & the First Edition, and more shows and movies than you can shake a Pick at for your quarantine streaming checklist.
Link to calendar: https://research.investors.com/economic-calendar/
#SPX1dte After getting slammed for the third time this year on a Monday, I am going long the condor for this three-day weekend.
Bought to Open $SPX April 13th 2590/2610-2920/2940 condors for 1.55. Any gap open will give me at least a small profit. The tough part will be whether to wait and see if we get another 5%+ day…
#SPX1dte Expiring: $SPX April 8th 2505/2525-2800/2820 condors, sold yesterday for 1.25
#SPX1dte Sold to Open $SPX April 8th 2505/2525-2800/2820 condors for 1.25, IV: 43%, SPX 2664, deltas -.05, +.04.
Went a little farther out than usual delta-wise after yesterday’s beating.
#SPX1dte My Friday condor was blown out on the upside… I foolishly thought we had calmed down enough that we wouldn’t have a 7% up day. Full loss… sold for 1.75. This means I’ve done nothing but tread water on this strategy this year.
#Earnings TOS is showing that $CCL reported during market hours today, .22 per share vs. 0.33 consensus.
#FOMC minutes Wednesday afternoon.
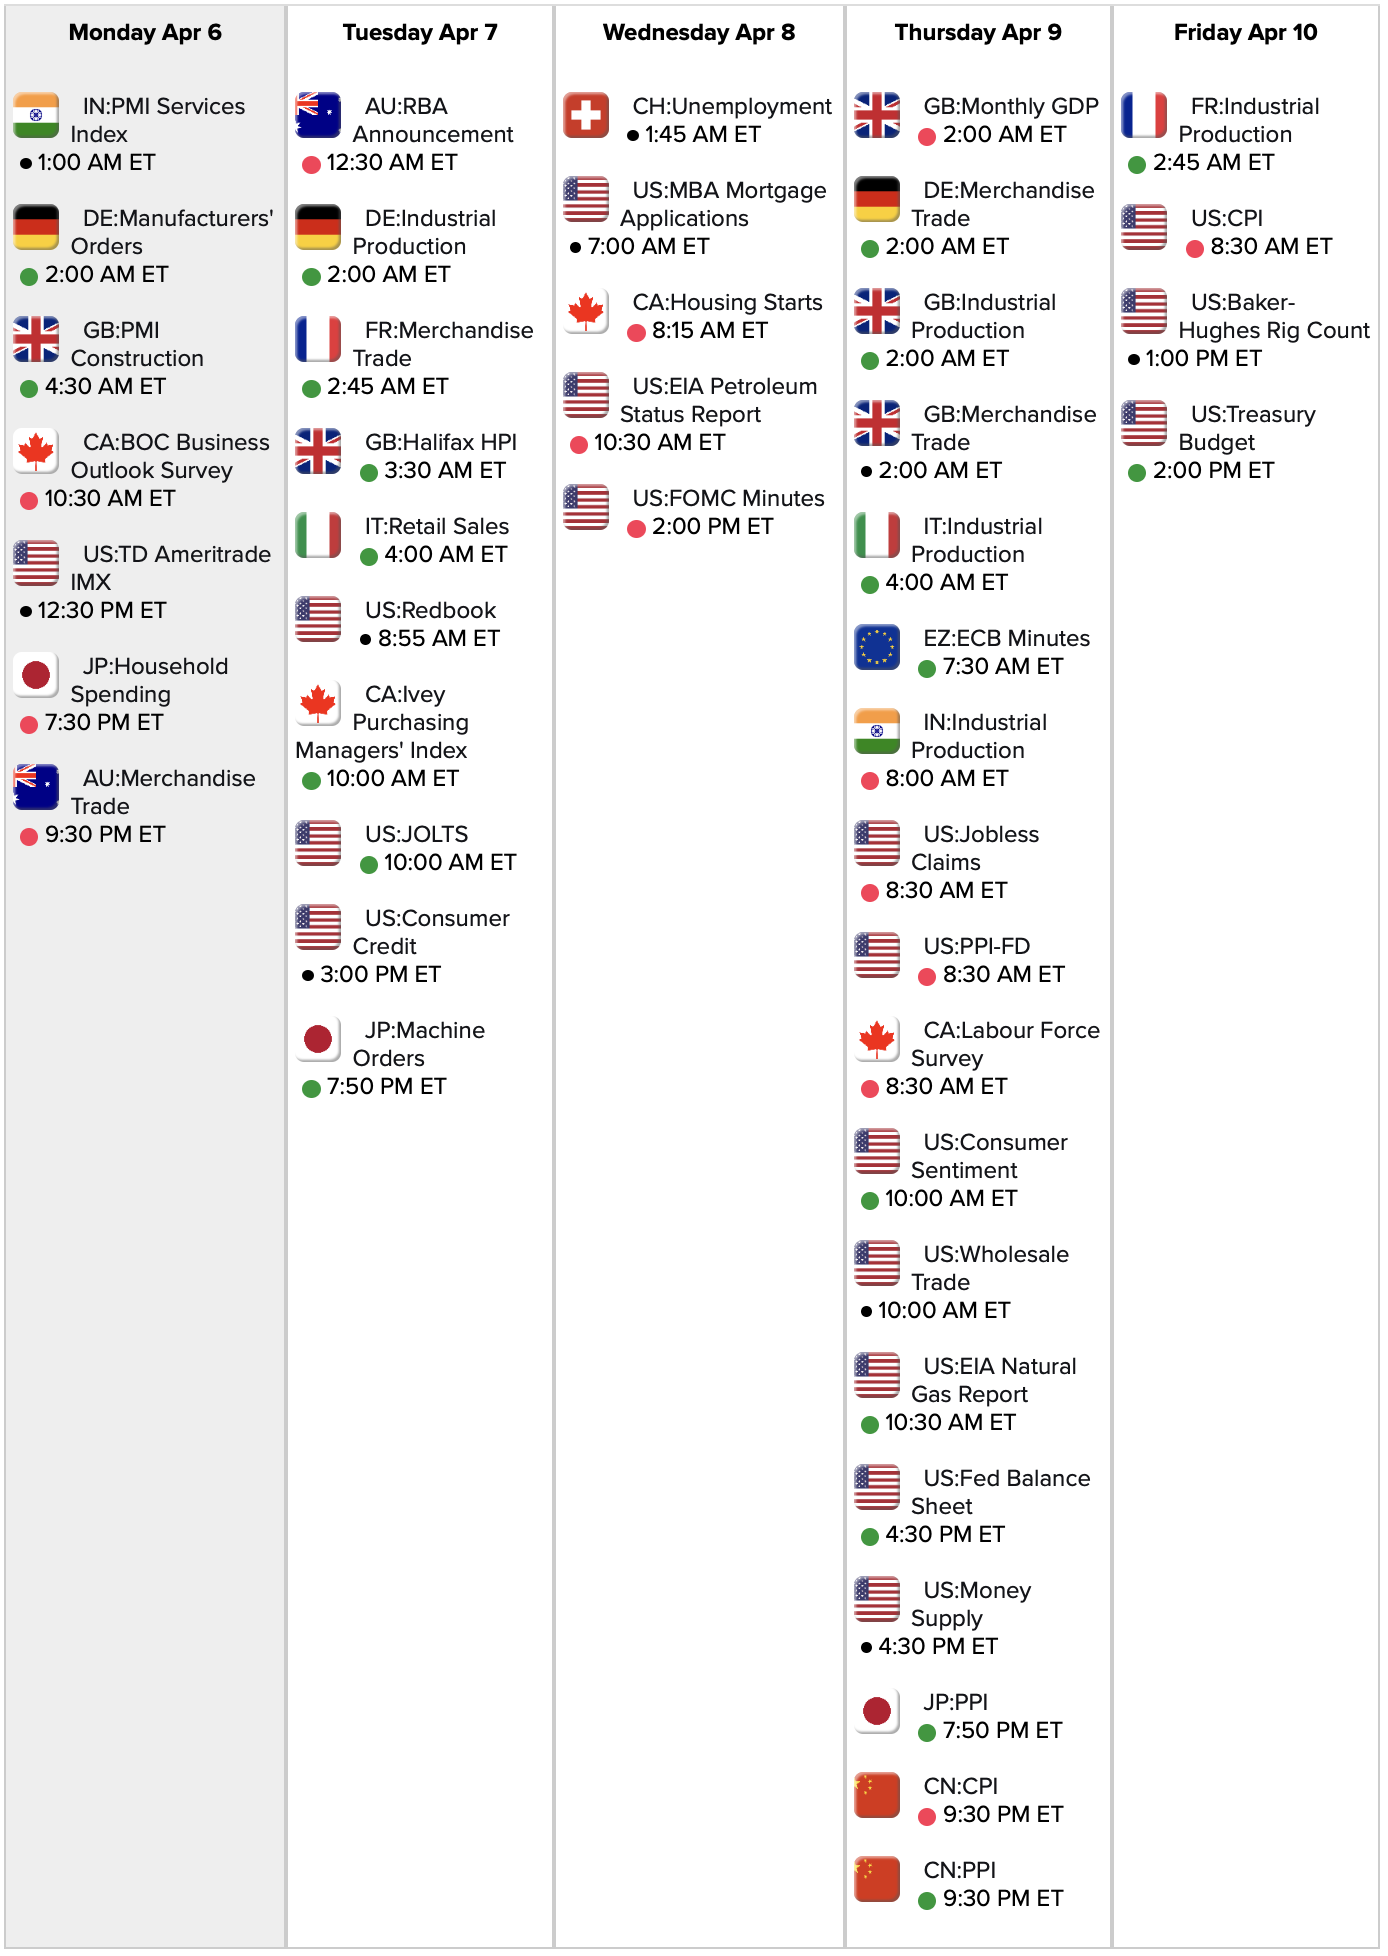
Link to calendar: https://research.investors.com/economic-calendar/
#SPX1dte Sold to Open $SPX Apr 6th 2290/2310-2605/2625 condors for 1.75, IV: 38%, SPX 2478, deltas -.05, +.07, OTM: -6.8%, +5.1%.
That’s the lowest IV I’ve sold since March 6th. Market down and so is VIX. We are getting complacent with big moves in the indices.
Expiring: Apr 3rd 2310/2330-2610/2630 condors, sold yesterday for 1.65.
#Jobs — bigger loss than expected.
First monthly loss since Sept 2010.
Loss of 701,000 non-farm payroll jobs, vs. expected 10K loss
Unemployment at 4.4%, up by 1.1%
U6 unemployment at 8.7%, up by 1.7%
Wages up 0.4%; up from +0.3% last month
Labor force participation 62.7%, down by 0.7, lowest since Aug 2018
February revised down from +273K to +214K
January revised up from +273K to +275K
#SPX1dte Sold to Open $SPX April 3rd 2310/2330-2610/2630 condors for 1.60, IV 54%, SPX 2482, deltas: -.06, +.06. Taking it early since I have to head out.
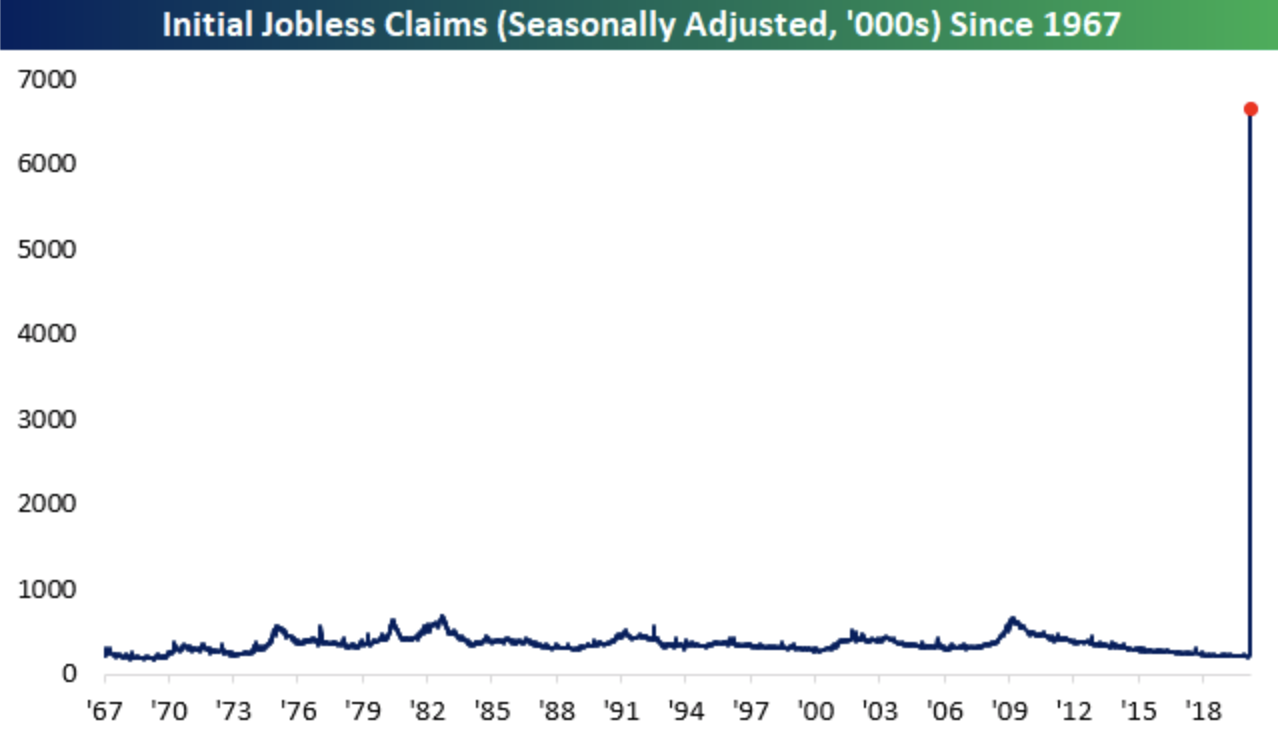
6.64 million in weekly jobless claims, doubling last week’s record.
Previous record was set in October 1982 at 695,000.
#SPX1dte Expiring: $SPX April 1st 2380/2400-2735/2755 condors, sold yesterday for 1.05.
#Earnings $WBA reports tomorrow morning. Below are details on earnings one-day moves over the last 12 quarters.
Jan. 8, 2020 BO -5.83%
Oct. 28, 2019 BO +0.68%
June 27, 2019 BO +4.08% Biggest UP
April 2, 2019 BO -12.80% Biggest DOWN
Dec. 20, 2018 BO -5.02%
Oct. 11, 2018 BO -1.94%
June 28, 2018 BO -9.90%
March 28, 2018 BO +2.47%
Jan. 4, 2018 BO -5.17%
Oct. 25, 2017 BO +3.07%
June 29, 2017 BO +1.66%
April 5, 2017 BO -1.61%
Avg (+ or -) 4.52%
Bias -2.53%, negative bias on earnings.
With stock at 44.50 the data suggests these ranges:
Based on current IV (expected move into Friday per TOS): 40.21 to 48.79
Based on AVERAGE one-day move over last 12 quarters: 42.49 to 46.51
Based on MAXIMUM one-day move over last 12 Q’s (12.8%): 38.80 to 50.20
Based on UP max only (+4.1%): 46.32
Open to requests for other symbols.
#SPX1dte Sold $SPX Apr 1st 2380/2400-2735/2755 condors for 1.05, IV 54%, SPX 2581, deltas -.06, +.03.
I forgot about the quarterly expiration… could have done a trade yesterday!
#SPX1dte Expiring: $SPX March 27th 2380/2400-2760/2780 condors, sold yesterday for 1.80.
I tried a couple different SPX1dte orders for Monday but didn’t get filled and didn’t want to chase for reduced premium. IV on the Monday expiration was only 49% at the close, which is much lower than what we’ve been seeing in this correction.
#LongLEAPs BTO $TQQQ Jan 2021 85 calls for 1.90, adding to the 90-strike calls previously purchased.
#Jobs report on Friday… should be a doozy!
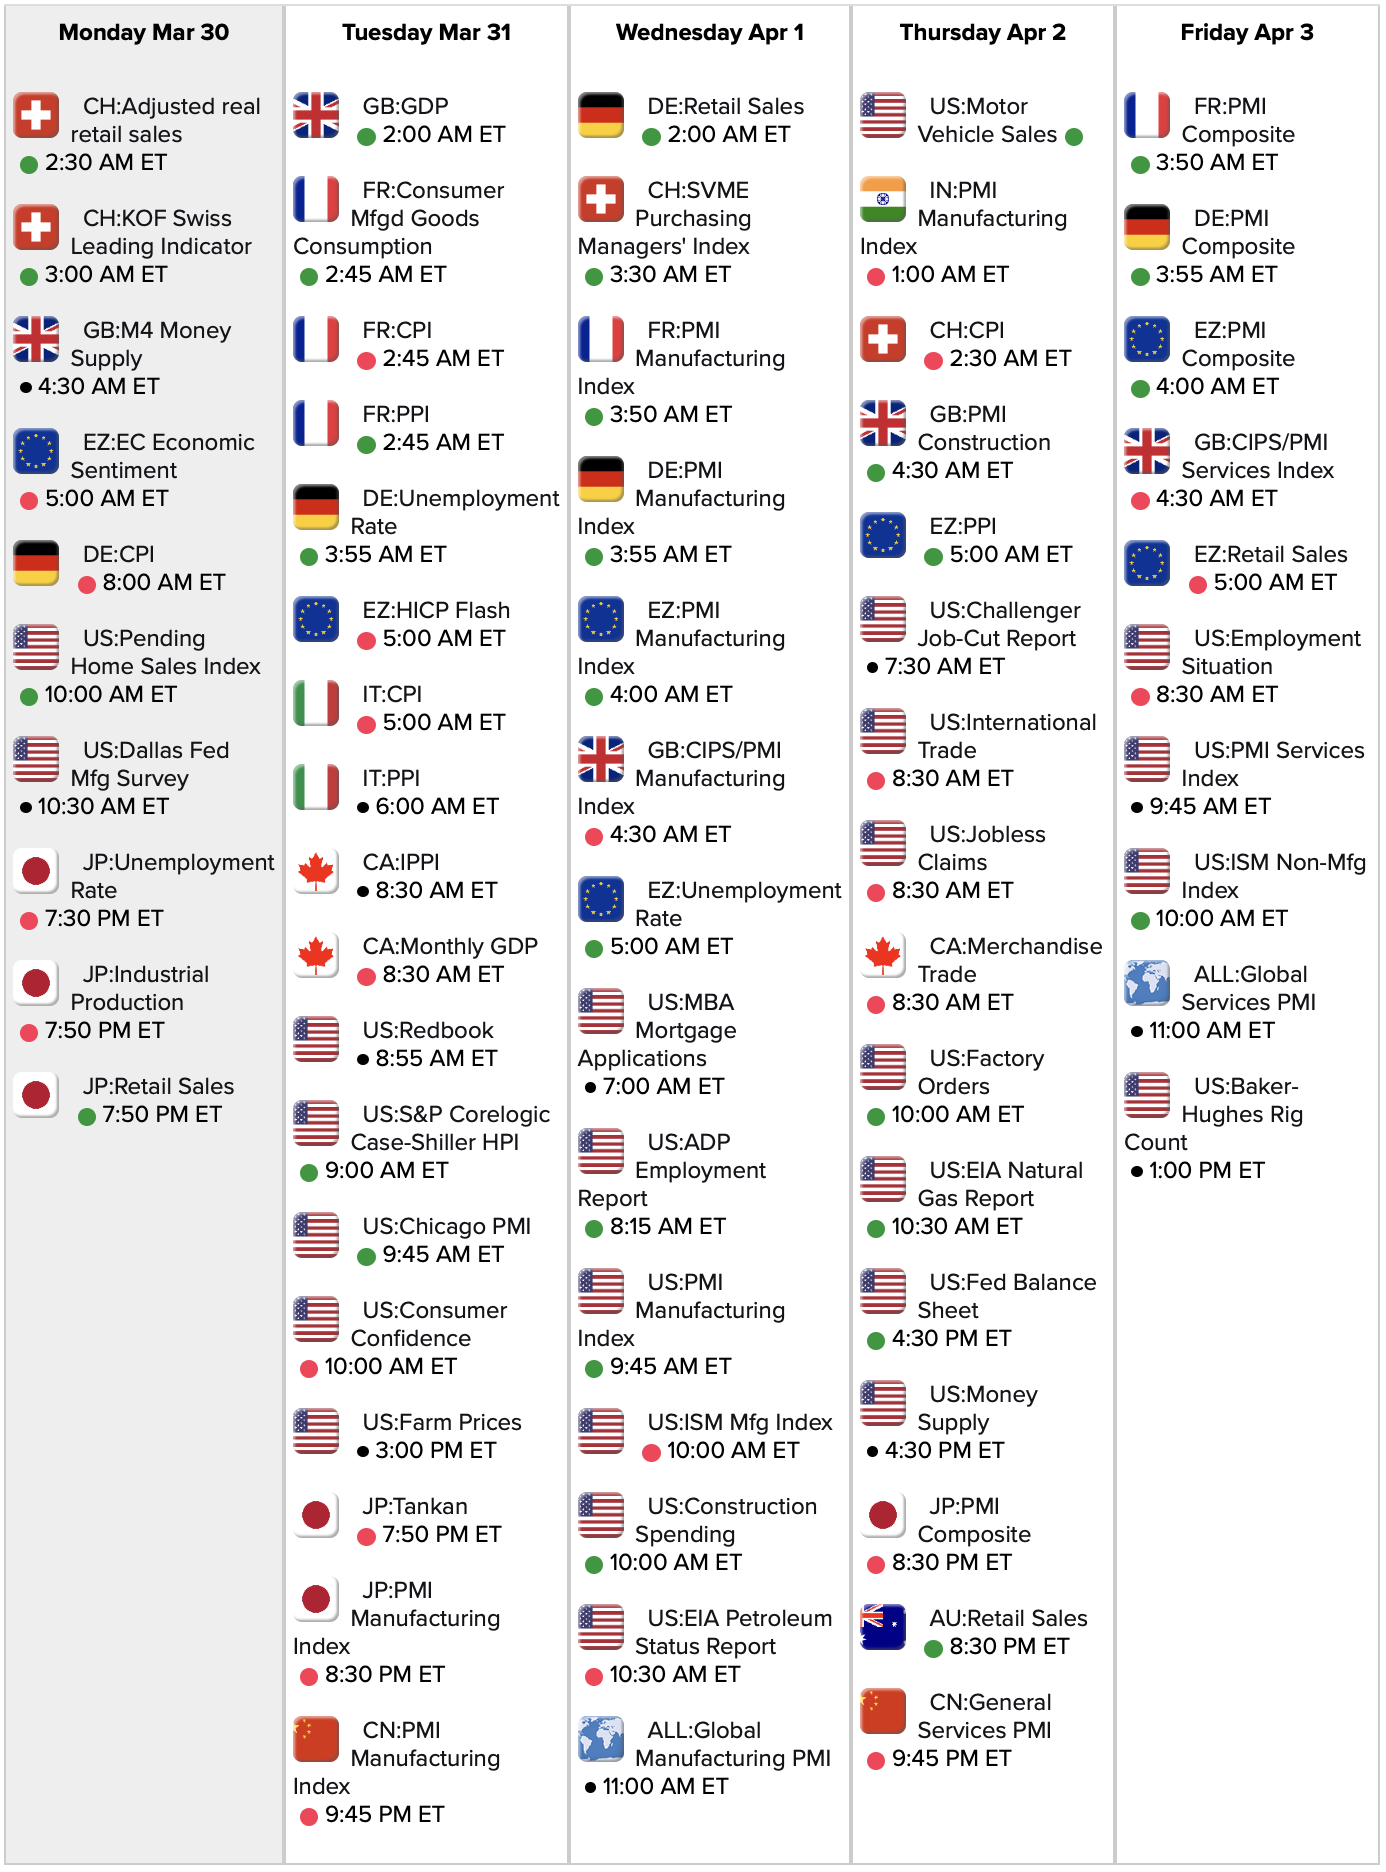
Link to calendar: https://research.investors.com/economic-calendar/
#VXXgame BTO $SVXY Jan 2021 35 calls for 3.90, adding to position started yesterday.
Not that it’s too significant, but this morning gave us the lowest $TICK reading (NYSE on TOS) on record (-1741), which goes back to March 2009. And Tuesday was the second highest on record (+1687).
#VXXGame Bought to Open $SVXY Jan 2021 35 calls for 4.65. Considering this was in the high 60’s just last month, I figure this has good chance of profiting. I will scale into more when the market retests the lows.
#SPX1dte Sold $SPX March 27th 2380/2400-2760/2780 condors for 1.80. IV: 66%, SPX 2592, deltas: -.06, +.06, OTM -7.4%, +6.5%
3.28 million in weekly jobless claims, almost FIVE times previous record
Previous record was set in October 1982 at 695,000.
#SPX1dte Expiring: $SPX March 24th 2210/2230-2655/2675 condors, sold yesterday for 1.80.
Stocks tumble into the close after Bernie Sanders threatens to put a hold on the coronavirus stimulus bill; Nasdaq turns negative and Dow up only 480 points after surging 1,300 earlier https://t.co/kumM5Z3mLD pic.twitter.com/tw7O9qsyCw
— CNBC Now (@CNBCnow) March 25, 2020
#Earnings $MU reports tonight. Below are details on earnings one-day moves over the last 12 quarters.
Dec. 18, 2019 AC +2.80%
Sept. 26, 2019 AC -11.09% Biggest DOWN
June 25, 2019 AC +13.34% Biggest UP
March 20, 2019 AC +9.61%
Dec. 18, 2018 AC -7.91%
Sept. 20, 2018 AC -2.86%
June 20, 2018 AC +0.83%
March 22, 2018 AC -7.99%
Dec. 19, 2017 AC +4.02%
Sept. 26, 2017 AC +8.51%
June 29, 2017 AC -5.11%
March 23, 2017 AC +7.40%
Avg (+ or -) 6.79%
Bias 0.96%, positive bias on earnings.
With stock at 41.00 the data suggests these ranges:
Based on current IV (expected move into Friday per TOS): 35.64 to 46.36
Based on AVERAGE one-day move over last 12 quarters: 38.22 to 43.78
Based on MAXIMUM one-day move over last 12 Q’s (13.3%): 35.53 to 46.47
Based on DOWN max only (-11.1%): 36.45
Open to requests for other symbols.
#SPX1dte Sold to open $SPX March 25th 2210/2230-2655/2675 condors for 1.80. IV: 79.84%, SPX 2440, deltas -.06, +.06. OTM: -8.6%, +8.8%.
#SPX1dte Expiring: 1975/2000-2550/2575 condors, sold Friday for 2.25.
#SPX1dte I didn’t sell a Monday condor because I’ve been bitten twice recently. I also maintain that we still have farther to go down.
Expired this morning: $SPX March 19th 2125/2150-2575/2600 (monthlys) condors, sold for 2.20 Thursday morning.
Expired at the close: $SPX March 20th 2170/2190-2635/2655 condors, sold Thursday afternoon for 1.85.
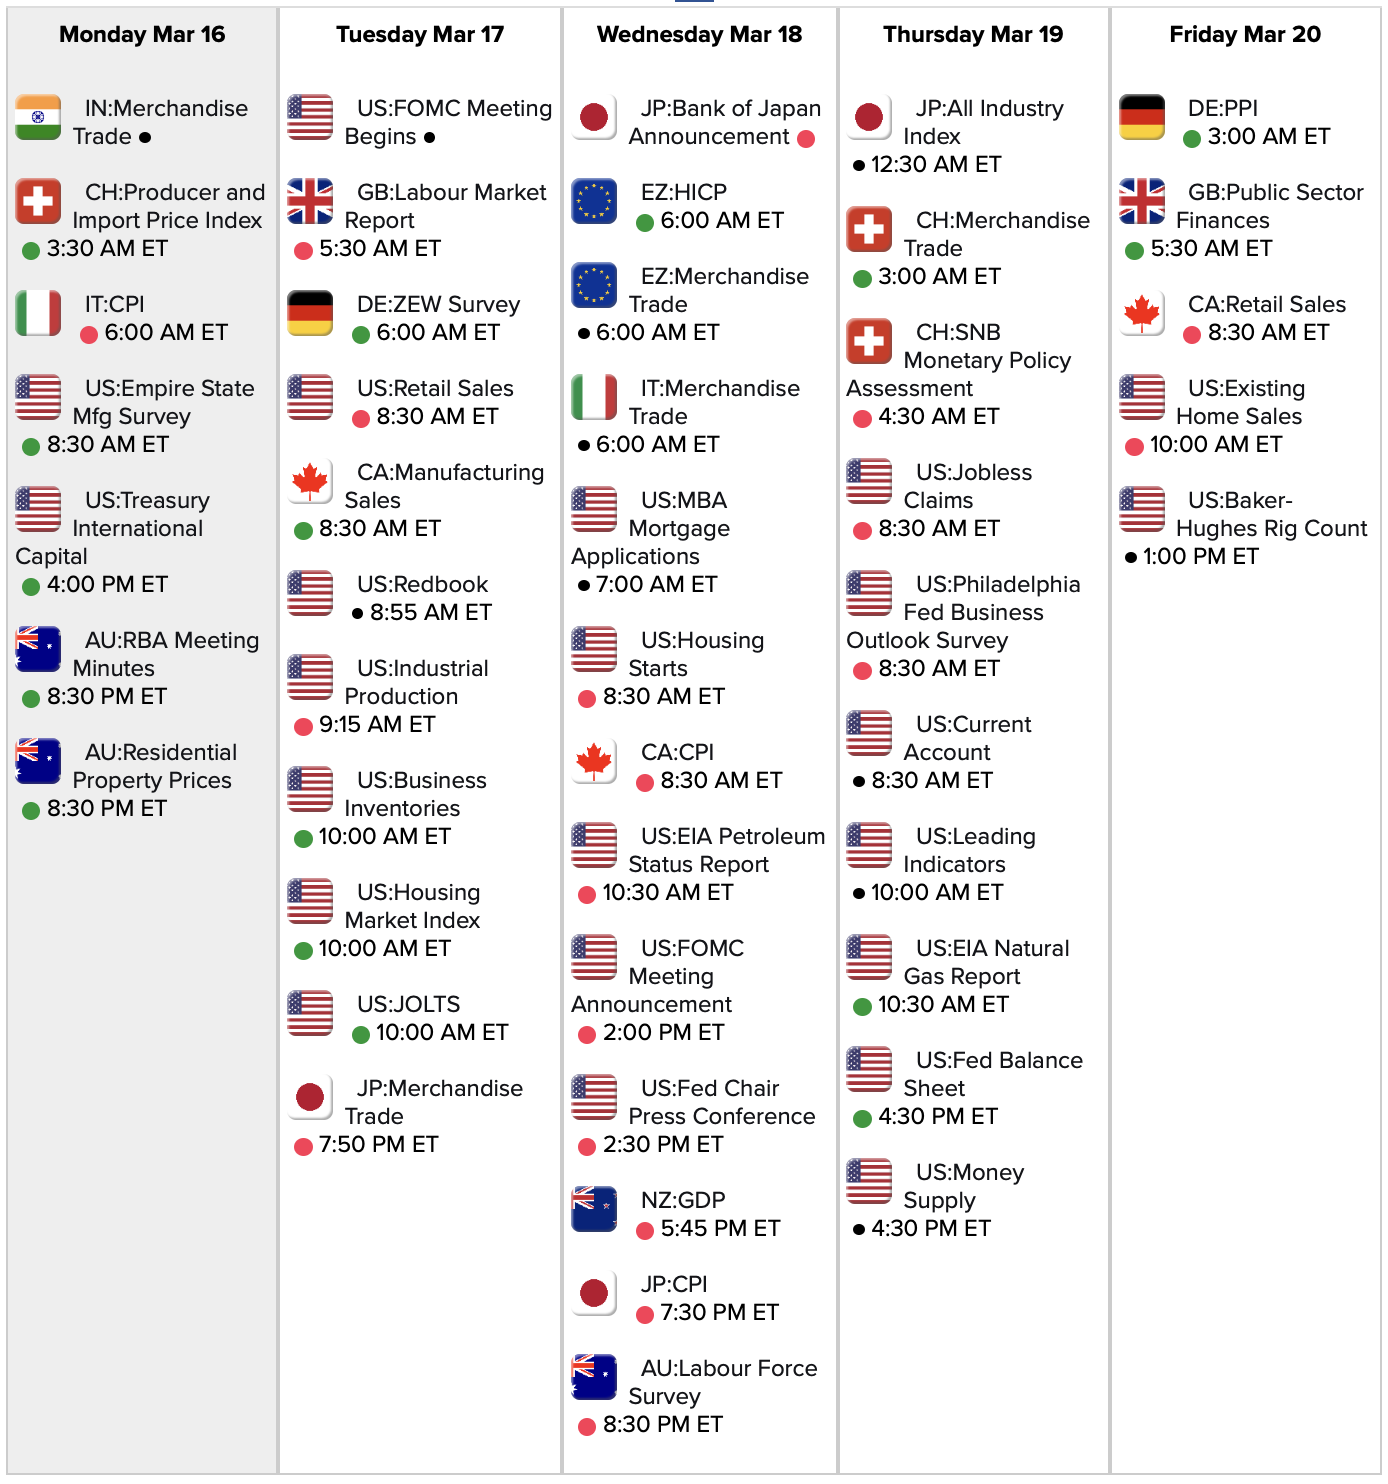
Link to calendar: https://research.investors.com/economic-calendar/
Showbiz shutdown / Top 5 “Coming Soon” picks / Streaming picks: “Spenser Confidential” & “Hunters” / Corrections / New Music picks – young new artists / Old Music pick – INXS / Guess these songs – random number generation // Find more details and playlists at http://thepickcast.com
#SPX1dte Sold $SPX 2170/2190-2635/2655 condors for 1.85. IV: 84.2%, SPX 2406, deltas: -.07, +.06. OTM: -9.0% and +9.5%.
Couldn’t have picked a better outcome for my monthly condor put on this morning… placed the trade when we were flat on the day ended as close to flat as we can expect in this market. So I’m leaving the trade to settle in the morning as I do not fear +9% gaps.
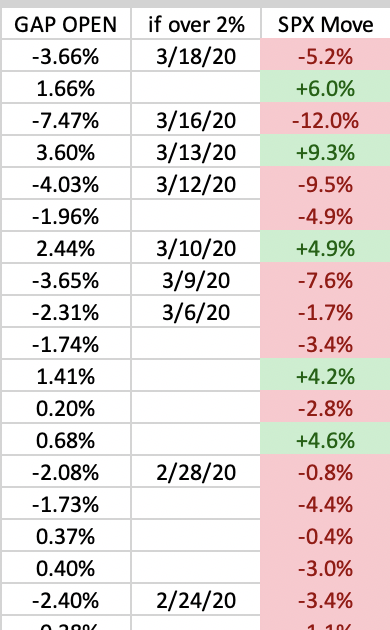
As a follow up to my first post from 2/25 (linked here: https://wp.me/p6Nxuc-i5m), gap opens over 2% have continued to happen frequently after their nearly 6-year absence. Here are the ones we have had thus far.
From Left to right: Gap Open each day / Date (if over 2%) / SPX move at the close
#SPX1dte Sold to Open $SPX March 19th 2125/2150-2575/2600 condors for 2.20. These are MONTHLY contracts that stop trading tonight, but settle at the open tomorrow. I will need to decide at the close today whether to close or allow to expire in the morning, risking a gap open that could breach my strikes. Because of the funky expiration on these, I have avoided them for this strategy, but with SPX flat at the moment and juicy premium available, it’s worth the risk this time.
IV: 109.60%, SPX: 2400, deltas: -.06, +.06. OTM: -10.4%, +7.3%
1. The Dow took 103 years to reach 10,000. It has just dropped 10,000 in less than 30 days.
2. The VIX has put in a higher intraday high 5 days in a row, despite two of those days being strong UP days for the market.
#SPX1dte Expiring: $SPX March 18th 2220/2240-2740/2760 condors, sold yesterday for 1.95.
Crazy times. I don’t really see why this should end, however. The entire world is coming to a halt. Some businesses are closing entirely, unable to weather even a month being closed. Layoffs are piling up. Our country will rack up another $2T in debt probably before the end of this month. This is an unprecedented event… I feel the indexes could easily be cut in half, meaning 1500 by the time we get to May or June. But this is only my personal speculation… I just base it on what I think SHOULD happen when most of the world is shut down.
The VIX is up today but not as dramatically as VXX and UVXY. Futures backwardation is quite dramatic.
This market is relentless. Welcome to the first Bear Market since 2009!
BTC $UVXY March 27th 50/60-130/140 condors for 3.825. Sold yesterday for 3.65.
I’m not sure how I got this to be only a small loss when UVXY has risen over 30% since when I sold it yesterday. But we could hit 130 today so I no longer like this trade. Lucky that I was able to exit so easily but the difference between the two call strikes was only 3.13, while the put side deflated from yesterday dramatically.
The Dow has moved up or down over 4% for seven days straight, beating the previous record of six days that occurred in November 1929.
#SPX1dte Sold $SPX Mar 18th 2220/2240-2740/2760 condors for 1.95, IV: 94%, SPX 2523, deltas -.05, +.07. OTM: -11.2%, +7.8%.
#VXXgame Sold $UVXY March 27th 50/60-130/140 condors for 3.65.
Highest VIX close since 1987.
Largest move down in SPX since 1987 (on percentage basis).
Largest point move in SPX ever.
#LongLEAPs Started again: BTO $TQQQ Jan 2021 90 calls for 2.50. Filled instantly.
#VXXGame. Since most of my options are expiring this Friday, I’m closing the whole batch of shorts AND longs. All shorts are now closed, and half the longs. I am riding the rest higher as long as it keeps going up.
#SPX1dte Bought to close $SPX March 16th 2380/2400-2930/2950 condors for 6.00. Sold Friday for 1.60.
Slap my hand for selling on a Friday again. Honestly, the last minute surge on Friday sucked me in. I was quite certain we would open down today, but I felt -11%+ OTM would be safe. It may still be safe, but since it almost touched my short strike, stopping is the prudent choice.
Anyone else?
#SPX1dte Sold to Open $SPX Mar 16th 2380/2400-2930/2950 condors for 1.60. IV: 67%, SPX (close) 2710, deltas: -.06, +.04. OTM: -11.4% and +8.1%.
Expiring: March 13th 2175/2200-2750/2775 condors, sold yesterday for 2.50.
#LongLEAPs Sold to close $TQQQ Jan 2021 90 calls for 4.00. Bought yesterday for 3.65 (avg price). I believe I will get a better entry.
#FOMC meeting and Press conference on Wednesday
Link to calendar: https://research.investors.com/economic-calendar/
#VXXgame Bought to close $UVXY short stock for 64.00. Assigned via 15 calls on Tuesday.
On this UP day I’m making moves to get shorter on the market. I do not believe anything’s going to get better before it gets worse.
The VIX closed higher 3 times in Oct/Nov 2008 (highest close 80.86)
It closed higher 7 times in Oct/Nov 1987 (highest close 150.19)
#SPX1dte Sold to Open $SPX March 13th 2175/2200-2750/2775 condors for 2.50. IV: 101.18%, SPX 2544, deltas -.05, +.07. (has shifted back to 06/06 since it filled). Width: 550.
Today’s drop in SPX was about 8%. These strikes are -13.0% and +8.3% OTM, and I got the highest premium I’ve ever gotten.
The $DRIP March 20th 980 strike is going for 150.00. It expires in 6 trading days. Should I buy it or sell it?
#LongLEAPs Bought to open $TQQQ Jan 2021 90 calls for 4.00. Will add as price drops.
BREAKING: NY FED SAYS TO CONDUCT PURCHASES ACROSS RANGE OF MATURITIES
— Jonathan Ferro (@FerroTV) March 12, 2020
Since Trump spoke they have been in freefall. I am guessing shutting off travel to Europe is not so great for the market.
