
#SPX1dte Expiring: $SPX March 11th 2660/2680-3010/3030 condors, sold yesterday for for 2.10.
Author Archives: Jeff
UVXY rolling
#VXXGame. BTC $UVXY March 20th 40 short calls for 10.35. Sold for 5.50 on March 6th. Still have more longs than shorts, but I think I can roll this one up if I wait a few more days.
Also early assigned on a couple of March 20th 15 short calls; didn’t notice earlier or would have closed. Will look to close today and then resell when market goes lower, as I believe it will.
SPX 1-dte
#SPX1dte Sold to Open $SPX March 11th 2660/2680-3010/3030 condors for 2.10, IV 55.97%, SPX 2870, deltas -.06, +.06.
GUSH shot
#ContangoETFs Bought to Open $GUSH Jan 2021 20 calls for .25. This may never make it back to 20 (a reverse split is probably imminent), but a cheap long shot that I will likely add to at lower strikes and more if there is a split.
Biggest drop since 2008
This time on a percentage basis… 7.6% on SPX. For a bigger drop you need to go back to Oct 2008.
Also, highest VIX close since January 2009.
SPX closed
#SPX1dte BTC $SPX Mar 9th 2780/2860 put spreads for 7.20. Condors sold for 1.60 on Friday. Two Mondays ago I let it ride and ended up with a full loss. This week, I got out at a fat loss and I’m guessing it will expire worthless. Such a bad day!
DRIP dropping
150 point swing so far
UVXY
Sold $UVXY March 20th 35 calls for 17.50. Bought for .31 on Jan 27th.
Some of these are my bright spots today. I have more longs than shorts so I can take profits on some of these. The rest is pretty ugly, mainly due to that stupid DRIP call I sold on Friday.
It’s not about trading, but…
I wanted to let you all know that I have started a podcast with friend. We cover music, movies, TV and other pop culture topics. I am going to be posting each episode on this blog, as I have it set up to feed directly to iTunes, Spotify, etc. Listeners from those sites will NOT be seeing Options Bistro, however. The Posts are only the mechanism to transmit to the platforms.
You can get more info and see all episodes and updates at my other website, thepickcast.com. I welcome your feedback or comments on that site or on the Posts I make on this site!
SPX 1-dte
#SPX1dte Sold to Open $SPX March 9th 2760/2780-3100/3120 condors for 1.60. IV: 35.09%, SPX 2972, deltas: -.07, +.06. Filled about 30 seconds after the bell.
Expiring: March 6th 2840/2860-3140/3160 condors, sold yesterday for 1.80.
VIX breakout
Going to new heights, folks.
Econ Calendar for week of 3/9/20
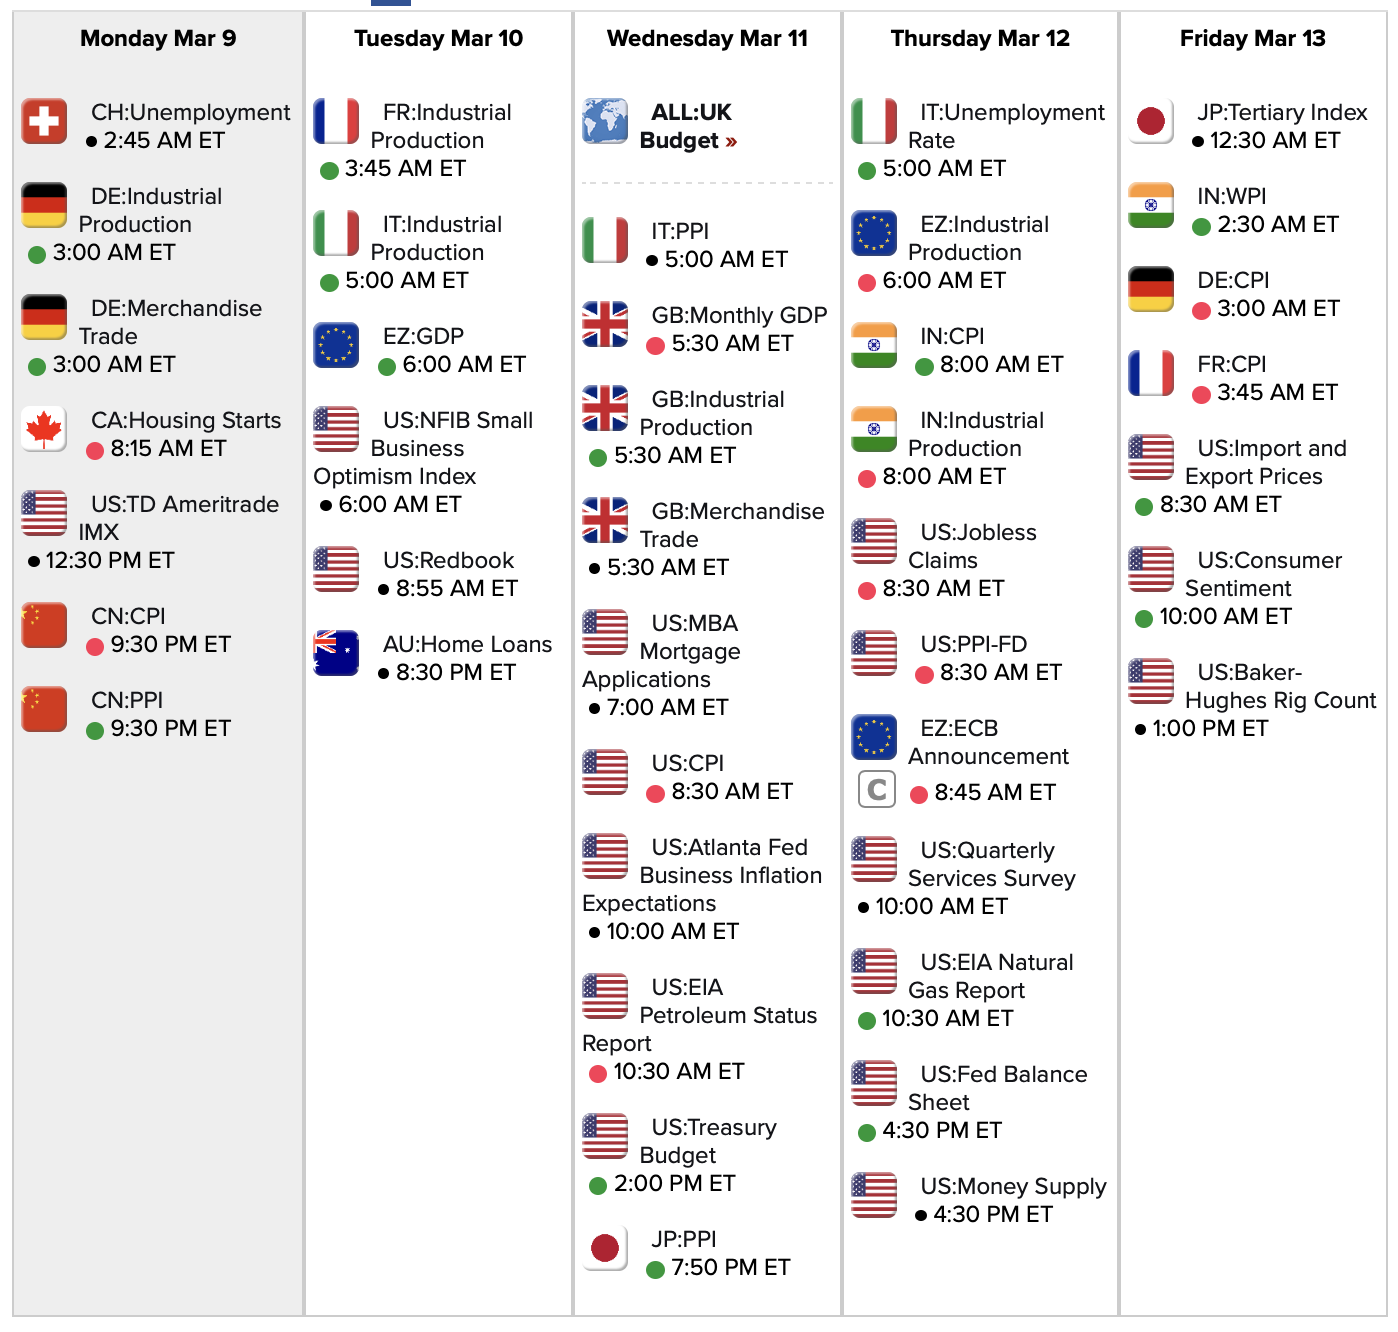

Link to calendar: https://research.investors.com/economic-calendar/
UVXY longs
#VXXgame My first purchase of puts: Bought to open $UVXY April 17th 20 puts for 1.39. I screwed up on my order, this can be gotten for less.
UVXY adding
#VXXgame Sold to Open $UVXY March 20th 40 calls for 5.50. Against a higher number of March 25 and 35 longs.
DRIP again
#ContangoETFs This was just too much to resist. I need to get back the losses I took by exiting last week.
Sold $DRIP March 20th 335 calls for 27.00.
February Jobs Report
#Jobs — beating expectations again
+273,000 non-farm payroll jobs, vs. 175K expected
Unemployment at 3.5%, down by 0.1%
U6 unemployment at 7.0%, up by 0.1%
Wages up 0.3%; +3.0% year over year
Labor force participation 63.4%, unchanged
January revised up from 225K to 273K
December revised up from 147K to 184K
Tale of two corrections
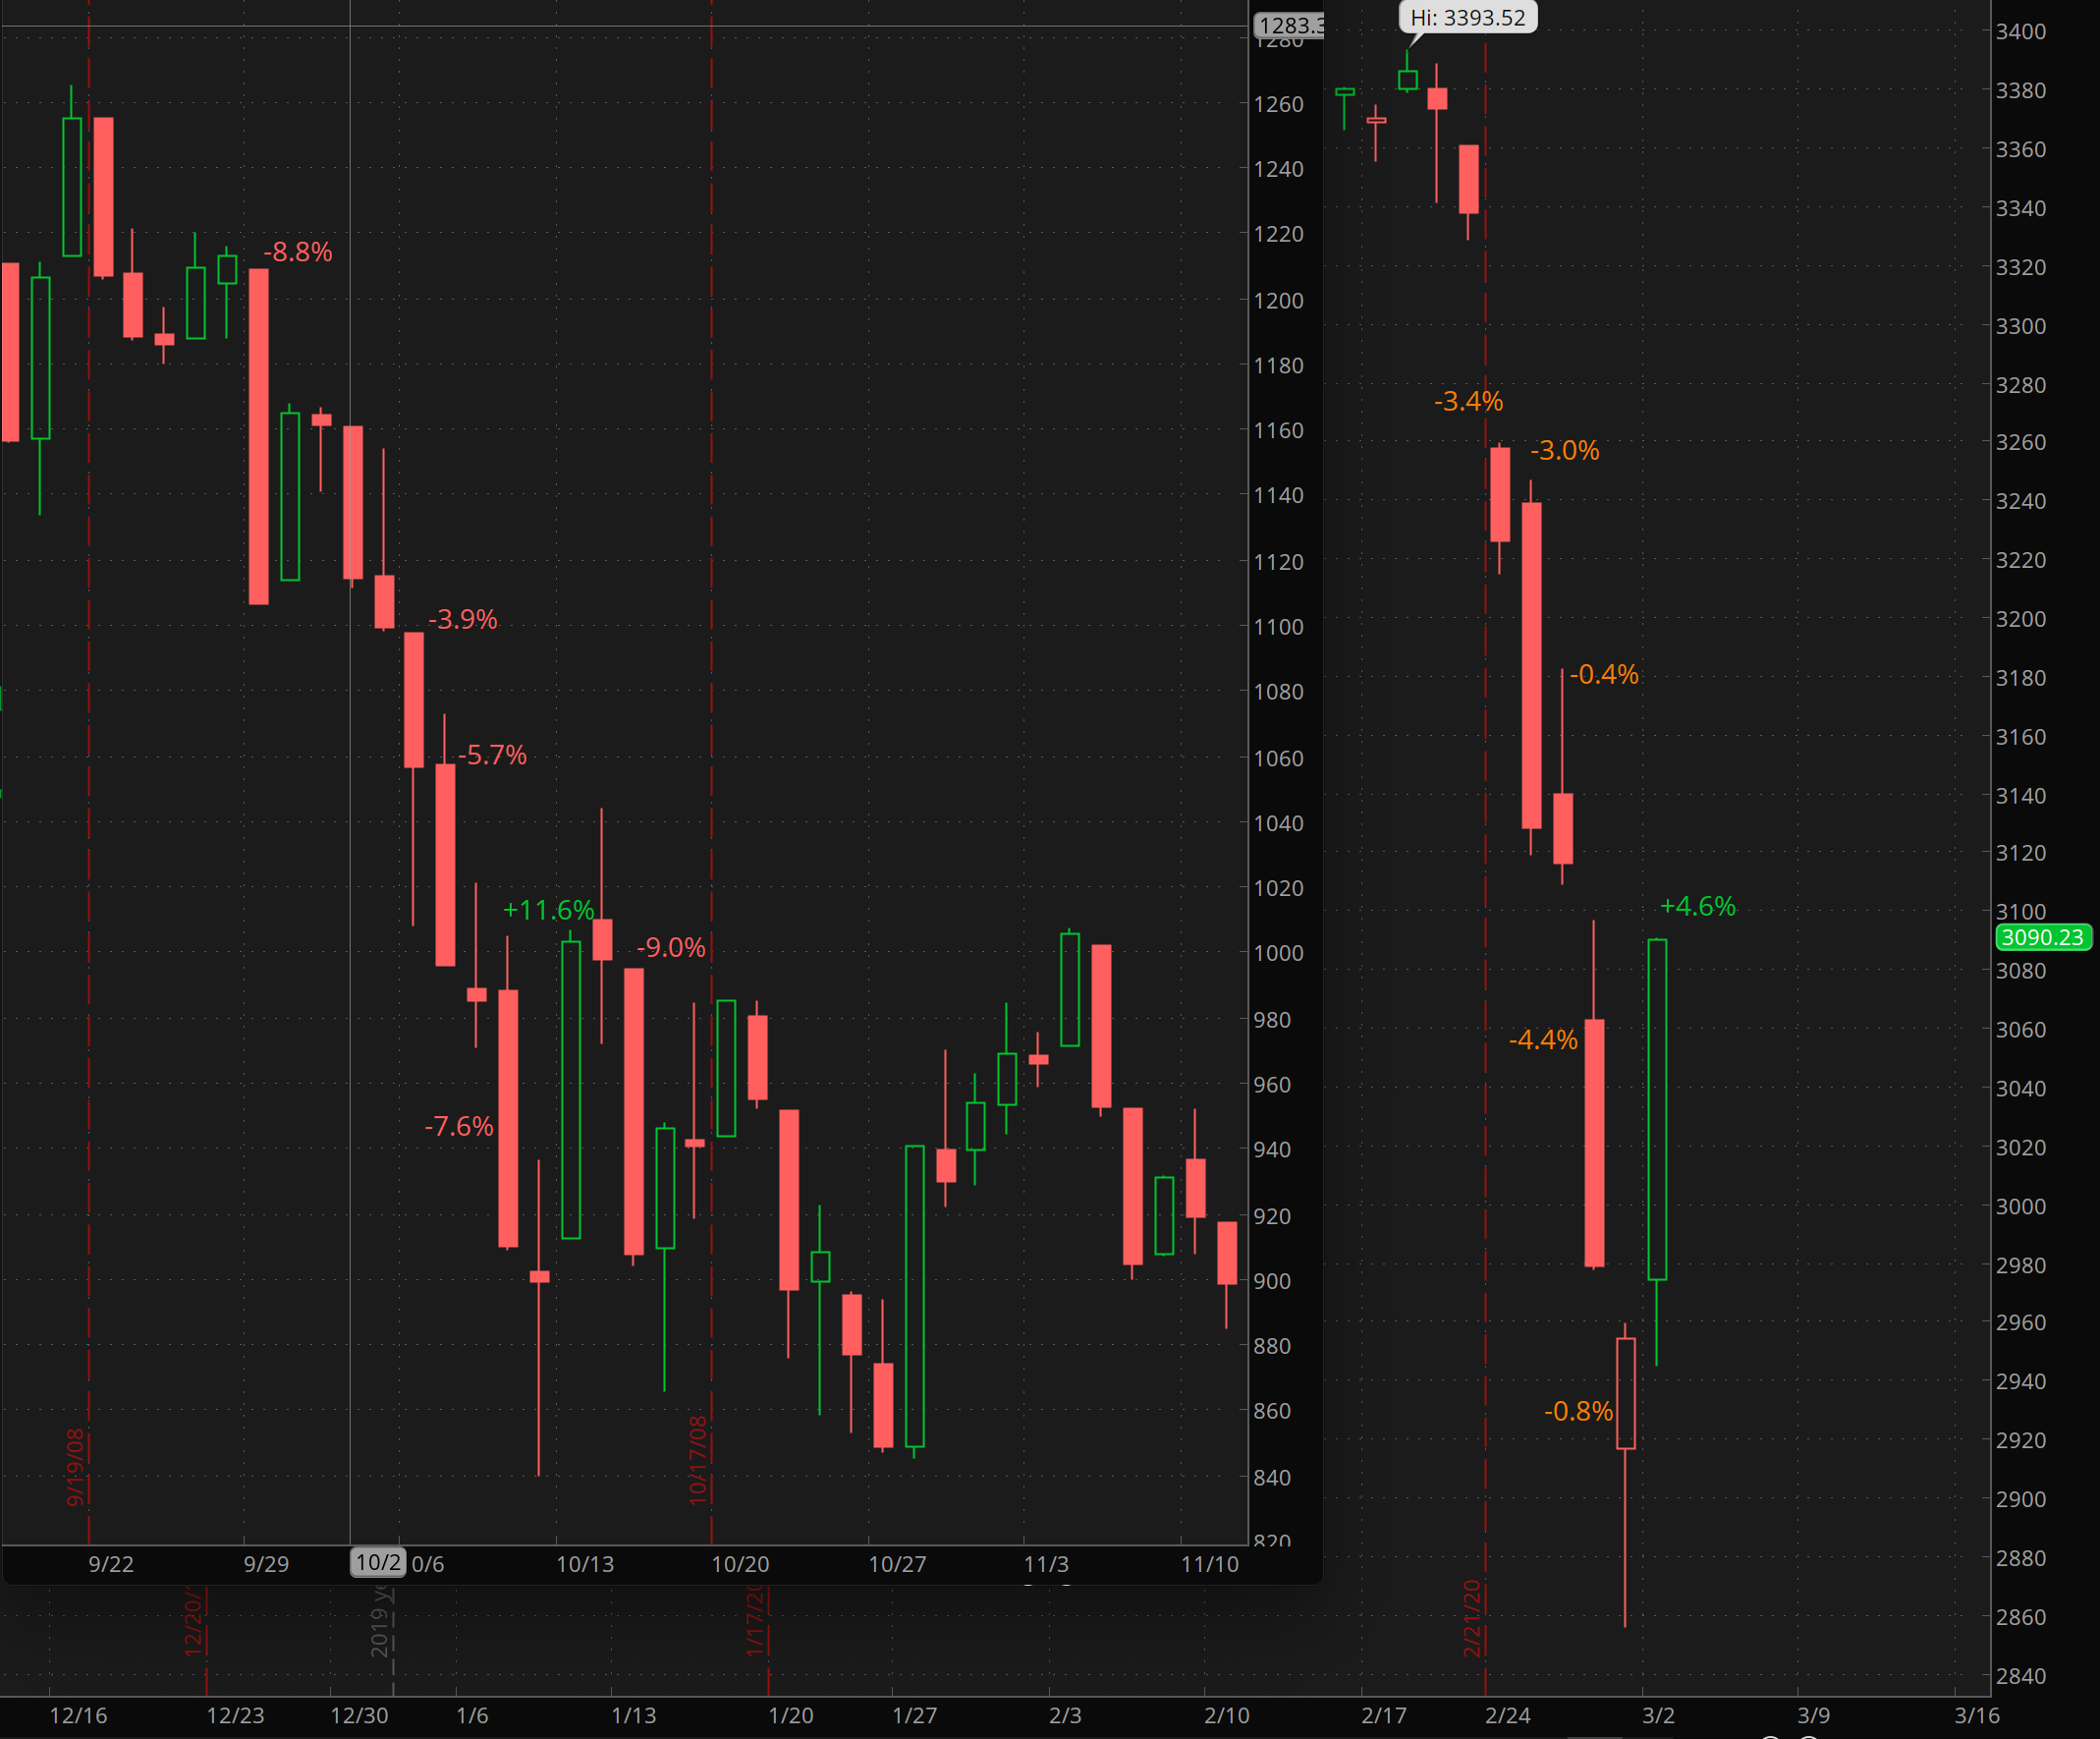
Following up from my Monday post comparing this correction to 2008’s… we are now looking more similar to the August 2011 correction.
Below, Aug 2011 is on the left, 2020 on the right. At the lows of Aug 2011, we had a week of extreme ups and downs like we have just experienced. In 2011, we then experienced a wide consolidation pattern into early October, when we finally went a bit lower and found the bottom. An extreme rally followed that.

SPX 1-dte
#SPX1dte Sold to Open $SPX March 6th 2840/2860-3140/3160 for 1.80. IV 43.65%, SPX 3020, deltas -.06, +.06
VXX adding
#VXXGame Sold to Open $VXX March 20th 29 calls for 1.95. Offset against March 25 and 27 long calls. First ones I have sold ABOVE my longs, which were bought for .30 and .26 respectively.
COST earnings analysis
#Earnings $COST reports tonight. Below are details on earnings one-day moves over the last 12 quarters.
Dec. 12, 2019 AC -1.83%
Oct. 3, 2019 AC +0.92%
May 30, 2019 AC -0.81%
March 7, 2019 AC +5.08% Biggest UP
Dec. 13, 2018 AC -8.58% Biggest DOWN
Oct. 4, 2018 AC -5.55%
May 31, 2018 AC -0.55%
March 7, 2018 AC -0.89%
Dec. 14, 2017 AC +3.32%
Oct. 5, 2017 AC -5.97%
May 25, 2017 AC +1.79%
March 2, 2017 AC -4.33%
Avg (+ or -) 3.30%
Bias -1.45%, negative bias on earnings.
With stock at 317.50 the data suggests these ranges:
Based on current IV (expected move into Friday per TOS): 303.56 to 331.44
Based on AVERAGE one-day move over last 12 quarters: 307.02 to 327.98
Based on MAXIMUM one-day move over last 12 Q’s (8.6%): 290.26 to 344.74
Based on UP max only (+5.1%): 333.63
Open to requests for other symbols.
Good morning!
New highs for $VXX and $UVXY, even though $VIX pretty far off its highs, and indices far off their lows.
SPLK earnings analysis
#Earnings $SPLK reports tonight. Below are details on earnings one-day moves over the last 12 quarters.
Nov. 21, 2019 AC +10.76%
Aug. 21, 2019 AC -7.83% Biggest DOWN
May 23, 2019 AC -7.32%
Feb. 28, 2019 AC -0.90%
Nov. 29, 2018 AC +9.93%
Aug. 23, 2018 AC +14.81%
May 24, 2018 AC -5.20%
March 1, 2018 AC +9.26%
Nov. 16, 2017 AC +17.89% Biggest UP
Aug. 24, 2017 AC +8.47%
May 25, 2017 AC -6.97%
Feb. 23, 2017 AC -3.23%
Avg (+ or -) 8.55%
Bias 3.31%, positive bias on earnings.
With stock at 150.00 the data suggests these ranges:
Based on current IV (expected move into Friday per TOS): 135.06 to 164.94
Based on AVERAGE one-day move over last 12 quarters: 137.18 to 162.82
Based on MAXIMUM one-day move over last 12 Q’s (17.9%): 123.17 to 176.84
Based on UP max only (-7.8%): 138.26
Open to requests for other symbols.
SPX 1-dte
#SPX1dte At 12:58 Pacific Time, sold $SPX March 4th 2830/2850-3140/3160 condors for 2.05. IV: 47.73%, SPX 3000, deltas: -.07, +.05
Episode 2 – High Fidelity
High Fidelity: from page, to film, to Hulu / John Cusack Top 5 / Parasite picked / Rock’n’Roll Hall of Fame inductees / New music picks / Old music pick / New picks from an old chick — Go to https://thepickcast.com for playlists and more info.
DLTR earnings analysis
#Earnings $DLTR reports tomorrow morning. Below are details on earnings one-day moves over the last 12 quarters.
Nov. 26, 2019 BO -15.24% Biggest DOWN
Aug. 29, 2019 BO -1.93%
May 30, 2019 BO +3.13%
March 6, 2019 BO +5.11%
Nov. 29, 2018 BO +6.13% Biggest UP
Aug. 30, 2018 BO -15.54%
May 31, 2018 BO -14.28%
March 7, 2018 BO -14.47%
Nov. 21, 2017 BO +2.41%
Aug. 24, 2017 BO +5.62%
May 25, 2017 BO +0.92%
March 1, 2017 BO +0.20%
Avg (+ or -) 7.08%
Bias -3.16%, negative bias on earnings.
With stock at 83.00 the data suggests these ranges:
Based on current IV (expected move into Friday per TOS): 76.44 to 89.56
Based on AVERAGE one-day move over last 12 quarters: 77.12 to 88.88
Based on MAXIMUM one-day move over last 12 Q’s (15.5%): 70.10 to 95.90
Based on UP max only (+6.1%): 88.09
Open to requests for other symbols.
TSLA up again
Maybe some calls sales today.
Tale of two scales
Since last week has been called the worst week since 2008, I thought I would compare the charts from the two.
The first comparison is between the two weeks with the bars on each scaled to match SPX point moves (not percentage). 2008 is on the left, 2020 on the right:
The second resizes the 2020 week so that the scales match on a percentage basis. 2020 is on the left, 2008 on the right:

As you can see, the moves in 2008 were bigger on a percentage basis, while last week was bigger on a point basis.
In 2008, the first huge up day was nowhere near the bottom, which didn’t happen for another five months.
SPXpire
#SPX1dte Expiring: $SPX March 2nd 2600/2625-3100/3125 condors, sold Friday for 2.05.
TGT earnings analysis
#Earnings $TGT reports tomorrow morning. Below are details on earnings one-day moves over the last 12 quarters.
Nov. 20, 2019 BO +14.05%
Aug. 21, 2019 BO +20.42% Biggest UP
May 22, 2019 BO +7.78%
March 5, 2019 BO +4.58%
Nov. 20, 2018 BO -11.26%
Aug. 22, 2018 BO +3.20%
May 23, 2018 BO -5.69%
March 6, 2018 BO -4.45%
Nov. 15, 2017 BO -9.86%
Aug. 16, 2017 BO +3.60%
May 17, 2017 BO +0.93%
Feb. 28, 2017 BO -12.16% Biggest DOWN
Avg (+ or -) 8.17%
Bias 0.93%, positive bias on earnings.
With stock at 107.50 the data suggests these ranges:
Based on current IV (expected move into Friday per TOS): 99.01 to 115.99
Based on AVERAGE one-day move over last 12 quarters: 98.72 to 116.28
Based on MAXIMUM one-day move over last 12 Q’s (20.4%): 85.55 to 129.45
Based on DOWN max only (-12.2%): 94.43
NOTE: Five-day MAX moves are +21.00% and -13.39%
Open to requests for other symbols.
KSS earnings analysis
#Earnings $KSS reports tomorrow morning. Below are details on earnings one-day moves over the last 12 quarters.
Nov. 19, 2019 BO -19.48% Biggest DOWN
Aug. 20, 2019 BO -6.88%
May 21, 2019 BO -12.33%
March 5, 2019 BO +7.31% Biggest UP
Nov. 20, 2018 BO -9.22%
Aug. 21, 2018 BO +1.71%
May 22, 2018 BO -7.42%
March 1, 2018 BO -5.05%
Nov. 9, 2017 BO +0.93%
Aug. 10, 2017 BO -5.79%
May 11, 2017 BO -7.83%
Feb. 23, 2017 BO -2.08%
Avg (+ or -) 7.17%
Bias -5.51%, strong negative bias on earnings.
With stock at 38.00 the data suggests these ranges:
Based on current IV (expected move into Friday per TOS): 34.63 to 41.37
Based on AVERAGE one-day move over last 12 quarters: 35.28 to 40.72
Based on MAXIMUM one-day move over last 12 Q’s (19.5%): 30.60 to 45.40
Based on UP max only (+7.3%): 40.78
NOTE: Five-day MAX moves are +4.81% and -19.52%
Open to requests for other symbols.
AZO earnings analysis
#Earnings $AZO reports tomorrow morning. Below are details on earnings one-day moves over the last 12 quarters.
Dec. 10, 2019 BO +6.92% Biggest UP
Sept. 24, 2019 BO -4.41%
May 21, 2019 BO +5.56%
Feb. 26, 2019 BO +5.10%
Dec. 4, 2018 BO +6.74%
Sept. 18, 2018 BO -1.97%
May 22, 2018 BO -9.48%
Feb. 27, 2018 BO -11.06%
Dec. 5, 2017 BO +0.42%
Sept. 19, 2017 BO -5.00%
May 23, 2017 BO -11.84% Biggest DOWN
Feb. 28, 2017 BO -0.58%
Avg (+ or -) 5.76%
Bias -1.63%, negative bias on earnings.
With stock at 1030.00 the data suggests these ranges:
Based on current IV (expected move into Friday per TOS): 951.27 to 1108.73
Based on AVERAGE one-day move over last 12 quarters: 970.71 to 1089.29
Based on MAXIMUM one-day move over last 12 Q’s (11.8%): 908.05 to 1151.95
Based on UP max only (+6.9%): 1101.28
NOTE: Five-day MAX moves are +7.60% and -9.93%
Open to requests for other symbols.
SPX 1-dte
#SPX1dte Sold to Open $SPX March 2nd 2600/2625-3100/3125 condors for 2.05. IV: 50%, SPX 2827, deltas: -.05, +.07. Width: 375
That’s the best premium I have gotten in 14 months of this strategy, and the shorts were -10.3% and +5.9% OTM, when the trade filled. But 3 minutes later at the close, that shifted to -11.1% and +4.9%.
SPX 57% Vol
#SPX1dte Monday’s expiration is off-the-charts volatility. I’m going to be able to sell a condor that has short puts at 2570 or lower, or 11.4% OTM, and still get excellent premium. Pulling the trigger before the close.
SPX 1-dte closed
#SPX1dte BTC $SPX Feb 28th 2850/2830 put spreads for .60. Condors sold yesterday for 1.45.
Not sure if I’ll be selling one tonight, but if I do, I am waiting until a minute before the close, or right after the close. After yesterday’s last-minute dive, I ain’t risking it.
2% gap open again
Following up to my posts on Monday and Tuesday, the open price of $SPX this morning was -2.08%. So the second time that’s happened this week, and since 2014.
Fun stats for today
Largest Dow point-drop in history: -1,190.95 (-4.42%)
Largest S&P point-drop in history -137.63 (-4.42%) (exact same percentage as Dow)
Worst S&P day since August 2011 (percentage basis)
Fastest correction (down 10%) in entire history of stock market.
SPX 1-dte
#SPX1dte . Sold $SPX Feb 28th 2830/2850-3120/3140 condors for 1.45. IV: 41.97%, SPX 3013, deltas: -.06, .06.
Width: 270 points
VIX spread closed
Sold to close $VIX March 17th 17/20 call spread for 2.21. Bought for .52 on Jan 15th. Max possible on this is 3.00, so I’ll take this now, as the risk of going to zero is bigger than the additional .79 I might gain.
UVXY adding
#VXXGame Earlier, sold $UVXY Apr 17th 19 call for 4.65. Adding to the position. Number of shorts in VXXGame is still about one-third number of longs.
DRIPped out
Unfortunately I’m going to have to dump out of $DRIP short calls. They are my only positions going against me badly, since I have long options hedging my $UVXY and $VXX shorts.
We are poised now to see the worst week in the market since the financial crisis. Even in best case scenarios with corona virus, it’s likely to scare the markets for a few more weeks. What this will do to $XOP is uncertain. But since yesterday’s close we are going to open 4.4% lower. This means DRIP must open (x3) 13.2% higher. So a .70 drop in XOP means at least a $21.00 rise in DRIP.
Frankly, most of my accounts can’t handle it, and I need the margin to sustain and place other positions. I will try to profit from DRIP’s eventual decline, but I’ll have to wait until it’s actually underway. Fortunately, I didn’t go nuts and only have 3 calls on two accounts, and 2 calls in a third account. I kept my smallest accounts out of it completely.
Other than a couple misadventures over the years, one in $KOLD and a couple in $NUGT, the #ContangoETFs strategy provides a pretty smooth income. But these outlier moves are too damaging, so I’m going to cease the naked calls and use diagonals or spreads, like many of have switched to in #VXXGame and many of you are already doing in DRIP.
Closing NUGT, SPXpire
#ContangoETFs . I am closing $NUGT at breakeven because I think chances are it will still go higher and I don’t want to get into another $DRIP situation right now.
BTC NUGT June 47 calls for 3.75. Sold for 3.80 on Dec 24.
BTC NUGT Sep 52 calls for 4.75. Sold for 4.80 on Feb 21.
#SPX1dte Expiring: $SPX Feb 26th 2970/2990-3220/3240 condors, sold yesterday for 1.30.
SQ earnings analysis
#Earnings $SQ reports tonight. Below are details on earnings one-day moves over the last 12 quarters.
Nov. 6, 2019 AC +5.00%
Aug. 1, 2019 AC -14.05% Biggest DOWN
May 1, 2019 AC -7.98%
Feb. 27, 2019 AC +2.42%
Nov. 7, 2018 AC -9.02%
Aug. 1, 2018 AC +8.65%
May 2, 2018 AC +1.13%
Feb. 27, 2018 AC +0.30%
Nov. 8, 2017 AC +3.40%
Aug. 2, 2017 AC -4.68%
May 3, 2017 AC +8.86%
Feb. 22, 2017 AC +14.02% Biggest UP
Avg (+ or -) 6.63%
Bias 0.67%, positive bias on earnings.
With stock at 78.00 the data suggests these ranges:
Based on current IV (expected move into Friday per TOS): 71.10 to 84.90
Based on AVERAGE one-day move over last 12 quarters: 72.83 to 83.17
Based on MAXIMUM one-day move over last 12 Q’s (14.1%): 67.04 to 88.96
Based on UP max only (+14.0%): 88.94
Open to requests for other symbols.
Back to back 3%+
First time since November 2008 that SPX dropped more than 3% two days in a row.
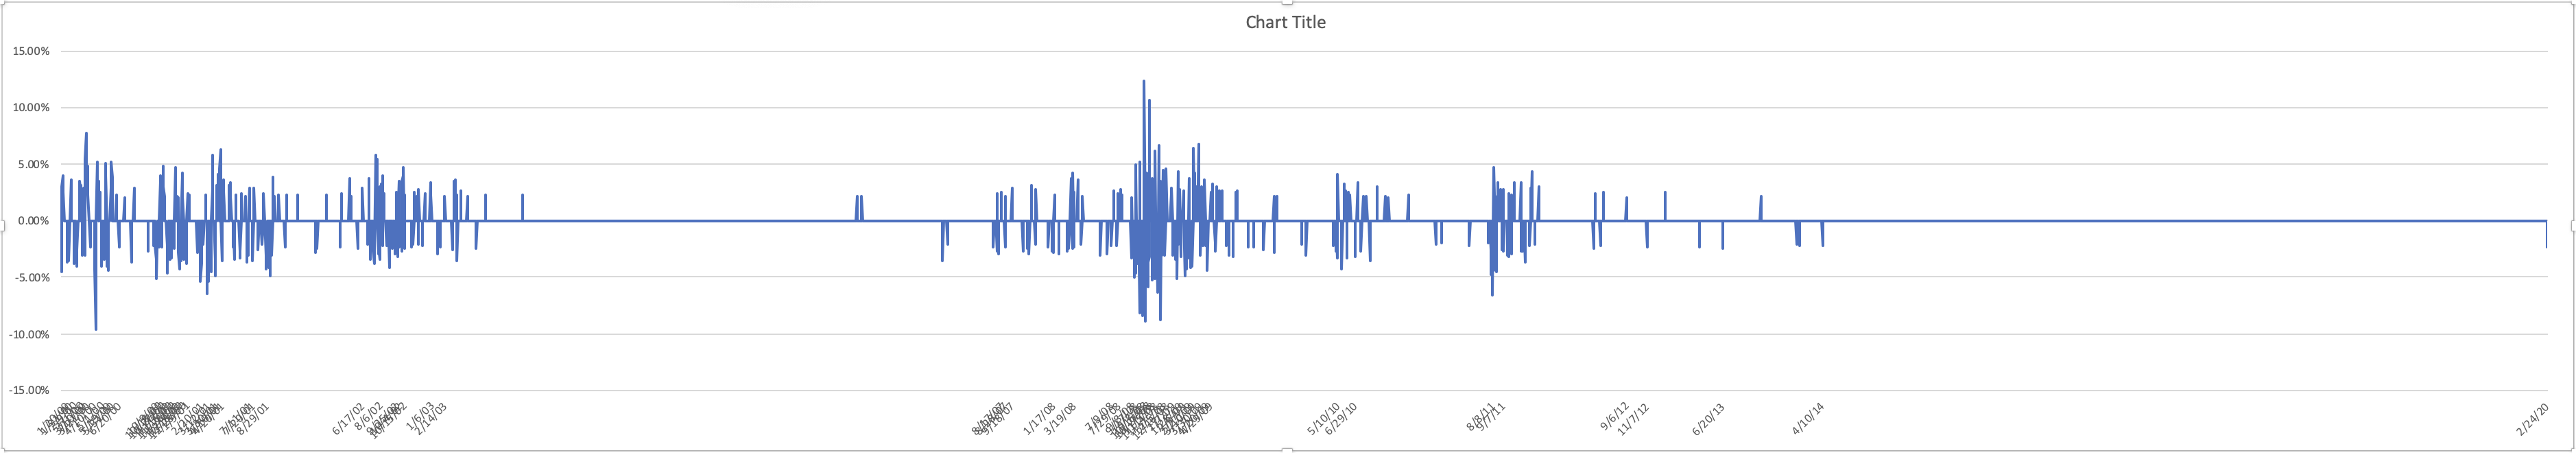
Gap Opens
Following up to my Post yesterday, here is a chart of all SPX gap opens that were plus or minus 2% or greater since 1/1/2000. Click the chart for a larger view.
On the left is 1/3/2000, and on the right is yesterday, 2/24/20. The cluster near the middle is the 2008 crash. As you can see, a very long gap between 2014 and now.
SPX 1-dte
#SPX1dte Sold $SPX Feb 26th 2970/2990-3220/3240 condors for 1.30. IV: 33.19%, SPX 3140, deltas -.06, +.07.
UVXY adding
#VXXGame Sold $UVXY April 17th 19 calls for 2.75. Keeping more longs than shorts, but they are in an earlier expiration.
DRIPping upward
#ContangoETFs Sold $DRIP March 20th 186 calls for 6.35
Largest gap open since 2014
#VIXindicator As I said below, this is the first time I’ve had an open gap breach a short strike on the #SPX1dte strategy, which I started in December 2018. Today’s SPX open price was 2.40% below Friday’s close price.
It got me thinking, how often has that happened?
Well, it used to happen fairly frequently, when the SPX price was below 2000. It happened on a fairly steady basis up into 2014.
But the last time it happened was April 10, 2014, when it opened at 1,830.65 (-2.22%). Since then, today was the ONLY day that SPX gapped 2% or more.
Needless to say a Downside Warning fired today as well.
SPX 1-dte
#SPX1dte Bad day. Full loss on 3265/3245 put side. Wipes out about 7 weeks of gains on this strategy. As I said earlier, this was the first time in my 15 months of using this strategy that the open gapped past a short strike. There were some chances to get out for $9 or $10 but I gambled that the situation from there would improve. It didn’t.
VXX gaming
#VXXGame Sold $UVXY March 20th 16 calls for 2.25 (against long 25’s and 30’s)
Sold $VXX March 20th 18 calls for 1.64 (against long 25’s and 27’s)
TSLA closed
BTC $TSLA Feb 28th 1100 #ShortCalls for 1.00. Sold for 5.00 on 2/13. Wish I would have sold for $11.00 plus that they hit last week!
SHAK earnings analysis
#Earnings $SHAK reports tonight. Below are details on earnings one-day moves over the last 12 quarters.
Nov. 4, 2019 AC -20.63% Biggest DOWN
Aug. 5, 2019 AC +18.24% Biggest UP
May 2, 2019 AC -4.30%
Feb. 25, 2019 AC +0.42%
Nov. 1, 2018 AC -13.88%
Aug. 2, 2018 AC -11.88%
May 3, 2018 AC +18.01%
Feb. 15, 2018 AC -7.71%
Nov. 1, 2017 AC -3.36%
Aug. 3, 2017 AC -5.45%
May 4, 2017 AC +9.20%
March 1, 2017 AC -2.63%
Avg (+ or -) 9.64%
Bias -2.00%, negative bias on earnings.
With stock at 74.00 the data suggests these ranges:
Based on current IV (expected move into Friday per TOS): 63.23 to 84.77
Based on AVERAGE one-day move over last 12 quarters: 66.86 to 81.14
Based on MAXIMUM one-day move over last 12 Q’s (20.6%): 58.73 to 89.27
Based on UP max only (+18.2%): 87.50
Note: FIVE-day max moves are -26.30% and +25.21%. In most cases, SHAK continued in the same direction in the days following earnings.
Open to requests for other symbols.
PANW earnings analysis
#Earnings $PANW reports tonight. Below are details on earnings one-day moves over the last 12 quarters.
Nov. 25, 2019 AC -11.95%
Sept. 4, 2019 AC +5.76%
May 29, 2019 AC -5.11%
Feb. 26, 2019 AC +8.20%
Nov. 29, 2018 AC -1.76%
Sept. 6, 2018 AC +3.28%
June 4, 2018 BO -0.52%
Feb. 26, 2018 AC +2.31%
Nov. 20, 2017 AC +4.82%
Aug. 31, 2017 AC +10.53%
May 31, 2017 AC +17.20% Biggest UP
Feb. 28, 2017 AC -24.15% Biggest DOWN
Avg (+ or -) 7.97%
Bias 0.72%, small positive bias on earnings.
With stock at 237.00 the data suggests these ranges:
Based on current IV (expected move into Friday per TOS): 219.01 to 254.99
Based on AVERAGE one-day move over last 12 quarters: 218.12 to 255.88
Based on MAXIMUM one-day move over last 12 Q’s (24.2%): 179.76 to 294.24
Based on UP max only (+17.2%): 277.76
Note: FIVE-day max moves are -23.93% and +18.49%, so not much difference.
Open to requests for other symbols.
SPX 1-dte
#SPX1dte Sold to Open $SPX Feb 24th 3245/3265-3375/3395 condors for 1.40. IV: 11.58%, SPX 3331, deltas -.07, +.07
Expiring: Feb 21st 3295/3315-33405/3425 condors, sold yesterday for .80
OLED closed
#Earnings Bought to close $OLED Feb 21st 170/165 put spreads for .55. Sold yesterday fr 1.75.
Bad TICK
Today we hit the lowest NTSE $TICK reading since last August. Maybe correction time?
Econ Calendar for week of 2/24/20
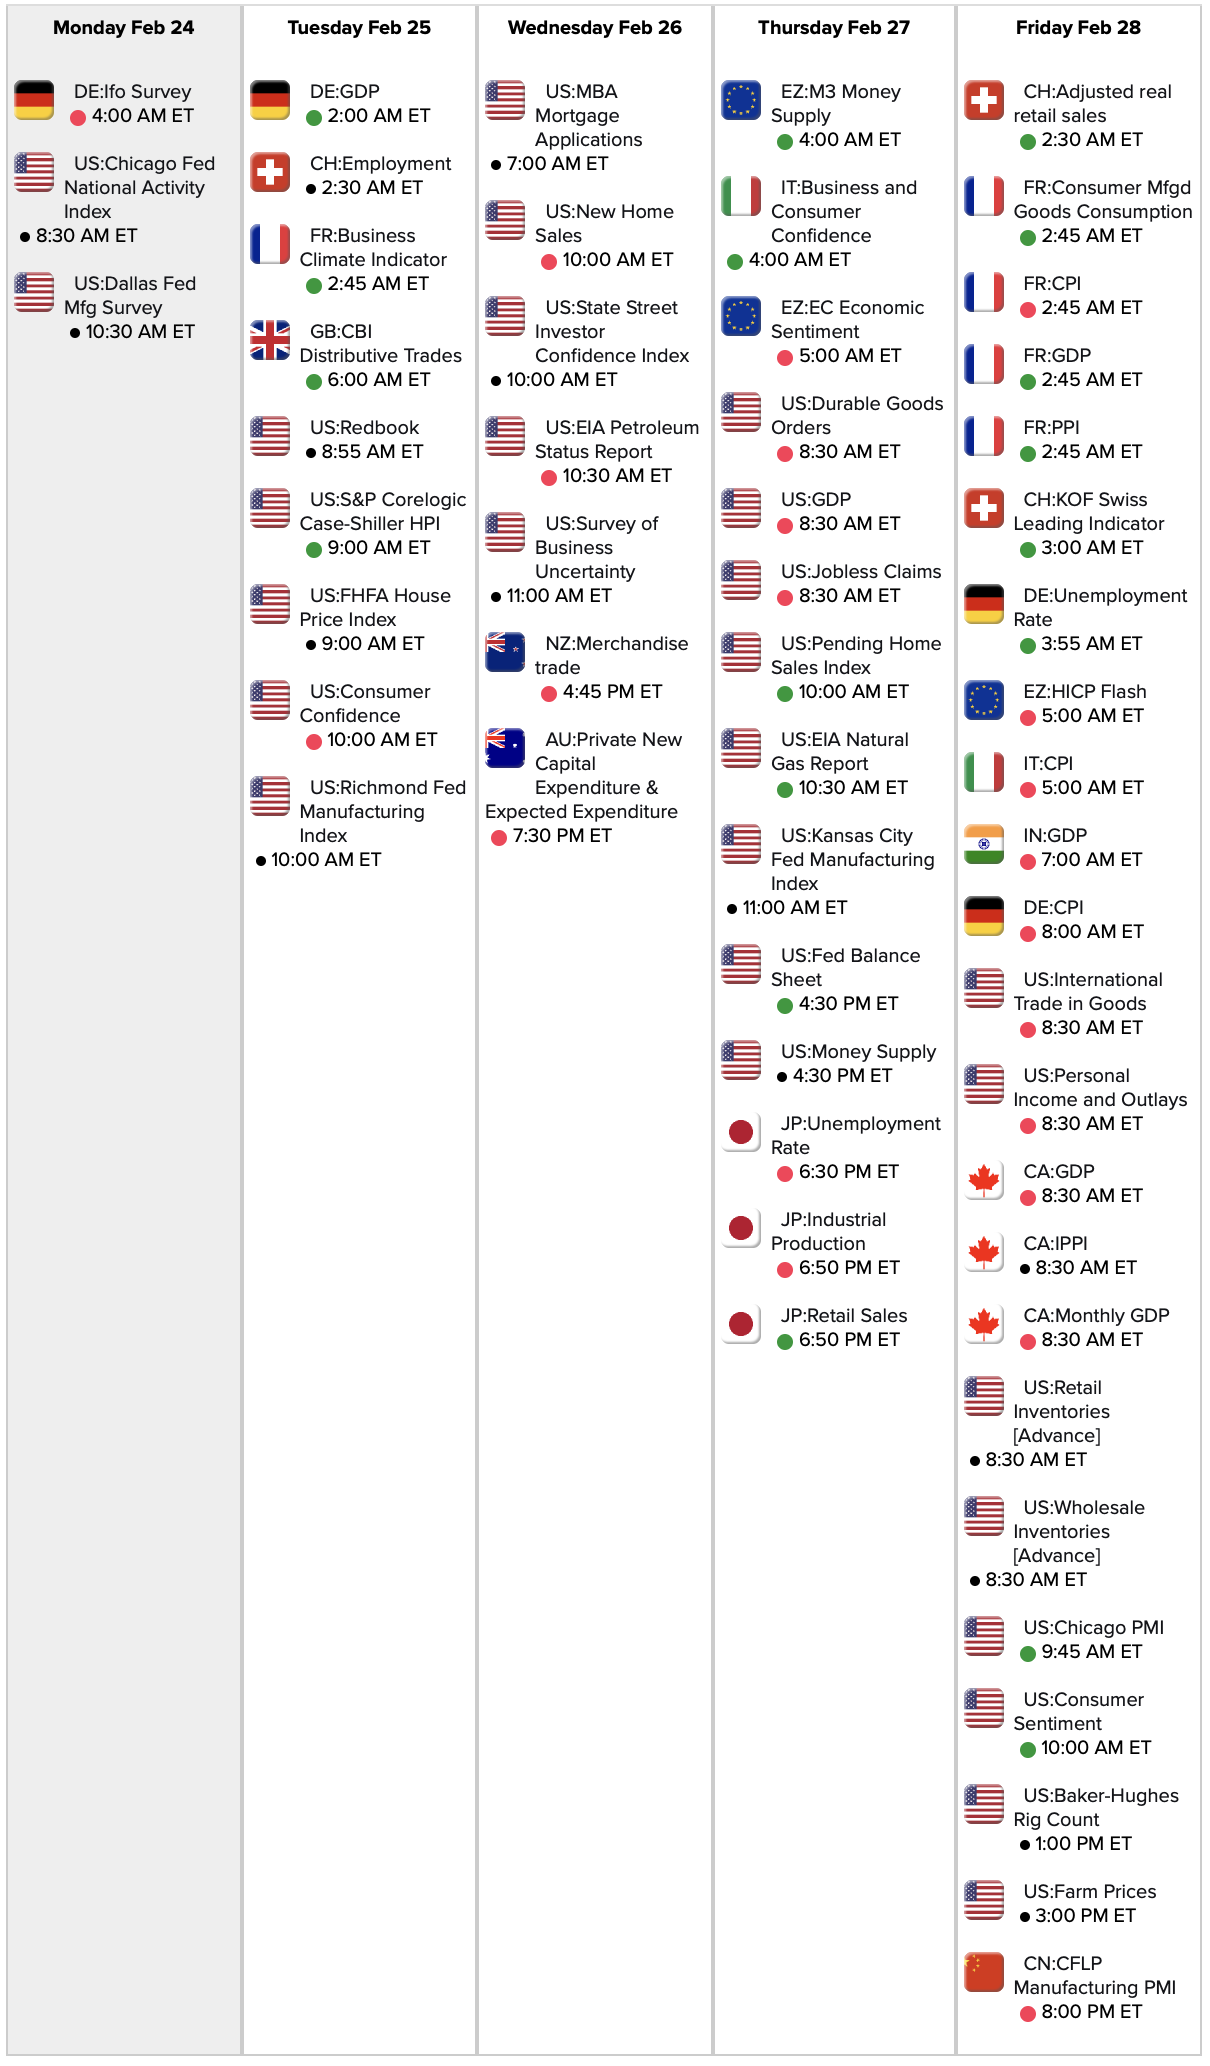
Link to calendar: https://research.investors.com/economic-calendar/
NUGT rising
#ContangoETFs Sold to Open $NUGT Sept 52 calls for 4.80.
SPX 1-dte
#SPX1dte Sold to open $SPX Feb 21st 3295/3315-3405/3425 condors for .80, IV: 11.99%, SPX 3371, deltas -.06, +.05
OLED put spread
#Earnings A bullish position for a stock that has bullish tendency on earnings.
Sold to Open $OLED Feb 21st 170/165 put spreads for 1.70.
DE earnings analysis
#Earnings $DE reports tomorrow morning. Below are details on earnings one-day moves over the last 12 quarters.
Nov. 27, 2019 BO -4.29%
Aug. 16, 2019 BO +3.84%
May 17, 2019 BO -7.65% Biggest DOWN
Feb. 15, 2019 BO -2.11%
Nov. 21, 2018 BO +2.42%
Aug. 17, 2018 BO +2.35%
May 18, 2018 BO +5.74%
Feb. 16, 2018 BO +1.57%
Nov. 22, 2017 BO +4.32%
Aug. 18, 2017 BO -5.37%
May 19, 2017 BO +7.30% Biggest UP
Feb. 17, 2017 BO +1.00%
Avg (+ or -) 4.00%
Bias 0.76%, positive bias on earnings.
With stock at 165.00 the data suggests these ranges:
Based on current IV (expected move into Friday per TOS): 158.30 to 171.70
Based on AVERAGE one-day move over last 12 quarters: 158.41 to 171.59
Based on MAXIMUM one-day move over last 12 Q’s (7.7%): 152.38 to 177.62
Based on UP max only (+7.3%): 177.05
Open to requests for other symbols.
OLED earnings analysis
#Earnings $OLED reports tonight. Below are details on earnings one-day moves over the last 12 quarters.
Oct. 30, 2019 AC +15.27%
Aug. 1, 2019 AC -1.64%
May 2, 2019 AC +8.76%
Feb. 21, 2019 AC +23.03%
Nov. 1, 2018 AC -20.50% Biggest DOWN
Aug. 9, 2018 AC +13.54%
May 3, 2018 AC +12.43%
Feb. 22, 2018 AC -15.81%
Nov. 2, 2017 AC +9.52%
Aug. 3, 2017 AC -1.30%
May 4, 2017 AC +23.87% Biggest UP
Feb. 23, 2017 AC +20.08%
Avg (+ or -) 13.81%
Bias 7.27%, strongly positive bias on earnings.
With stock at 177.50 the data suggests these ranges:
Based on current IV (expected move into Friday per TOS): 159.33 to 195.67
Based on AVERAGE one-day move over last 12 quarters: 153.41 to 202.59
Based on MAXIMUM one-day move over last 12 Q’s (23.9%): 135.51 to 220.49
Based on DOWN max only (-20.5%): 141.51
Open to requests for other symbols.
SPX 1-dte closed
#SPX1dte BTC $SPX Feb 21st 3395 calls for .30. Condors sold for .95 yesterday.
SEDG earnings analysis
#Earnings $SEDG reports tonight. Below are details on earnings one-day moves over the last 12 quarters.
Nov. 6, 2019 AC -0.01%
Aug. 6, 2019 AC +25.11% Biggest UP
May 6, 2019 AC +22.69%
Feb. 20, 2019 AC +1.46%
Nov. 1, 2018 AC -7.99%
Aug. 2, 2018 AC -13.94% Biggest DOWN
May 9, 2018 AC +16.53%
Feb. 14, 2018 AC +24.25%
Nov. 8, 2017 AC +19.38%
May 9, 2017 AC +11.04%
Feb. 14, 2017 AC +4.15%
Nov. 9, 2016 AC -0.71%
Avg (+ or -) 12.27%
Bias 8.50%, strongly positive bias on earnings.
With stock at 123.50 the data suggests these ranges:
Based on current IV (expected move into Friday per TOS): 108.93 to 138.07
Based on AVERAGE one-day move over last 12 quarters: 108.34 to 138.66
Based on MAXIMUM one-day move over last 12 Q’s (25.1%): 92.49 to 154.51
Based on DOWN max only (-13.9%): 106.28
Open to requests for other symbols.
Z earnings analysis
#Earnings $Z reports tonight. Below are details on earnings one-day moves over the last 12 quarters.
Nov. 7, 2019 AC +12.29%
Aug. 7, 2019 AC -15.29%
May 9, 2019 AC +5.04%
Feb. 21, 2019 AC +26.36% Biggest UP
Nov. 6, 2018 AC -26.92% Biggest DOWN
Aug. 6, 2018 AC -14.77%
May 7, 2018 AC -1.44%
Feb. 8, 2018 AC -2.67%
Nov. 7, 2017 AC +2.67%
Aug. 8, 2017 AC -9.05%
May 4, 2017 AC +9.29%
Feb. 7, 2017 AC -6.37%
Avg (+ or -) 11.01%
Bias -1.74%, negative bias on earnings.
With stock at 53.50 the data suggests these ranges:
Based on current IV (expected move into Friday per TOS): 47.10 to 59.90
Based on AVERAGE one-day move over last 12 quarters: 47.61 to 59.39
Based on MAXIMUM one-day move over last 12 Q’s (26.9%): 39.10 to 67.90
Based on UP max only (+26.4%): 67.60
Open to requests for other symbols.
STMP earnings analysis
#Earnings $STMP reports tonight. Below are details on earnings one-day moves over the last 12 quarters.
Nov. 7, 2019 AC +12.28%
Aug. 7, 2019 AC +27.46%
May 8, 2019 AC -55.75%
Feb. 21, 2019 AC -57.76% Biggest DOWN
Oct. 31, 2018 AC -9.74%
Aug. 1, 2018 AC +8.43%
May 3, 2018 AC +3.91%
Feb. 21, 2018 AC +11.00%
Nov. 2, 2017 AC -22.59%
Aug. 2, 2017 AC +35.88% Biggest UP
May 3, 2017 AC -0.40%
Feb. 23, 2017 AC -1.60%
Avg (+ or -) 20.57%
Bias -4.07%, negative bias on earnings.
With stock at 93.00 the data suggests these ranges:
Based on current IV (expected move into Friday per TOS): 72.11 to 113.89
Based on AVERAGE one-day move over last 12 quarters: 73.87 to 112.13
Based on MAXIMUM one-day move over last 12 Q’s (57.8%): 39.28 to 146.72
Based on UP max only (+35.9%): 126.37
Open to requests for other symbols.
HLF closed
#Earnings Bought to close $HLF Feb 21st 37 #ShortPuts for .05. Sold yesterday for .73
SPX 1-dte
#SPX1dte Sold to Open $SPX Feb 19th 3305/3325-3395/3415 condors for .95, IV 10.00%, SPX 3369, deltas -.07, +.07
Expiring: Feb 18th 3295/3315-3410/3430 condors, sold Friday for 1.05
HLF earnings analysis & trade
#Earnings $HLF reports tonight. Below are details on earnings one-day moves over the last 12 quarters.
Oct. 29, 2019 AC +11.67%
Aug. 1, 2019 AC -6.77% Biggest DOWN
May 2, 2019 AC -4.51%
Feb. 19, 2019 AC -2.01%
Oct. 30, 2018 AC -2.61%
Aug. 1, 2018 AC +13.03% Biggest UP
May 3, 2018 AC +4.47%
Feb. 22, 2018 AC +3.00%
Nov. 2, 2017 AC -2.92%
Aug. 1, 2017 AC -1.95%
May 4, 2017 AC +11.57%
Feb. 23, 2017 AC -4.51%
Avg (+ or -) 5.75%
Bias 1.54%, positive bias on earnings.
With stock at 39.00 the data suggests these ranges:
Based on current IV (expected move into Friday per TOS): 35.89 to 42.11
Based on AVERAGE one-day move over last 12 quarters: 36.76 to 41.24
Based on MAXIMUM one-day move over last 12 Q’s (13.00%): 33.92 to 44.08
Based on DOWN max only (-6.8%): 36.36
Open to requests for other symbols.
SPX 1-dte & expirations
#SPX1dte Sold to Open $SPX Feb 18th 3295/3315-3410/3430 condors for 1.05, IV 7.86%, SPX 3372, deltas -.07, +.06.
Winners:
Expiring: Feb 14th 3310/3330-3405/3425 condors, sold yesterday for 1.05
Expiring: $SHOP Feb 14th 465/460 put spreads, sold Tuesday for 1.416
Losers:
Expiring: $YELP 31 short puts and 39 short calls. Calendars bought for .303 total…. long positions remain for next Friday, but a long shot.
$TAP #DoubleCalendars closed for .01 debit. Lost total of .31.
The Hall of Rotating Presidents
In honor of Monday’s holiday, Options Bistro presents the third annual Hall of Rotating Presidents. If you don’t like the President who appears in the upper right, just click “Home/REFRESH” (or refresh your browser) and a new one will appear!
Have a great three-day weekend!
Econ Calendar for week of 2/17/20
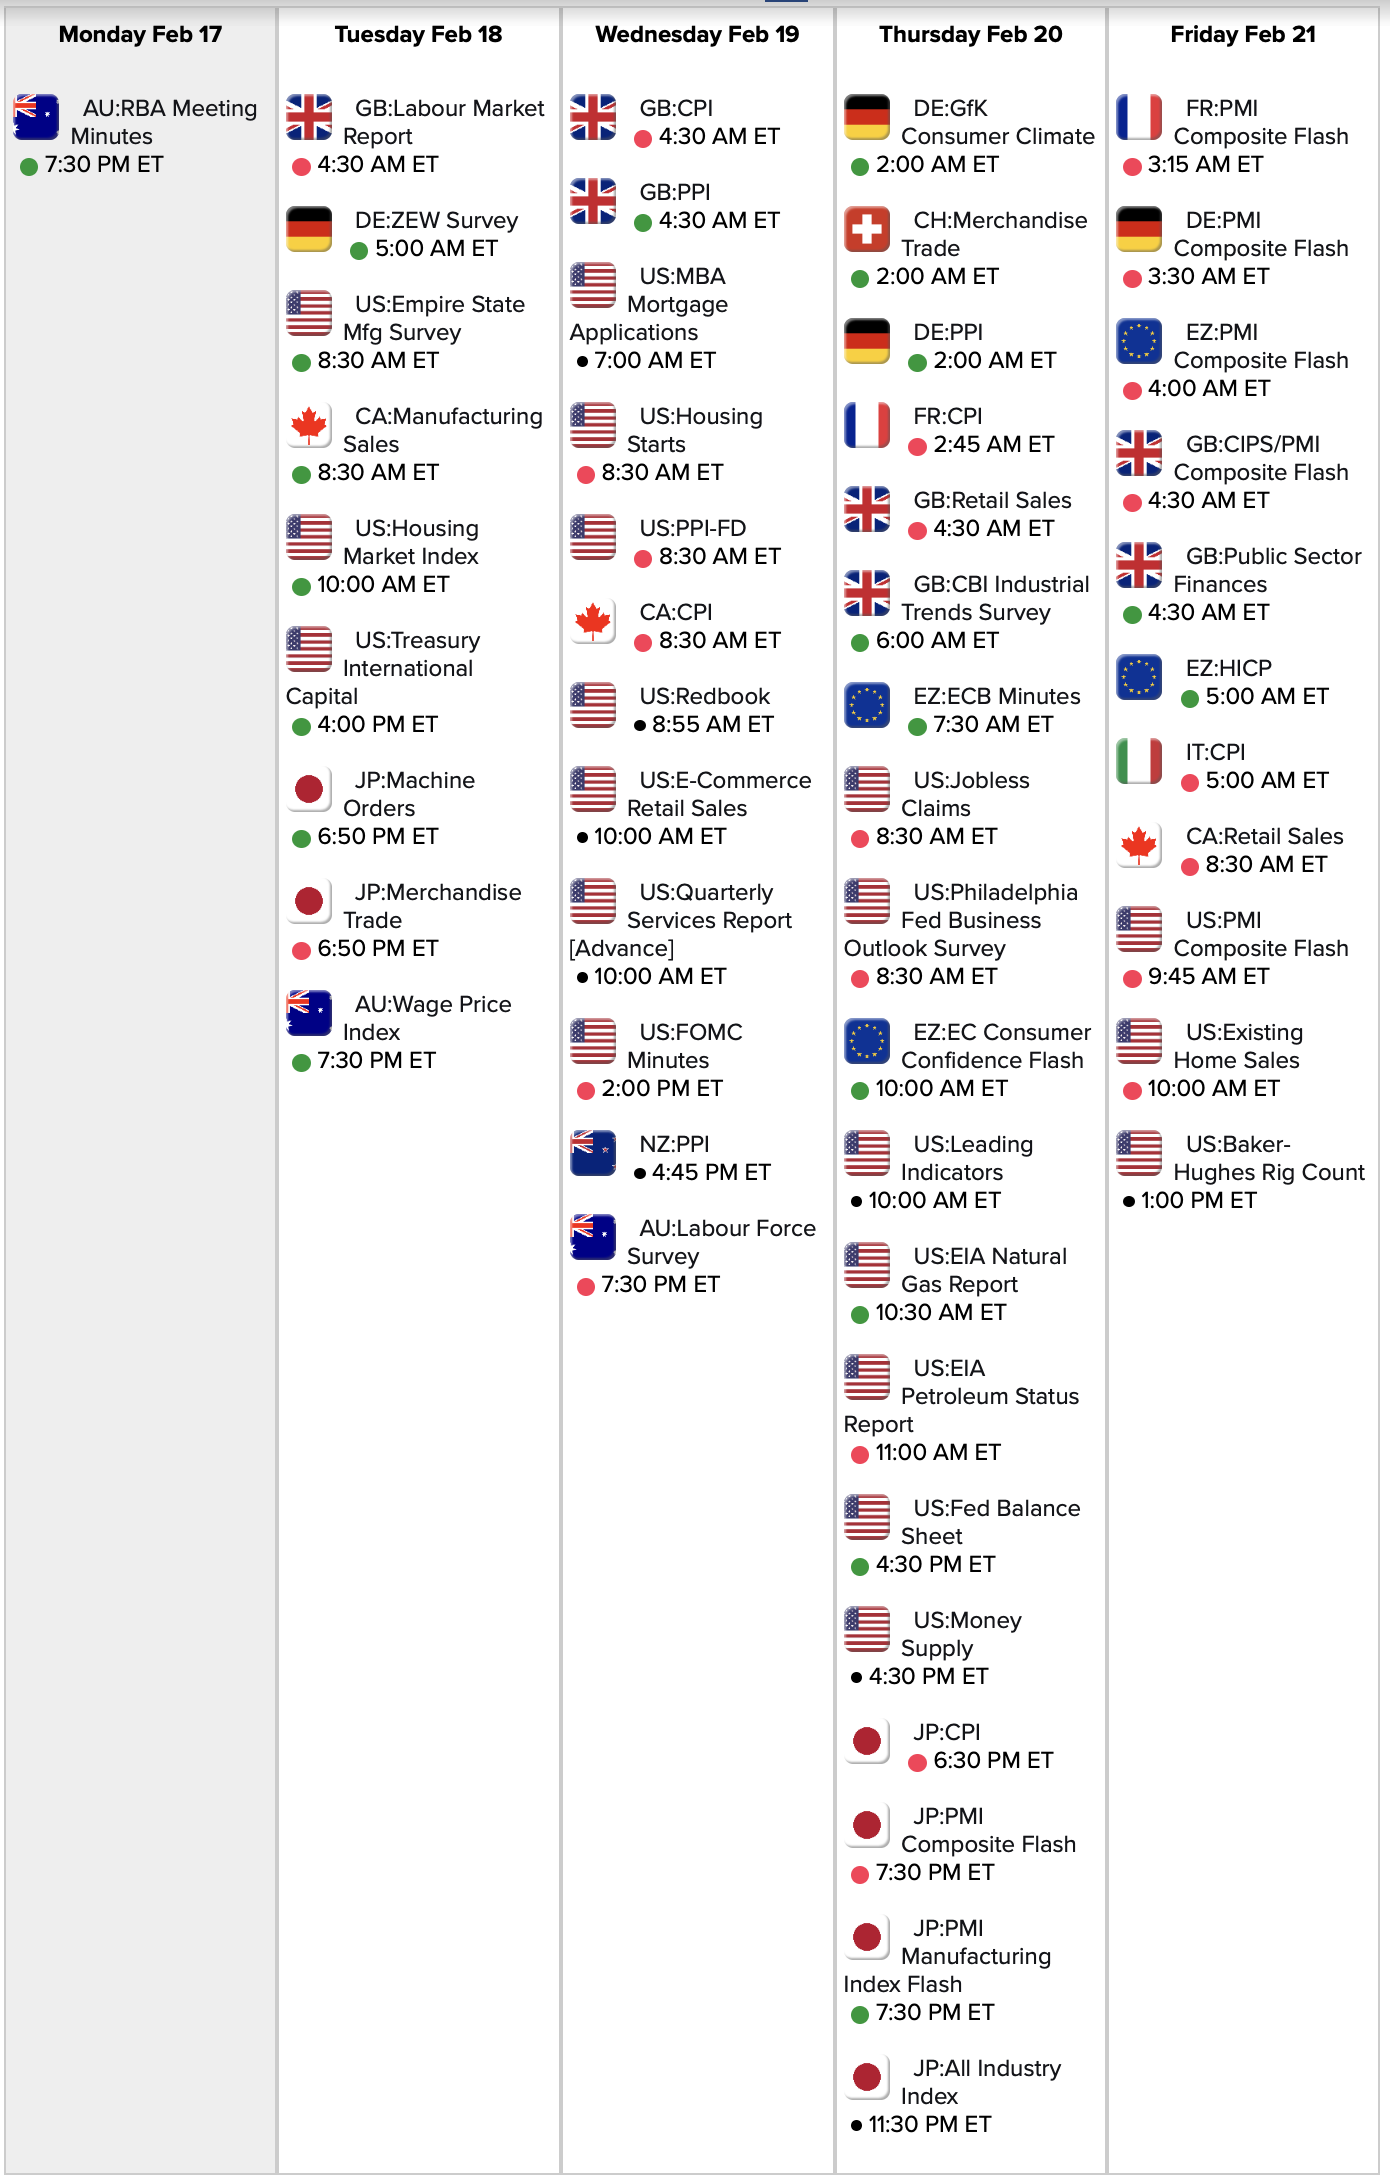
Link to Calendar: https://research.investors.com/economic-calendar/
SPX 1-dte
#SPX1dte Sold to Open $SPX Feb 14th 3310/3330-3405/3425 condors for 1.05, IV 10.76%, SPX 3378, deltas -.07, +.07
ROKU earnings analysis
#Earnings $ROKU reports tonight. Below are details on earnings one-day moves over the last 9 quarters (its entire history).
Nov. 6, 2019 AC -16.01%
Aug. 7, 2019 AC +20.85%
May 8, 2019 AC +28.11%
Feb. 21, 2019 AC +25.23%
Nov. 7, 2018 AC -22.29% Biggest DOWN
Aug. 8, 2018 AC +21.31%
May 9, 2018 AC -1.71%
Feb. 21, 2018 AC -17.71%
Nov. 8, 2017 AC +54.93% Biggest UP
Avg (+ or -) 23.13%
Bias 10.30%, strongly positive bias on earnings.
With stock at 140.00 the data suggests these ranges:
Based on current IV (expected move into Friday per TOS): 117.10 to 162.90
Based on AVERAGE one-day move over last 9 quarters: 107.62 to 172.38
Based on MAXIMUM one-day move over last 9 Q’s (54.9%): 63.10 to 216.90
Based on DOWN max only (-22.3%): 108.79
Open to requests for other symbols.
TSLA calls
#ShortCalls Sold to Open $TSLA Feb 28th 1100 calls for 5.00. Will look to add a put side on next pull back.
