
#VXXGame Bought to Open $SVXY Jan 2021 35 calls for 4.65. Considering this was in the high 60’s just last month, I figure this has good chance of profiting. I will scale into more when the market retests the lows.
Author Archives: Jeff
SPX 1-dte
#SPX1dte Sold $SPX March 27th 2380/2400-2760/2780 condors for 1.80. IV: 66%, SPX 2592, deltas: -.06, +.06, OTM -7.4%, +6.5%
Jobless claims soar to record high
3.28 million in weekly jobless claims, almost FIVE times previous record
Previous record was set in October 1982 at 695,000.
SPXpire
#SPX1dte Expiring: $SPX March 24th 2210/2230-2655/2675 condors, sold yesterday for 1.80.
So much for today’s rally?
Stocks tumble into the close after Bernie Sanders threatens to put a hold on the coronavirus stimulus bill; Nasdaq turns negative and Dow up only 480 points after surging 1,300 earlier https://t.co/kumM5Z3mLD pic.twitter.com/tw7O9qsyCw
— CNBC Now (@CNBCnow) March 25, 2020
Hey, anyone remember earnings trades?
#Earnings $MU reports tonight. Below are details on earnings one-day moves over the last 12 quarters.
Dec. 18, 2019 AC +2.80%
Sept. 26, 2019 AC -11.09% Biggest DOWN
June 25, 2019 AC +13.34% Biggest UP
March 20, 2019 AC +9.61%
Dec. 18, 2018 AC -7.91%
Sept. 20, 2018 AC -2.86%
June 20, 2018 AC +0.83%
March 22, 2018 AC -7.99%
Dec. 19, 2017 AC +4.02%
Sept. 26, 2017 AC +8.51%
June 29, 2017 AC -5.11%
March 23, 2017 AC +7.40%
Avg (+ or -) 6.79%
Bias 0.96%, positive bias on earnings.
With stock at 41.00 the data suggests these ranges:
Based on current IV (expected move into Friday per TOS): 35.64 to 46.36
Based on AVERAGE one-day move over last 12 quarters: 38.22 to 43.78
Based on MAXIMUM one-day move over last 12 Q’s (13.3%): 35.53 to 46.47
Based on DOWN max only (-11.1%): 36.45
Open to requests for other symbols.
SPX 1-dte
#SPX1dte Sold to open $SPX March 25th 2210/2230-2655/2675 condors for 1.80. IV: 79.84%, SPX 2440, deltas -.06, +.06. OTM: -8.6%, +8.8%.
SPXpire
#SPX1dte Expiring: 1975/2000-2550/2575 condors, sold Friday for 2.25.
SPXpire
#SPX1dte I didn’t sell a Monday condor because I’ve been bitten twice recently. I also maintain that we still have farther to go down.
Expired this morning: $SPX March 19th 2125/2150-2575/2600 (monthlys) condors, sold for 2.20 Thursday morning.
Expired at the close: $SPX March 20th 2170/2190-2635/2655 condors, sold Thursday afternoon for 1.85.
Econ calendar for week of 3/23/20
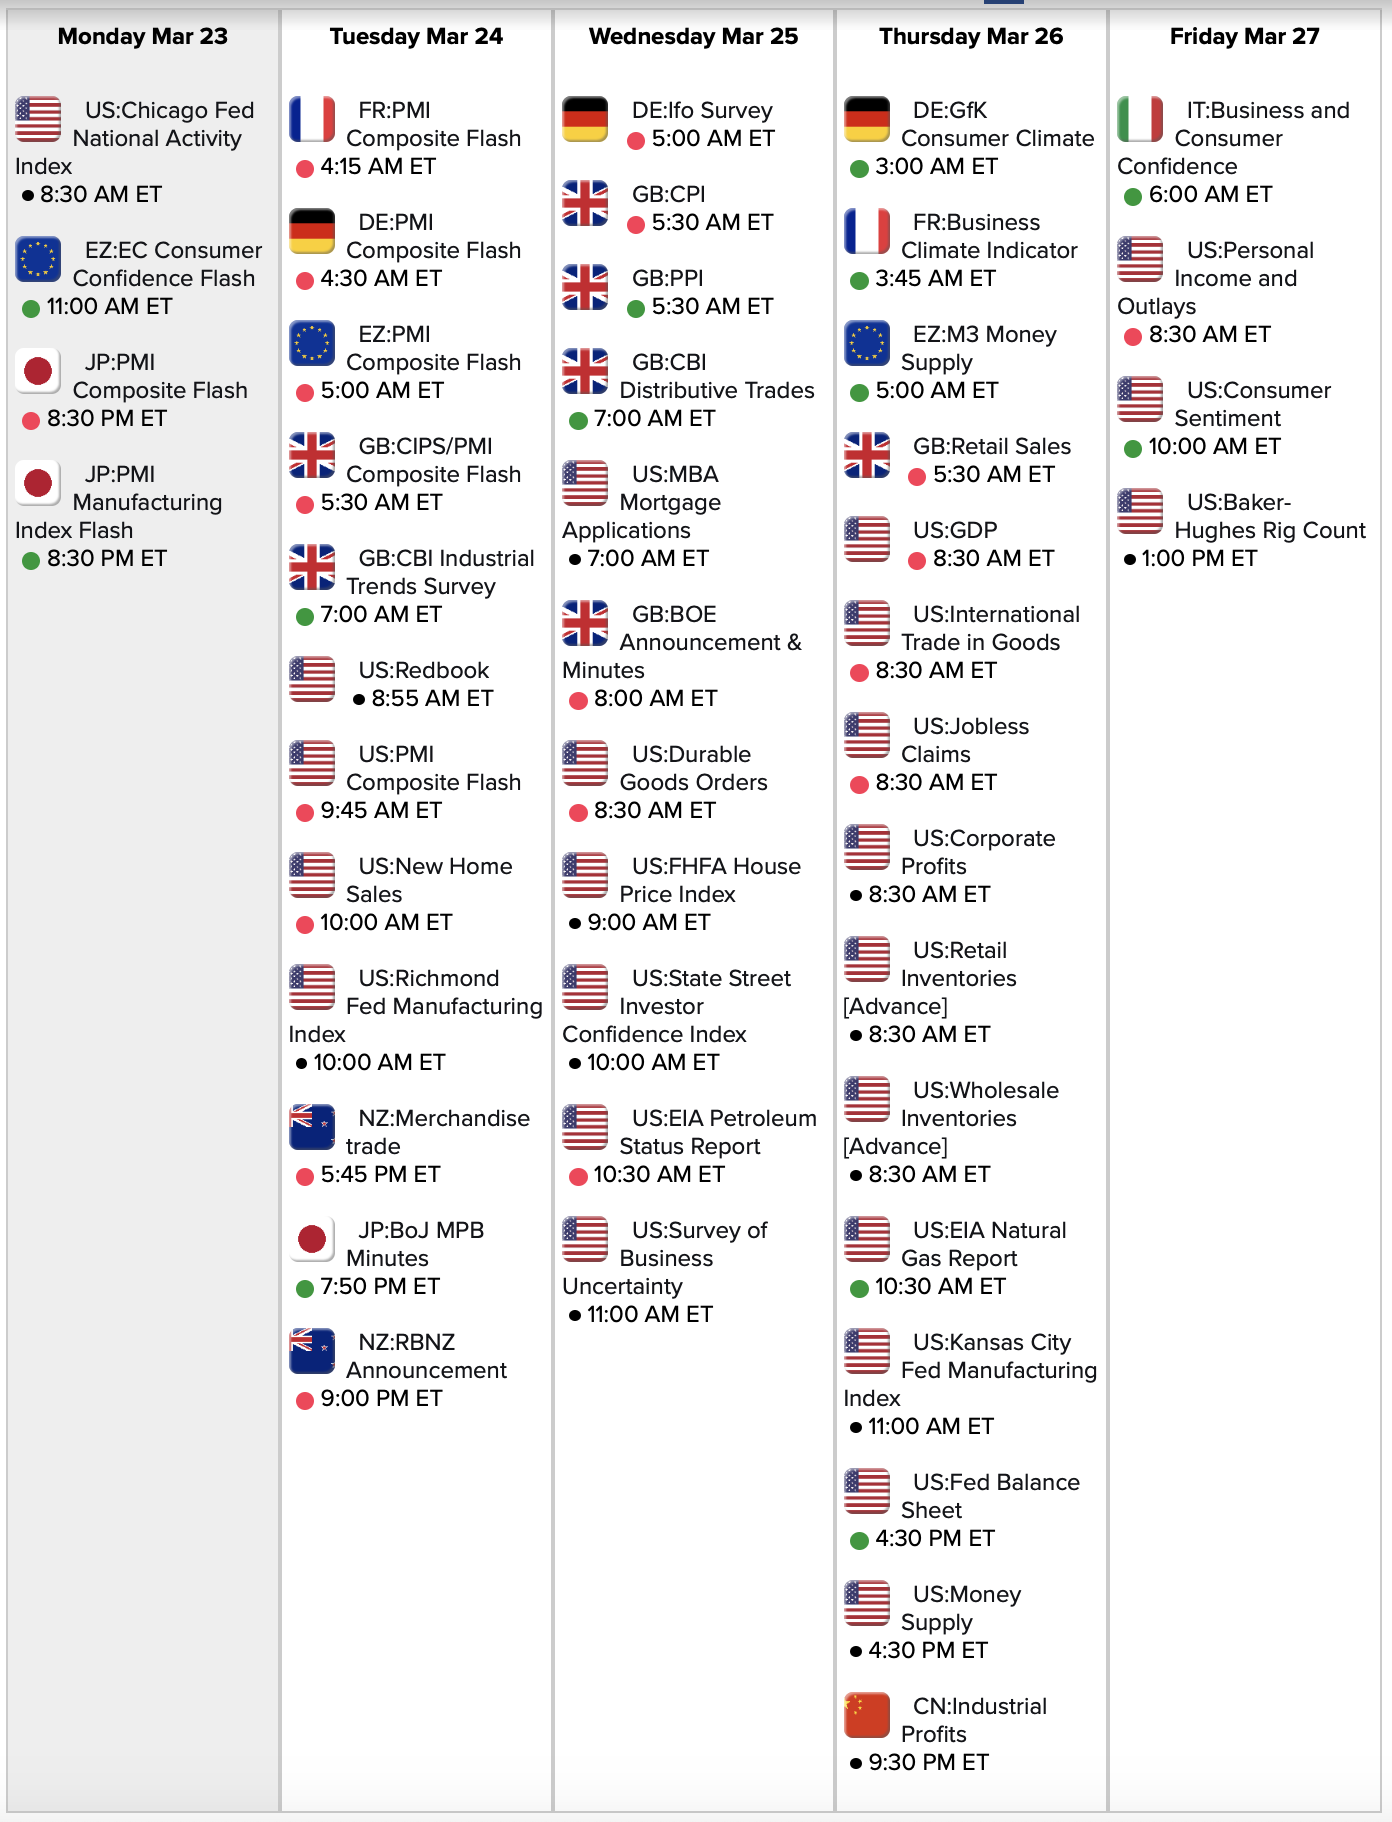

Link to calendar: https://research.investors.com/economic-calendar/
Episode 3 – Podcast Distancing
Showbiz shutdown / Top 5 “Coming Soon” picks / Streaming picks: “Spenser Confidential” & “Hunters” / Corrections / New Music picks – young new artists / Old Music pick – INXS / Guess these songs – random number generation // Find more details and playlists at http://thepickcast.com
SPX 1-dte
#SPX1dte Sold $SPX 2170/2190-2635/2655 condors for 1.85. IV: 84.2%, SPX 2406, deltas: -.07, +.06. OTM: -9.0% and +9.5%.
Couldn’t have picked a better outcome for my monthly condor put on this morning… placed the trade when we were flat on the day ended as close to flat as we can expect in this market. So I’m leaving the trade to settle in the morning as I do not fear +9% gaps.
Gap opens, continued
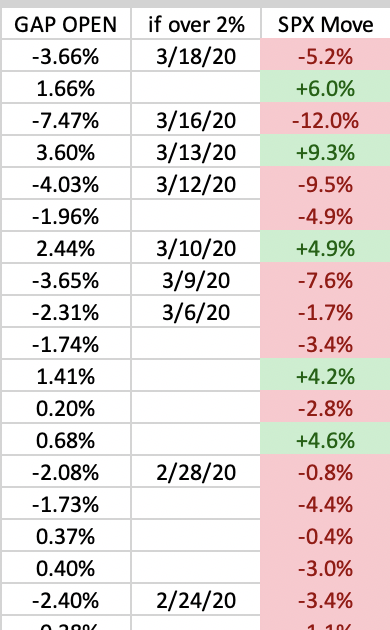
As a follow up to my first post from 2/25 (linked here: https://wp.me/p6Nxuc-i5m), gap opens over 2% have continued to happen frequently after their nearly 6-year absence. Here are the ones we have had thus far.
From Left to right: Gap Open each day / Date (if over 2%) / SPX move at the close
SPX 1-dte monthlys
#SPX1dte Sold to Open $SPX March 19th 2125/2150-2575/2600 condors for 2.20. These are MONTHLY contracts that stop trading tonight, but settle at the open tomorrow. I will need to decide at the close today whether to close or allow to expire in the morning, risking a gap open that could breach my strikes. Because of the funky expiration on these, I have avoided them for this strategy, but with SPX flat at the moment and juicy premium available, it’s worth the risk this time.
IV: 109.60%, SPX: 2400, deltas: -.06, +.06. OTM: -10.4%, +7.3%
Fun facts for today:
1. The Dow took 103 years to reach 10,000. It has just dropped 10,000 in less than 30 days.
2. The VIX has put in a higher intraday high 5 days in a row, despite two of those days being strong UP days for the market.
SPXpire
#SPX1dte Expiring: $SPX March 18th 2220/2240-2740/2760 condors, sold yesterday for 1.95.
Circuit breaker HIT again!
Crazy times. I don’t really see why this should end, however. The entire world is coming to a halt. Some businesses are closing entirely, unable to weather even a month being closed. Layoffs are piling up. Our country will rack up another $2T in debt probably before the end of this month. This is an unprecedented event… I feel the indexes could easily be cut in half, meaning 1500 by the time we get to May or June. But this is only my personal speculation… I just base it on what I think SHOULD happen when most of the world is shut down.
The VIX is up today but not as dramatically as VXX and UVXY. Futures backwardation is quite dramatic.
UVXY closed
This market is relentless. Welcome to the first Bear Market since 2009!
BTC $UVXY March 27th 50/60-130/140 condors for 3.825. Sold yesterday for 3.65.
I’m not sure how I got this to be only a small loss when UVXY has risen over 30% since when I sold it yesterday. But we could hit 130 today so I no longer like this trade. Lucky that I was able to exit so easily but the difference between the two call strikes was only 3.13, while the put side deflated from yesterday dramatically.
Fun stat for the day
The Dow has moved up or down over 4% for seven days straight, beating the previous record of six days that occurred in November 1929.
SPX-1dte
#SPX1dte Sold $SPX Mar 18th 2220/2240-2740/2760 condors for 1.95, IV: 94%, SPX 2523, deltas -.05, +.07. OTM: -11.2%, +7.8%.
UVXY condor
#VXXgame Sold $UVXY March 27th 50/60-130/140 condors for 3.65.
New VIX highs
Highest VIX close since 1987.
Largest move down in SPX since 1987 (on percentage basis).
Largest point move in SPX ever.
Panic close
#LongLEAPs Started again: BTO $TQQQ Jan 2021 90 calls for 2.50. Filled instantly.
Closing all VXX-game
#VXXGame. Since most of my options are expiring this Friday, I’m closing the whole batch of shorts AND longs. All shorts are now closed, and half the longs. I am riding the rest higher as long as it keeps going up.
SPX 1-dte stopped
#SPX1dte Bought to close $SPX March 16th 2380/2400-2930/2950 condors for 6.00. Sold Friday for 1.60.
Slap my hand for selling on a Friday again. Honestly, the last minute surge on Friday sucked me in. I was quite certain we would open down today, but I felt -11%+ OTM would be safe. It may still be safe, but since it almost touched my short strike, stopping is the prudent choice.
TOS charts frozen
Anyone else?
SPX 1 dte
#SPX1dte Sold to Open $SPX Mar 16th 2380/2400-2930/2950 condors for 1.60. IV: 67%, SPX (close) 2710, deltas: -.06, +.04. OTM: -11.4% and +8.1%.
Expiring: March 13th 2175/2200-2750/2775 condors, sold yesterday for 2.50.
TQQQ closed
#LongLEAPs Sold to close $TQQQ Jan 2021 90 calls for 4.00. Bought yesterday for 3.65 (avg price). I believe I will get a better entry.
Econ Calendar for week of 3/16/19
#FOMC meeting and Press conference on Wednesday
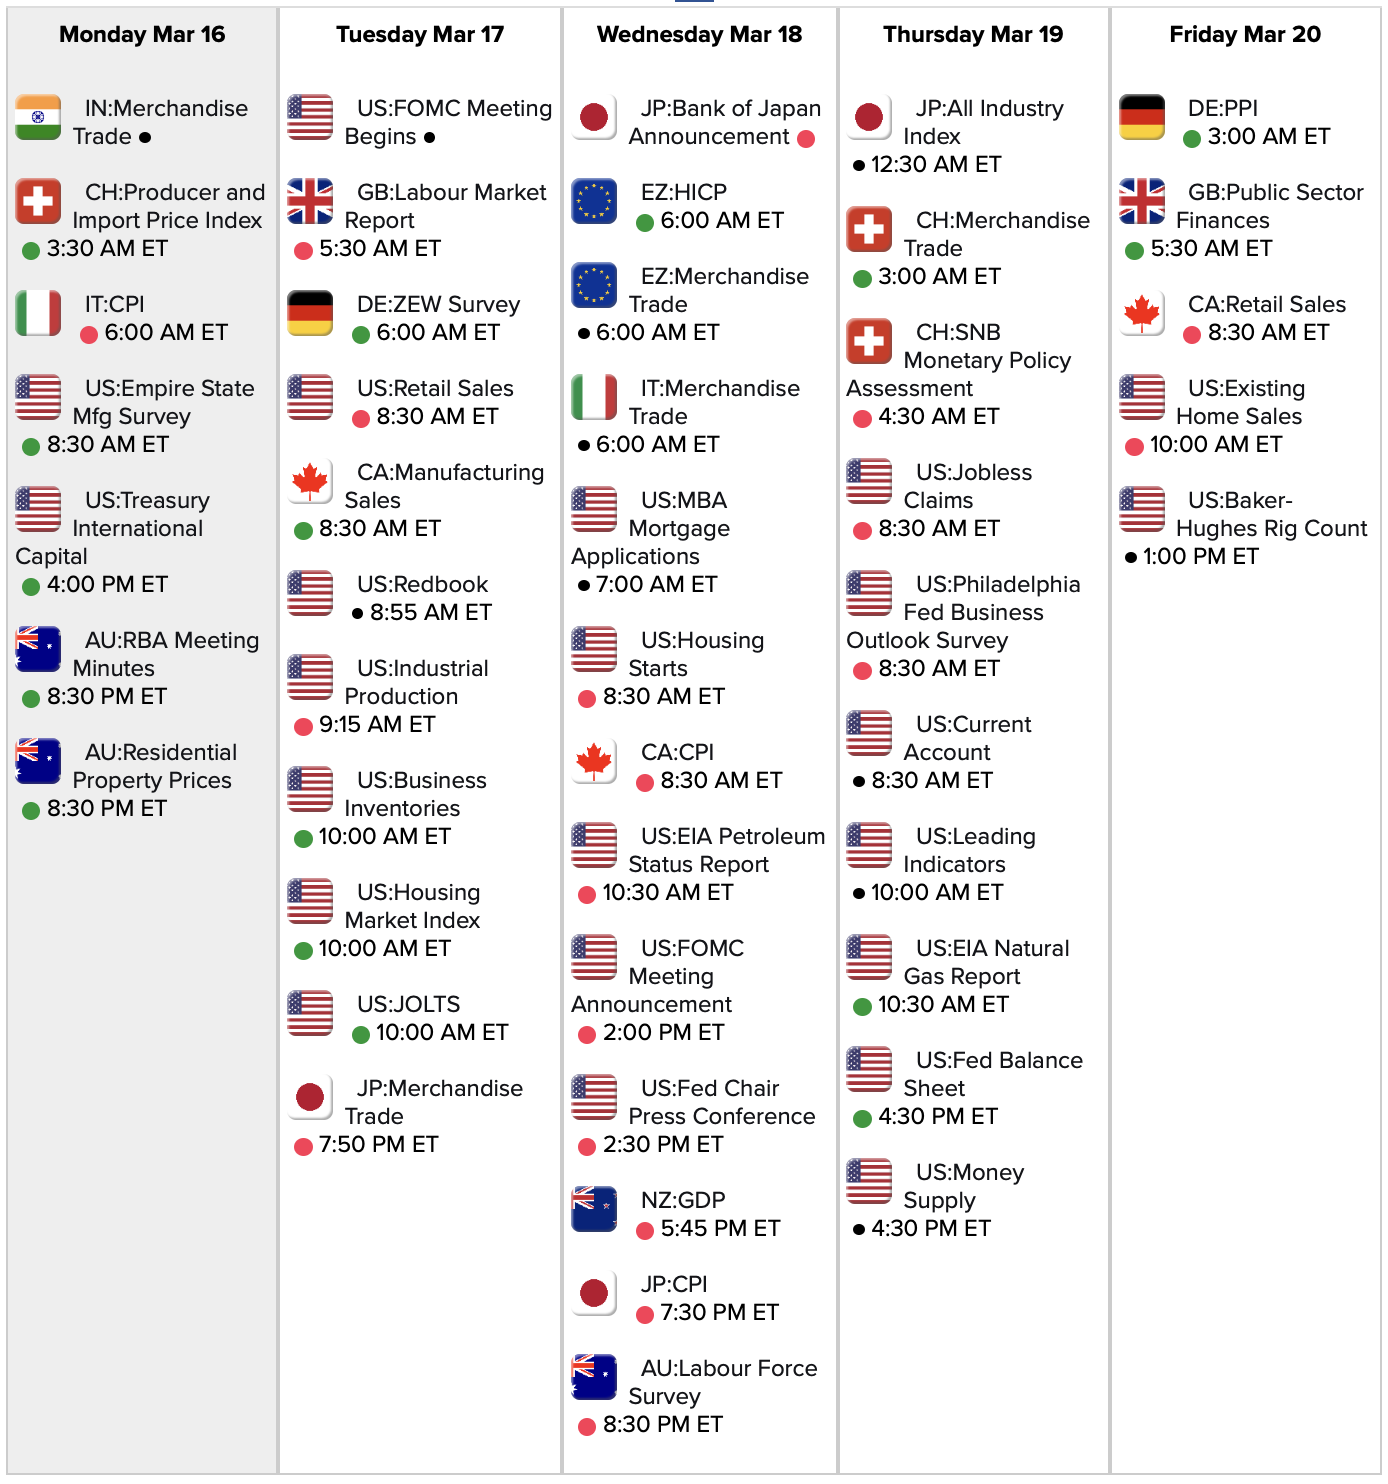
Link to calendar: https://research.investors.com/economic-calendar/
UVXY short stock
#VXXgame Bought to close $UVXY short stock for 64.00. Assigned via 15 calls on Tuesday.
On this UP day I’m making moves to get shorter on the market. I do not believe anything’s going to get better before it gets worse.
VIX close, 4th highest since 1987
The VIX closed higher 3 times in Oct/Nov 2008 (highest close 80.86)
It closed higher 7 times in Oct/Nov 1987 (highest close 150.19)
SPX 1-dte
#SPX1dte Sold to Open $SPX March 13th 2175/2200-2750/2775 condors for 2.50. IV: 101.18%, SPX 2544, deltas -.05, +.07. (has shifted back to 06/06 since it filled). Width: 550.
Today’s drop in SPX was about 8%. These strikes are -13.0% and +8.3% OTM, and I got the highest premium I’ve ever gotten.
DRIP
The $DRIP March 20th 980 strike is going for 150.00. It expires in 6 trading days. Should I buy it or sell it?
TQQQ starter
#LongLEAPs Bought to open $TQQQ Jan 2021 90 calls for 4.00. Will add as price drops.
2% bounce in seconds
BREAKING: NY FED SAYS TO CONDUCT PURCHASES ACROSS RANGE OF MATURITIES
— Jonathan Ferro (@FerroTV) March 12, 2020
Futures dropping
Since Trump spoke they have been in freefall. I am guessing shutting off travel to Europe is not so great for the market.
SPXpire
#SPX1dte Expiring: $SPX March 11th 2660/2680-3010/3030 condors, sold yesterday for for 2.10.
UVXY rolling
#VXXGame. BTC $UVXY March 20th 40 short calls for 10.35. Sold for 5.50 on March 6th. Still have more longs than shorts, but I think I can roll this one up if I wait a few more days.
Also early assigned on a couple of March 20th 15 short calls; didn’t notice earlier or would have closed. Will look to close today and then resell when market goes lower, as I believe it will.
SPX 1-dte
#SPX1dte Sold to Open $SPX March 11th 2660/2680-3010/3030 condors for 2.10, IV 55.97%, SPX 2870, deltas -.06, +.06.
GUSH shot
#ContangoETFs Bought to Open $GUSH Jan 2021 20 calls for .25. This may never make it back to 20 (a reverse split is probably imminent), but a cheap long shot that I will likely add to at lower strikes and more if there is a split.
Biggest drop since 2008
This time on a percentage basis… 7.6% on SPX. For a bigger drop you need to go back to Oct 2008.
Also, highest VIX close since January 2009.
SPX closed
#SPX1dte BTC $SPX Mar 9th 2780/2860 put spreads for 7.20. Condors sold for 1.60 on Friday. Two Mondays ago I let it ride and ended up with a full loss. This week, I got out at a fat loss and I’m guessing it will expire worthless. Such a bad day!
DRIP dropping
150 point swing so far
UVXY
Sold $UVXY March 20th 35 calls for 17.50. Bought for .31 on Jan 27th.
Some of these are my bright spots today. I have more longs than shorts so I can take profits on some of these. The rest is pretty ugly, mainly due to that stupid DRIP call I sold on Friday.
It’s not about trading, but…
I wanted to let you all know that I have started a podcast with friend. We cover music, movies, TV and other pop culture topics. I am going to be posting each episode on this blog, as I have it set up to feed directly to iTunes, Spotify, etc. Listeners from those sites will NOT be seeing Options Bistro, however. The Posts are only the mechanism to transmit to the platforms.
You can get more info and see all episodes and updates at my other website, thepickcast.com. I welcome your feedback or comments on that site or on the Posts I make on this site!
SPX 1-dte
#SPX1dte Sold to Open $SPX March 9th 2760/2780-3100/3120 condors for 1.60. IV: 35.09%, SPX 2972, deltas: -.07, +.06. Filled about 30 seconds after the bell.
Expiring: March 6th 2840/2860-3140/3160 condors, sold yesterday for 1.80.
VIX breakout
Going to new heights, folks.
Econ Calendar for week of 3/9/20
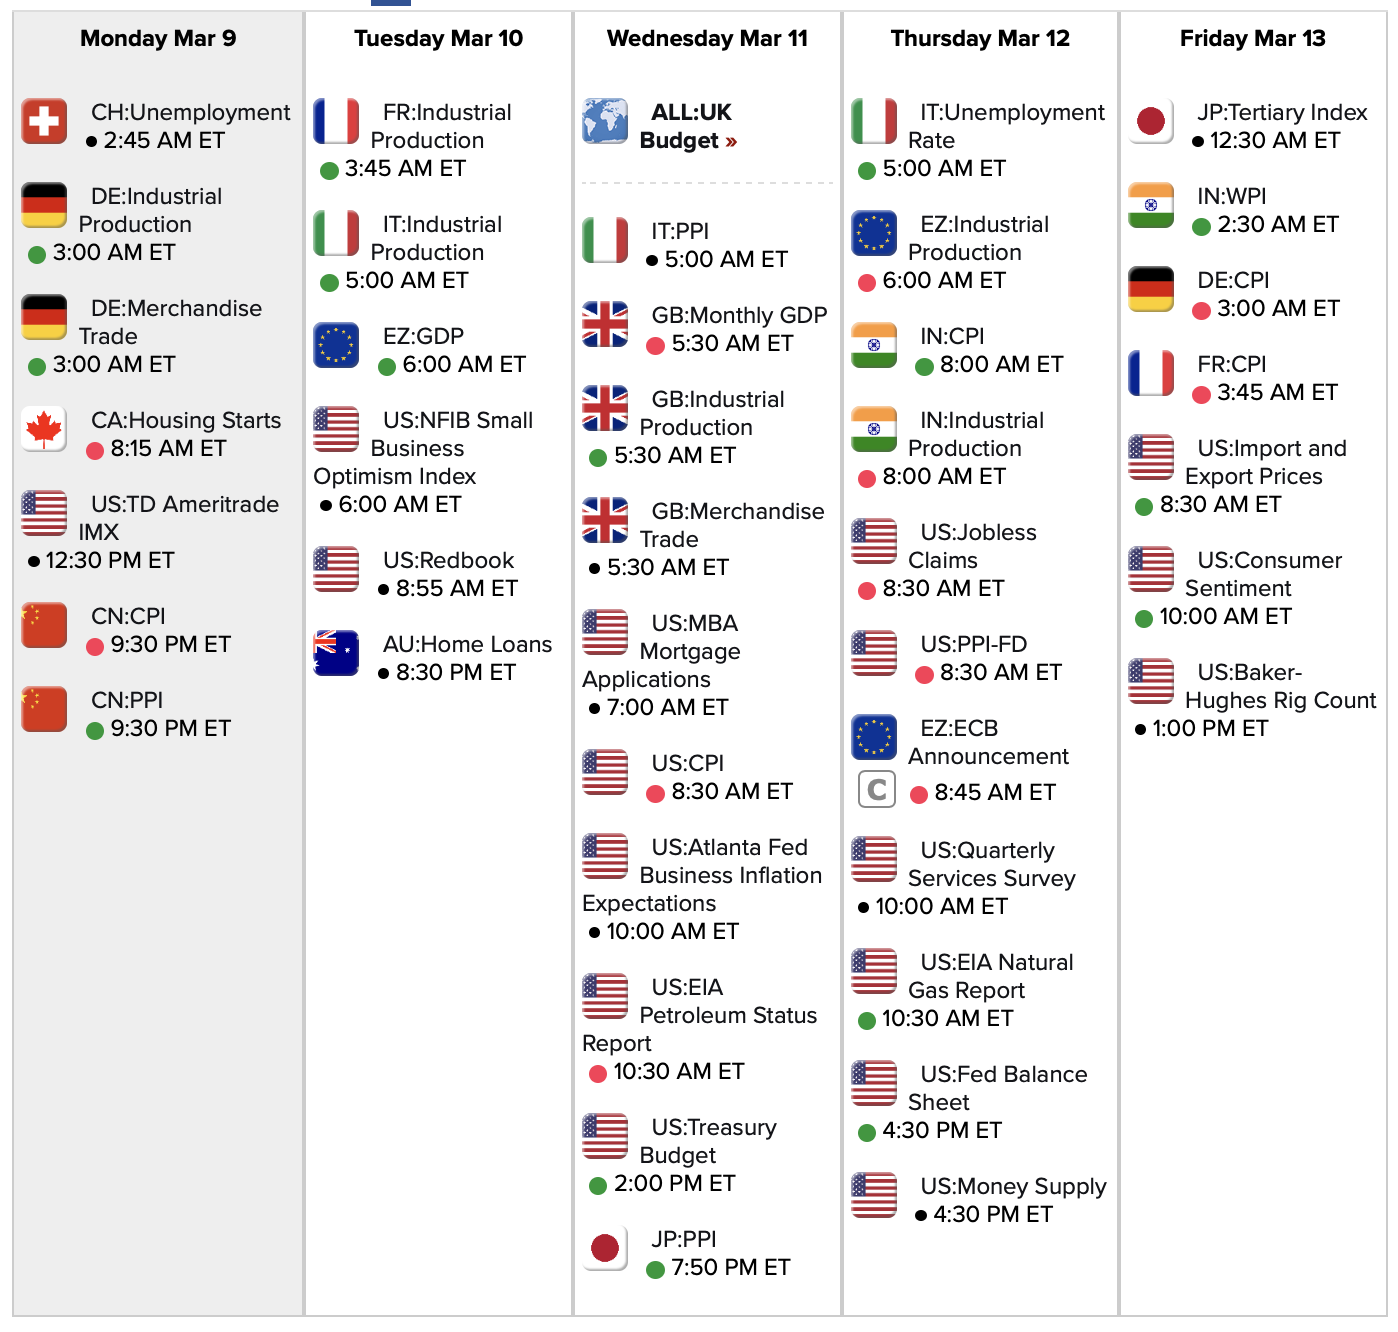
Link to calendar: https://research.investors.com/economic-calendar/
UVXY longs
#VXXgame My first purchase of puts: Bought to open $UVXY April 17th 20 puts for 1.39. I screwed up on my order, this can be gotten for less.
UVXY adding
#VXXgame Sold to Open $UVXY March 20th 40 calls for 5.50. Against a higher number of March 25 and 35 longs.
DRIP again
#ContangoETFs This was just too much to resist. I need to get back the losses I took by exiting last week.
Sold $DRIP March 20th 335 calls for 27.00.
February Jobs Report
#Jobs — beating expectations again
+273,000 non-farm payroll jobs, vs. 175K expected
Unemployment at 3.5%, down by 0.1%
U6 unemployment at 7.0%, up by 0.1%
Wages up 0.3%; +3.0% year over year
Labor force participation 63.4%, unchanged
January revised up from 225K to 273K
December revised up from 147K to 184K
Tale of two corrections
Following up from my Monday post comparing this correction to 2008’s… we are now looking more similar to the August 2011 correction.
Below, Aug 2011 is on the left, 2020 on the right. At the lows of Aug 2011, we had a week of extreme ups and downs like we have just experienced. In 2011, we then experienced a wide consolidation pattern into early October, when we finally went a bit lower and found the bottom. An extreme rally followed that.

SPX 1-dte
#SPX1dte Sold to Open $SPX March 6th 2840/2860-3140/3160 for 1.80. IV 43.65%, SPX 3020, deltas -.06, +.06
VXX adding
#VXXGame Sold to Open $VXX March 20th 29 calls for 1.95. Offset against March 25 and 27 long calls. First ones I have sold ABOVE my longs, which were bought for .30 and .26 respectively.
COST earnings analysis
#Earnings $COST reports tonight. Below are details on earnings one-day moves over the last 12 quarters.
Dec. 12, 2019 AC -1.83%
Oct. 3, 2019 AC +0.92%
May 30, 2019 AC -0.81%
March 7, 2019 AC +5.08% Biggest UP
Dec. 13, 2018 AC -8.58% Biggest DOWN
Oct. 4, 2018 AC -5.55%
May 31, 2018 AC -0.55%
March 7, 2018 AC -0.89%
Dec. 14, 2017 AC +3.32%
Oct. 5, 2017 AC -5.97%
May 25, 2017 AC +1.79%
March 2, 2017 AC -4.33%
Avg (+ or -) 3.30%
Bias -1.45%, negative bias on earnings.
With stock at 317.50 the data suggests these ranges:
Based on current IV (expected move into Friday per TOS): 303.56 to 331.44
Based on AVERAGE one-day move over last 12 quarters: 307.02 to 327.98
Based on MAXIMUM one-day move over last 12 Q’s (8.6%): 290.26 to 344.74
Based on UP max only (+5.1%): 333.63
Open to requests for other symbols.
Good morning!
New highs for $VXX and $UVXY, even though $VIX pretty far off its highs, and indices far off their lows.
SPLK earnings analysis
#Earnings $SPLK reports tonight. Below are details on earnings one-day moves over the last 12 quarters.
Nov. 21, 2019 AC +10.76%
Aug. 21, 2019 AC -7.83% Biggest DOWN
May 23, 2019 AC -7.32%
Feb. 28, 2019 AC -0.90%
Nov. 29, 2018 AC +9.93%
Aug. 23, 2018 AC +14.81%
May 24, 2018 AC -5.20%
March 1, 2018 AC +9.26%
Nov. 16, 2017 AC +17.89% Biggest UP
Aug. 24, 2017 AC +8.47%
May 25, 2017 AC -6.97%
Feb. 23, 2017 AC -3.23%
Avg (+ or -) 8.55%
Bias 3.31%, positive bias on earnings.
With stock at 150.00 the data suggests these ranges:
Based on current IV (expected move into Friday per TOS): 135.06 to 164.94
Based on AVERAGE one-day move over last 12 quarters: 137.18 to 162.82
Based on MAXIMUM one-day move over last 12 Q’s (17.9%): 123.17 to 176.84
Based on UP max only (-7.8%): 138.26
Open to requests for other symbols.
SPX 1-dte
#SPX1dte At 12:58 Pacific Time, sold $SPX March 4th 2830/2850-3140/3160 condors for 2.05. IV: 47.73%, SPX 3000, deltas: -.07, +.05
Episode 2 – High Fidelity
High Fidelity: from page, to film, to Hulu / John Cusack Top 5 / Parasite picked / Rock’n’Roll Hall of Fame inductees / New music picks / Old music pick / New picks from an old chick — Go to https://thepickcast.com for playlists and more info.
DLTR earnings analysis
#Earnings $DLTR reports tomorrow morning. Below are details on earnings one-day moves over the last 12 quarters.
Nov. 26, 2019 BO -15.24% Biggest DOWN
Aug. 29, 2019 BO -1.93%
May 30, 2019 BO +3.13%
March 6, 2019 BO +5.11%
Nov. 29, 2018 BO +6.13% Biggest UP
Aug. 30, 2018 BO -15.54%
May 31, 2018 BO -14.28%
March 7, 2018 BO -14.47%
Nov. 21, 2017 BO +2.41%
Aug. 24, 2017 BO +5.62%
May 25, 2017 BO +0.92%
March 1, 2017 BO +0.20%
Avg (+ or -) 7.08%
Bias -3.16%, negative bias on earnings.
With stock at 83.00 the data suggests these ranges:
Based on current IV (expected move into Friday per TOS): 76.44 to 89.56
Based on AVERAGE one-day move over last 12 quarters: 77.12 to 88.88
Based on MAXIMUM one-day move over last 12 Q’s (15.5%): 70.10 to 95.90
Based on UP max only (+6.1%): 88.09
Open to requests for other symbols.
TSLA up again
Maybe some calls sales today.
Tale of two scales
Since last week has been called the worst week since 2008, I thought I would compare the charts from the two.
The first comparison is between the two weeks with the bars on each scaled to match SPX point moves (not percentage). 2008 is on the left, 2020 on the right:
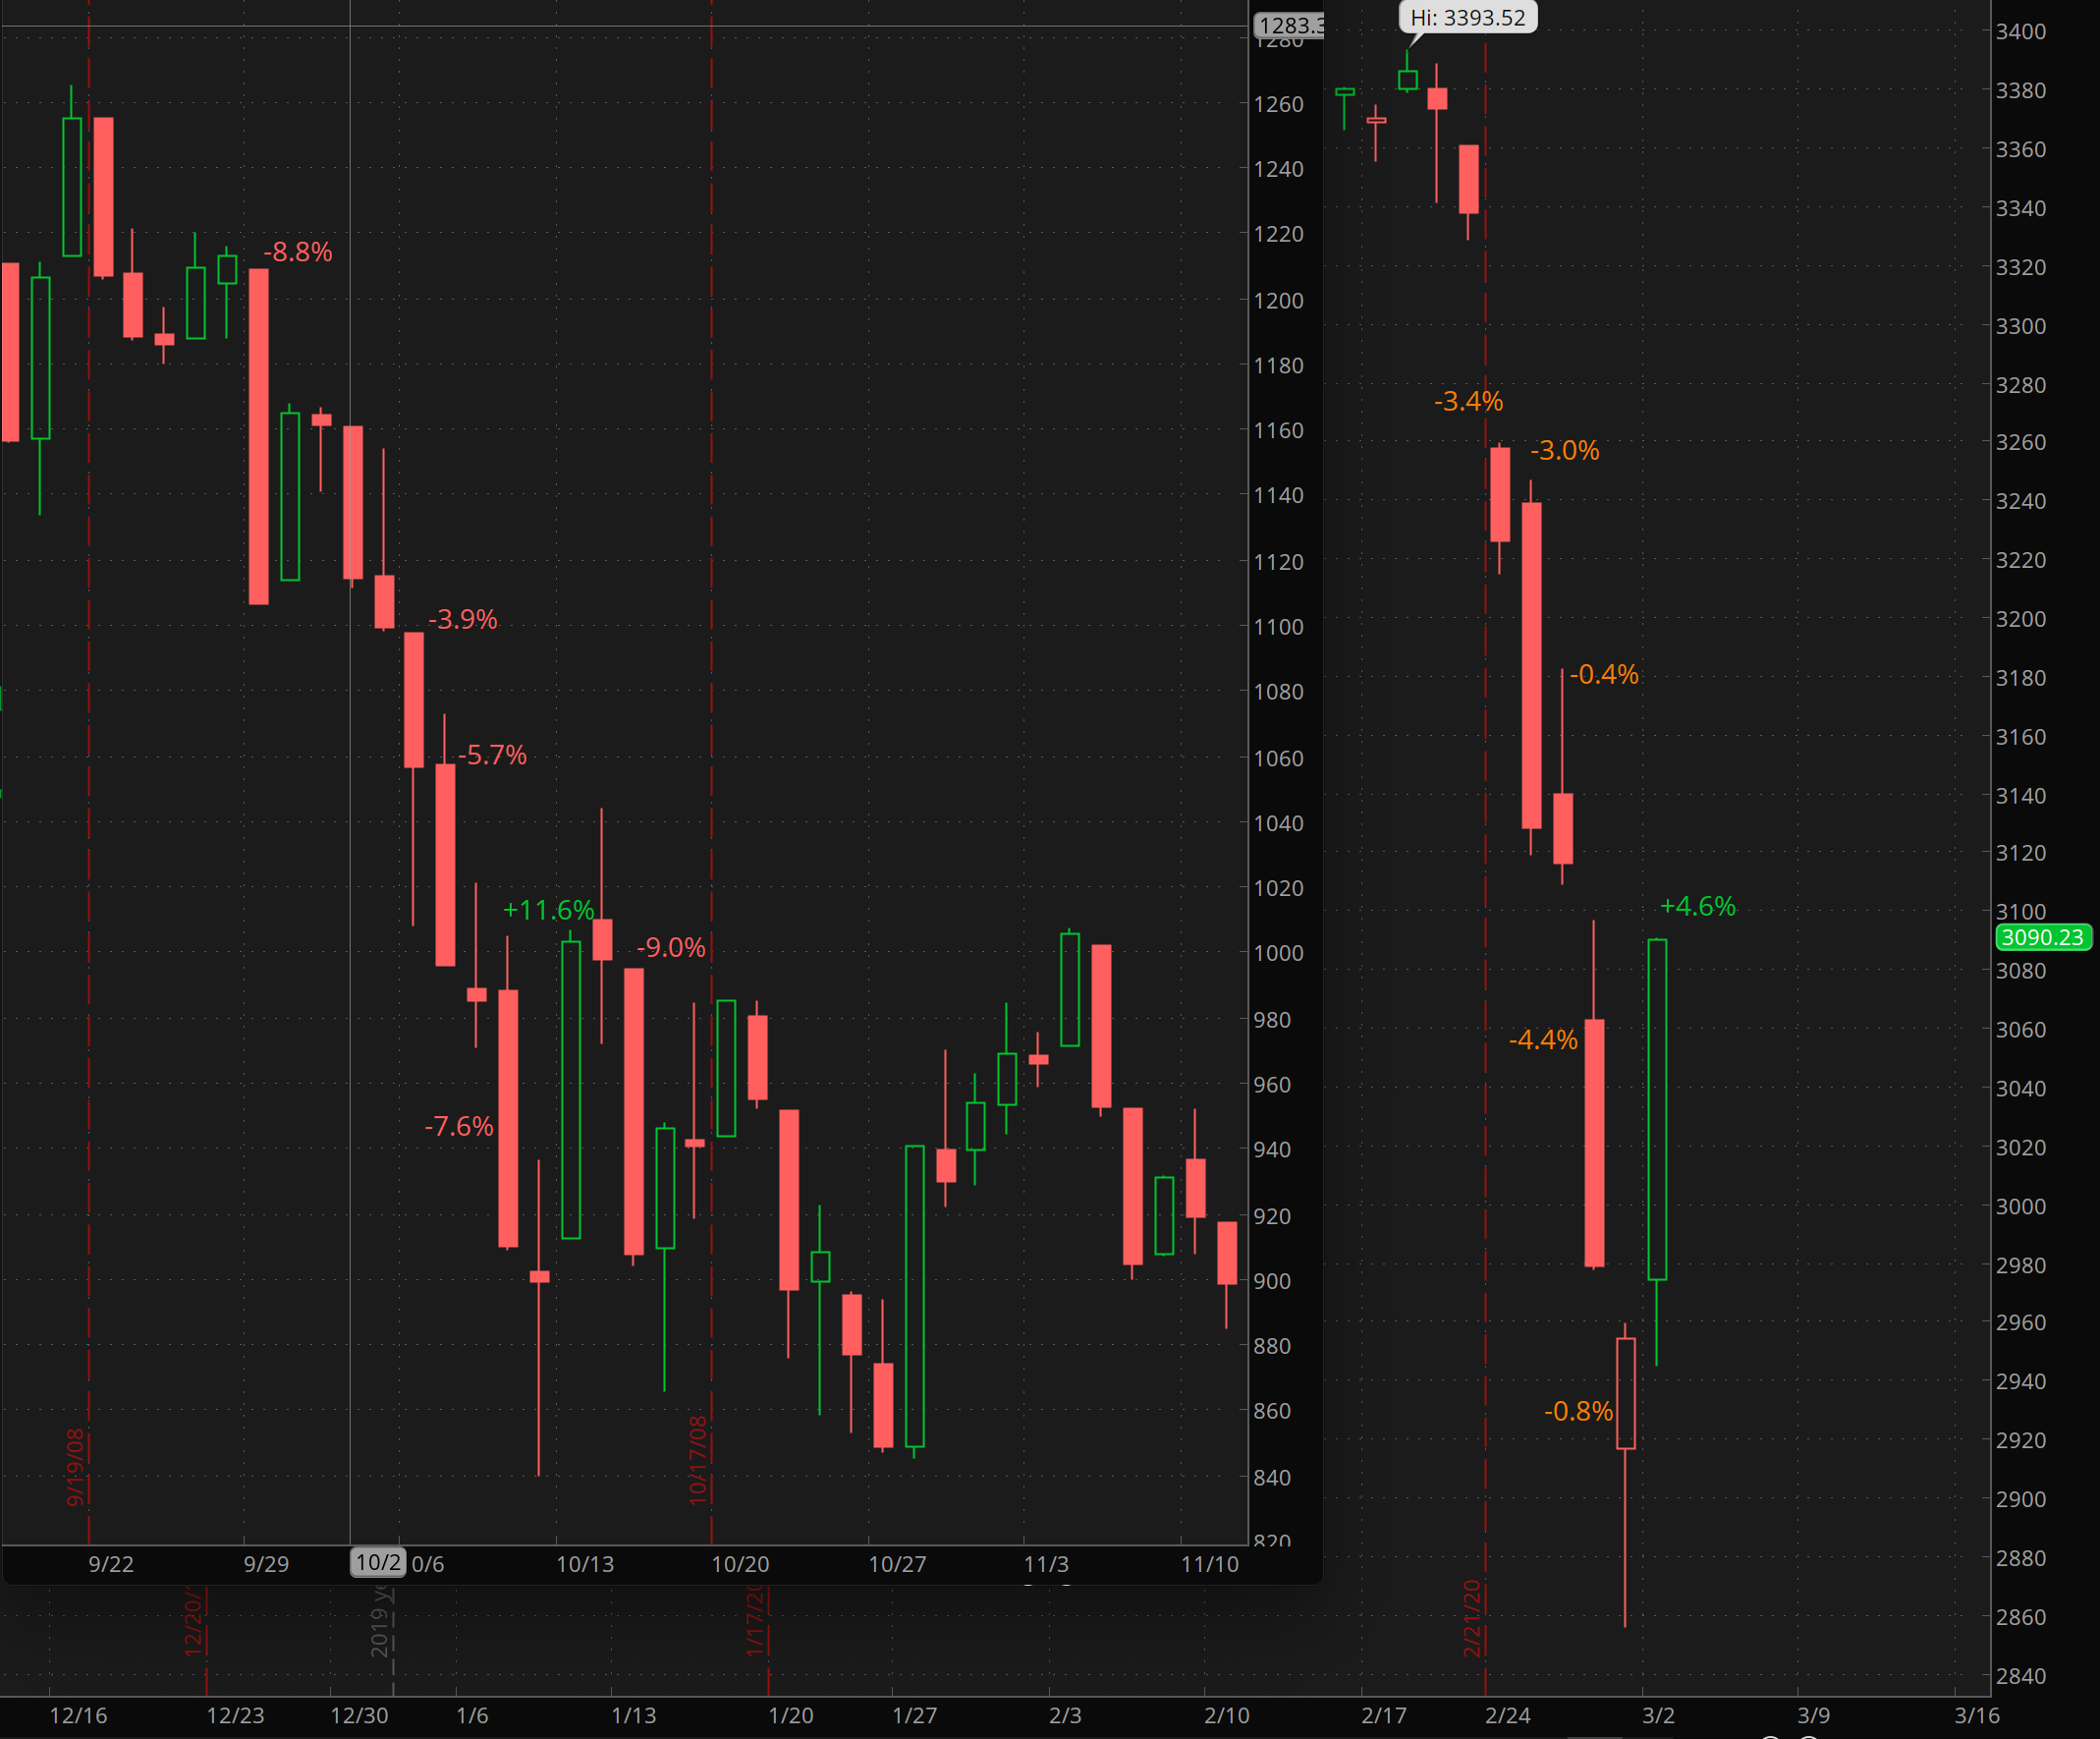
The second resizes the 2020 week so that the scales match on a percentage basis. 2020 is on the left, 2008 on the right:

As you can see, the moves in 2008 were bigger on a percentage basis, while last week was bigger on a point basis.
In 2008, the first huge up day was nowhere near the bottom, which didn’t happen for another five months.
SPXpire
#SPX1dte Expiring: $SPX March 2nd 2600/2625-3100/3125 condors, sold Friday for 2.05.
TGT earnings analysis
#Earnings $TGT reports tomorrow morning. Below are details on earnings one-day moves over the last 12 quarters.
Nov. 20, 2019 BO +14.05%
Aug. 21, 2019 BO +20.42% Biggest UP
May 22, 2019 BO +7.78%
March 5, 2019 BO +4.58%
Nov. 20, 2018 BO -11.26%
Aug. 22, 2018 BO +3.20%
May 23, 2018 BO -5.69%
March 6, 2018 BO -4.45%
Nov. 15, 2017 BO -9.86%
Aug. 16, 2017 BO +3.60%
May 17, 2017 BO +0.93%
Feb. 28, 2017 BO -12.16% Biggest DOWN
Avg (+ or -) 8.17%
Bias 0.93%, positive bias on earnings.
With stock at 107.50 the data suggests these ranges:
Based on current IV (expected move into Friday per TOS): 99.01 to 115.99
Based on AVERAGE one-day move over last 12 quarters: 98.72 to 116.28
Based on MAXIMUM one-day move over last 12 Q’s (20.4%): 85.55 to 129.45
Based on DOWN max only (-12.2%): 94.43
NOTE: Five-day MAX moves are +21.00% and -13.39%
Open to requests for other symbols.
KSS earnings analysis
#Earnings $KSS reports tomorrow morning. Below are details on earnings one-day moves over the last 12 quarters.
Nov. 19, 2019 BO -19.48% Biggest DOWN
Aug. 20, 2019 BO -6.88%
May 21, 2019 BO -12.33%
March 5, 2019 BO +7.31% Biggest UP
Nov. 20, 2018 BO -9.22%
Aug. 21, 2018 BO +1.71%
May 22, 2018 BO -7.42%
March 1, 2018 BO -5.05%
Nov. 9, 2017 BO +0.93%
Aug. 10, 2017 BO -5.79%
May 11, 2017 BO -7.83%
Feb. 23, 2017 BO -2.08%
Avg (+ or -) 7.17%
Bias -5.51%, strong negative bias on earnings.
With stock at 38.00 the data suggests these ranges:
Based on current IV (expected move into Friday per TOS): 34.63 to 41.37
Based on AVERAGE one-day move over last 12 quarters: 35.28 to 40.72
Based on MAXIMUM one-day move over last 12 Q’s (19.5%): 30.60 to 45.40
Based on UP max only (+7.3%): 40.78
NOTE: Five-day MAX moves are +4.81% and -19.52%
Open to requests for other symbols.
AZO earnings analysis
#Earnings $AZO reports tomorrow morning. Below are details on earnings one-day moves over the last 12 quarters.
Dec. 10, 2019 BO +6.92% Biggest UP
Sept. 24, 2019 BO -4.41%
May 21, 2019 BO +5.56%
Feb. 26, 2019 BO +5.10%
Dec. 4, 2018 BO +6.74%
Sept. 18, 2018 BO -1.97%
May 22, 2018 BO -9.48%
Feb. 27, 2018 BO -11.06%
Dec. 5, 2017 BO +0.42%
Sept. 19, 2017 BO -5.00%
May 23, 2017 BO -11.84% Biggest DOWN
Feb. 28, 2017 BO -0.58%
Avg (+ or -) 5.76%
Bias -1.63%, negative bias on earnings.
With stock at 1030.00 the data suggests these ranges:
Based on current IV (expected move into Friday per TOS): 951.27 to 1108.73
Based on AVERAGE one-day move over last 12 quarters: 970.71 to 1089.29
Based on MAXIMUM one-day move over last 12 Q’s (11.8%): 908.05 to 1151.95
Based on UP max only (+6.9%): 1101.28
NOTE: Five-day MAX moves are +7.60% and -9.93%
Open to requests for other symbols.
SPX 1-dte
#SPX1dte Sold to Open $SPX March 2nd 2600/2625-3100/3125 condors for 2.05. IV: 50%, SPX 2827, deltas: -.05, +.07. Width: 375
That’s the best premium I have gotten in 14 months of this strategy, and the shorts were -10.3% and +5.9% OTM, when the trade filled. But 3 minutes later at the close, that shifted to -11.1% and +4.9%.
SPX 57% Vol
#SPX1dte Monday’s expiration is off-the-charts volatility. I’m going to be able to sell a condor that has short puts at 2570 or lower, or 11.4% OTM, and still get excellent premium. Pulling the trigger before the close.
SPX 1-dte closed
#SPX1dte BTC $SPX Feb 28th 2850/2830 put spreads for .60. Condors sold yesterday for 1.45.
Not sure if I’ll be selling one tonight, but if I do, I am waiting until a minute before the close, or right after the close. After yesterday’s last-minute dive, I ain’t risking it.
2% gap open again
Following up to my posts on Monday and Tuesday, the open price of $SPX this morning was -2.08%. So the second time that’s happened this week, and since 2014.
Fun stats for today
Largest Dow point-drop in history: -1,190.95 (-4.42%)
Largest S&P point-drop in history -137.63 (-4.42%) (exact same percentage as Dow)
Worst S&P day since August 2011 (percentage basis)
Fastest correction (down 10%) in entire history of stock market.
SPX 1-dte
#SPX1dte . Sold $SPX Feb 28th 2830/2850-3120/3140 condors for 1.45. IV: 41.97%, SPX 3013, deltas: -.06, .06.
Width: 270 points
VIX spread closed
Sold to close $VIX March 17th 17/20 call spread for 2.21. Bought for .52 on Jan 15th. Max possible on this is 3.00, so I’ll take this now, as the risk of going to zero is bigger than the additional .79 I might gain.
UVXY adding
#VXXGame Earlier, sold $UVXY Apr 17th 19 call for 4.65. Adding to the position. Number of shorts in VXXGame is still about one-third number of longs.

