

The Hack is Back; our favorite millennial (Kenichi Hackman) returns with new music picks; Jeff tries to Pick that Flick; and the Go-Go’s rock a new doc and new song. Plus, we preview The Pick 100. More details, links, and playlists at https://thepickcast.com
Author Archives: Jeff
SPX 1-dte
#Spx1dte Sold to Open $SPX Aug 24th 3320/3340-3440/3460 condors for .90, IV 10.25%, SPX 3398, delats: -.09, +.05.
Expiring: Aug 21st 3315/3335-3425/3445 condors, sold yesterday for 1.00.
SPX 7-dte closed
#SPX7dteLong Sold to Close $SPX Aug 21st 3390/3410 call spreads for 8.25. Put side sold for 4.45 yesterday. Bought for 15.20 on Monday, closed for 12.70 total. Need to break out of this consolidation to get these back into profit mode.
Econ Calendar for week of 8/24/20
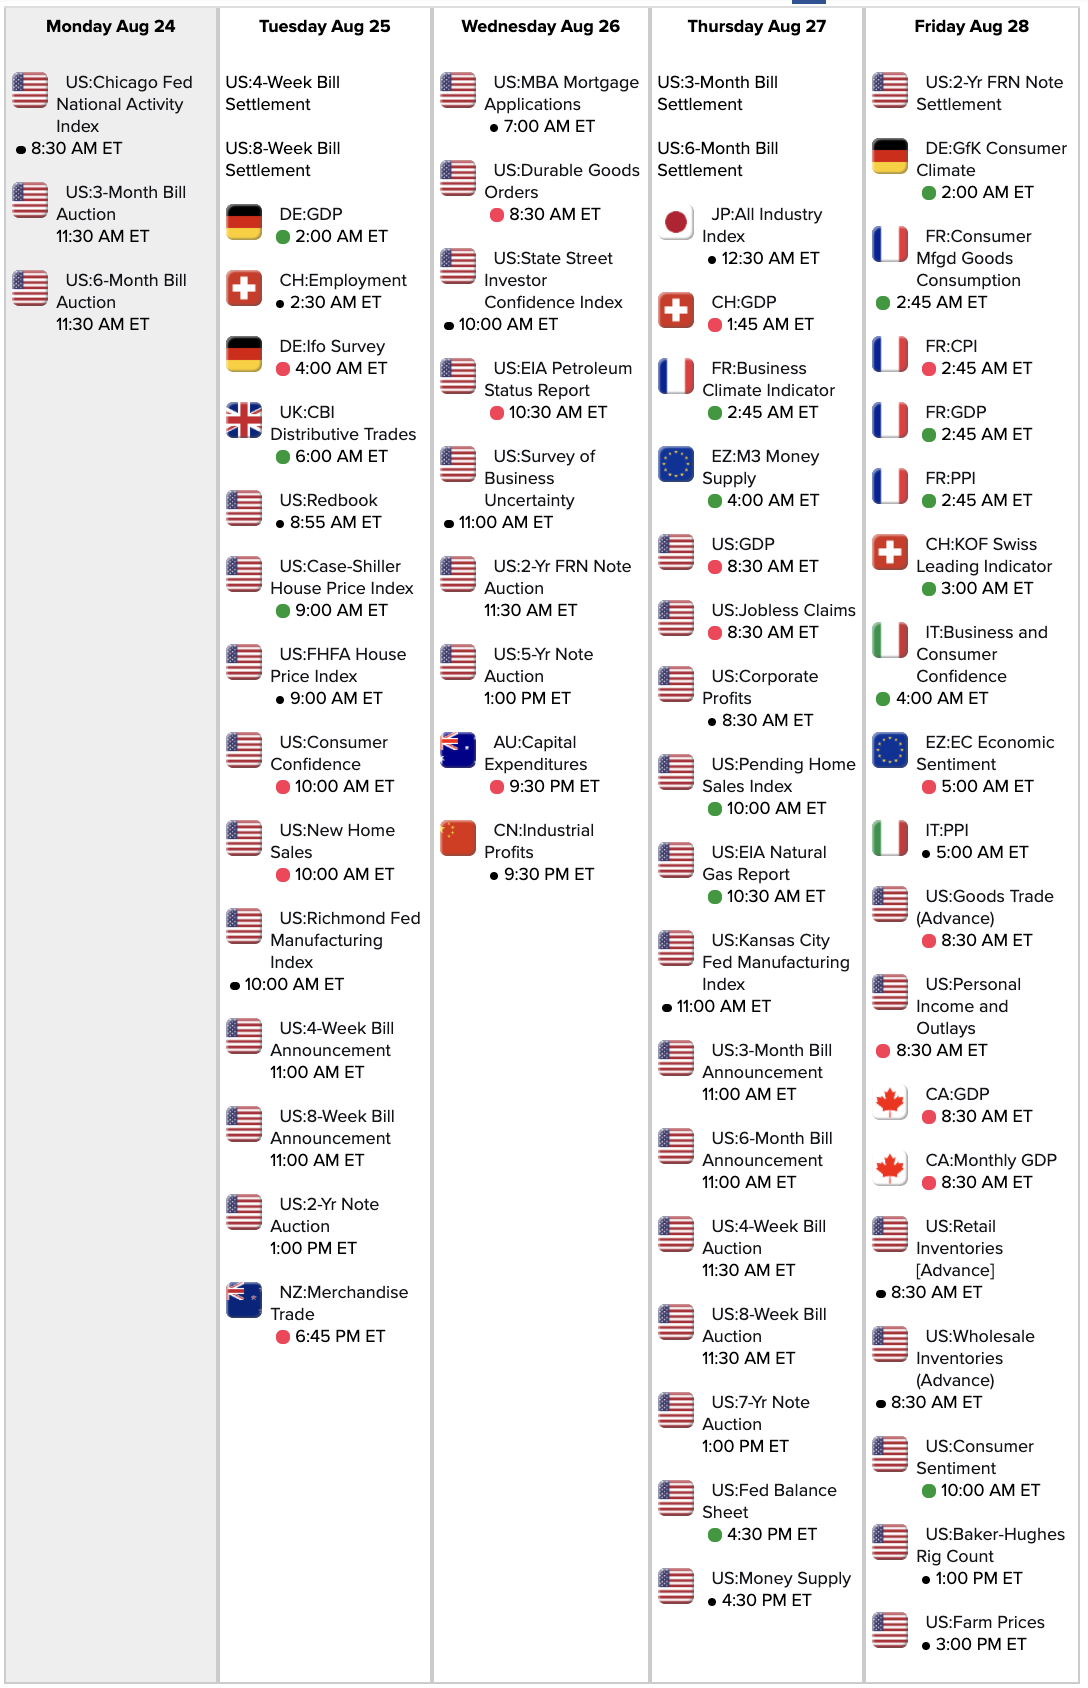

Link to calendar: https://research.investors.com/economic-calendar/
FL closed
#Earnings Sold to close $FL Aug 21st 27 #LongStraddle for .75. Bought yesterday for 2.03. The only time profit was available was the open but unfortunately I was not paying close enough attention.
SPX trades
#SPX1dte Sold to Open $SPX Aug 21st (PM) 3315/3335-3425/3445 condors for 1.00, IV 12.74%, SPX 3390, deltas -.07, +.07.
FL earnings analysis & trade
#Earnings $FL reports tomorrow morning. Below are details on earnings one-day moves over the last 12 quarters.
May 22, 2020 BO -8.49%
Feb. 28, 2020 BO +8.01%
Nov. 22, 2019 BO -2.91%
Aug. 23, 2019 BO -18.91%
May 24, 2019 BO -15.95%
March 1, 2019 BO +5.96%
Nov. 20, 2018 AC +14.90%
Aug. 24, 2018 BO -9.17%
May 25, 2018 BO +20.15%
March 2, 2018 BO -12.72%
Nov. 17, 2017 BO +28.16% Biggest UP
Aug. 18, 2017 BO -27.92% Biggest DOWN
Avg (+ or -) 14.44%
Bias -1.57%, negative bias on earnings.
With stock at 27.15 the data suggests these ranges:
Based on current IV (expected move into Friday per TOS): 25.04 to 29.26 (+/- 7.8%)
Based on AVERAGE one-day move over last 12 quarters: 23.23 to 31.07
Based on MAXIMUM one-day move over last 12 Q’s (28.2%): 19.50 to 34.80
Based on DOWN max only (-27.9%): 19.57
Open to requests for other symbols.
DE earnings analysis
#Earnings $DE reports tomorrow morning. Below are details on earnings one-day moves over the last 12 quarters.
May 22, 2020 BO -1.47%
Feb. 21, 2020 BO +6.99% Biggest UP
Nov. 27, 2019 BO -4.29%
Aug. 16, 2019 BO +3.84%
May 17, 2019 BO -7.65% Biggest DOWN
Feb. 15, 2019 BO -2.11%
Nov. 21, 2018 BO +2.42%
Aug. 17, 2018 BO +2.35%
May 18, 2018 BO +5.74%
Feb. 16, 2018 BO +1.57%
Nov. 22, 2017 BO +4.32%
Aug. 18, 2017 BO -5.37%
Avg (+ or -) 4.01%
Bias 0.53%, positive bias on earnings.
With stock at 191.00 the data suggests these ranges:
Based on current IV (expected move into Friday per TOS): 183.41 to 198.59 (+/- 4.0%)
Based on AVERAGE one-day move over last 12 quarters: 183.34 to 198.66
Based on MAXIMUM one-day move over last 12 Q’s (-7.7%): 176.39 to 205.61
Based on UP max only (+7.0%): 204.35
Open to requests for other symbols.
NVDA closed
#Earnings BTC $NVDA 455/460-525/530 iron condors for .20. Sold yesterday for 1.70.
SPX 7-dte
#SPX7dteLong Bought to Oen $SPX Aug 26th 3340/3360-3370/3390 condors for 16.00, with SPX at 3363.
SPX dead zone
#SPX7dte First time I’ve ended in the dead zone of one of these long condors. Got a dollar for the put side this morning but zero for the call side. My mistake was forgetting the Fed minutes were today, which meant I should have closed with a small profit before 2pm ET. Loss of 14.80.
SPX 7-dte
#SPX7dteLong Sold to close $SPX Aug 19th 3370/3350 put spreads for 1.00. Banking on the call side for my expiration profit. Condors bought last Thursday for 15.80.
NVDA IC
#Earnings Sold to Open $NVDA Aug 21st 455/460-525/530 iron condors for 1.70, with stock at 487.30.
I’m ignoring the -18% outlier and going just outside the remaining max moves.
BABA earnings analysis
#Earnings $BABA reports tomorrow morning. Below are details on earnings one-day moves over the last 12 quarters.
May 22, 2020 BO -5.87%
Feb. 13, 2020 BO -1.76%
Nov. 1, 2019 BO -0.11%
Aug. 15, 2019 BO +3.02%
May 15, 2019 BO +1.57%
Jan. 30, 2019 BO +6.33% Biggest UP
Nov. 2, 2018 BO -2.41%
Aug. 23, 2018 BO -3.15%
May 4, 2018 BO +3.52%
Feb. 1, 2018 BO -5.90% Biggest DOWN
Nov. 2, 2017 BO -0.68%
Aug. 17, 2017 BO +2.77%
Avg (+ or -) 3.09%
Bias -0.22%, no significant bias on earnings.
With stock at 258.00 the data suggests these ranges:
Based on current IV (expected move into Friday per TOS): 244.69 to 271.31 (+/- 5.2%)
Based on AVERAGE one-day move over last 12 quarters: 250.03 to 265.97
Based on MAXIMUM one-day move over last 12 Q’s (6.3%): 241.67 to 274.33
Based on DOWN max only (-5.9%): 242.78
Open to requests for other symbols.
NVDA earnings analysis
#Earnings $NVDA reports tonight. Below are details on earnings one-day moves over the last 12 quarters.
May 21, 2020 AC +2.86%
Feb. 13, 2020 AC +7.02%
Nov. 14, 2019 AC -2.66%
Aug. 15, 2019 AC +7.25% Biggest UP
May 16, 2019 AC -2.28%
Feb. 14, 2019 AC +1.81%
Nov. 15, 2018 AC -18.75% Biggest DOWN
Aug. 16, 2018 AC -4.90%
May 10, 2018 AC -2.15%
Feb. 8, 2018 AC +6.69%
Nov. 9, 2017 AC +5.26%
Aug. 10, 2017 AC -5.32%
Avg (+ or -) 5.58%
Bias -0.43%, small negative bias on earnings.
With stock at 488.00 the data suggests these ranges:
Based on current IV (expected move into Friday per TOS): 454.74 to 521.26 (+/- 6.8%)
Based on AVERAGE one-day move over last 12 quarters: 460.77 to 515.23
Based on MAXIMUM one-day move over last 12 Q’s (-18.8%): 396.50 to 579.50
Based on UP max only (+7.3%): 523.38
Open to requests for other symbols.
SPX 1-dte
#SPX1dte Sold to Open $SPX Aug 19th 3315/3335-3425/3445 condors for .90, IV 12.12%, SPX 3390, deltas: -.06,+.07
SPX 7 dte
#SPX7dte Bought to Open $SPX Aug 24th 3365/3385-3395/3415 condors for 15.05, with SPX at 3391. These are getting riskier with lowering VIX and consolidation, but they are also getting cheaper.
WMT & KSS closed
#Earnings Sold to close $WMT 21Aug/28Aug 135 #DoubeCalendars for 1.612. Bought yesterday for .942.
Sold to close $KSS Aug 21`st 124 puts for 3.50. Bought yesterday for 1.70.
Excellent open for both trades.
SPX trades
WMT earnings analysis & trade
#Earnings $WMT reports tomorrow morning. Below are details on earnings one-day moves over the last 12 quarters.
May 19, 2020 BO -2.12%
Feb. 18, 2020 BO +1.47%
Nov. 14, 2019 BO -0.27%
Aug. 15, 2019 BO +6.11%
May 16, 2019 BO +1.43%
Feb. 19, 2019 BO +2.21%
Nov. 15, 2018 BO -1.96%
Aug. 16, 2018 BO +9.33%
May 17, 2018 BO -1.90%
Feb. 20, 2018 BO -10.17% Biggest DOWN
Nov. 16, 2017 BO +10.89% Biggest UP
Aug. 17, 2017 BO -1.58%
Avg (+ or -) 4.12%
Bias 1.12%, positive bias on earnings.
With stock at 135.00 the data suggests these ranges:
Based on current IV (expected move into Friday per TOS): CANNOT ACCESS
Based on AVERAGE one-day move over last 12 quarters: 129.44 to 140.56
Based on MAXIMUM one-day move over last 12 Q’s (+10.9%): 120.30 to 149.70
Based on DOWN max only (-10.2%): 121.27
Open to requests for other symbols.
KSS puts
#Earnings Order in to Buy to Open $KSS Aug 21st 24 puts for 1.50, with stock at 23.80. Breakeven at 22.50, which is -5.5% OTM. Strongly negative history, and also Covid. It’s possible negative already baked in and we could see a pop higher, but I’ll also have until Friday for that to fade.
Not filled yet… will raise my bid if necessary before the close.
KSS earnings analysis
#Earnings $KSS reports tomorrow morning. Below are details on earnings one-day moves over the last 12 quarters.
May 19, 2020 BO -7.65%
March 3, 2020 BO -2.62%
Nov. 19, 2019 BO -19.48% Biggest DOWN
Aug. 20, 2019 BO -6.88%
May 21, 2019 BO -12.33%
March 5, 2019 BO +7.31% Biggest UP
Nov. 20, 2018 BO -9.22%
Aug. 21, 2018 BO +1.71%
May 22, 2018 BO -7.42%
March 1, 2018 BO -5.05%
Nov. 9, 2017 BO +0.93%
Aug. 10, 2017 BO -5.79%
Avg (+ or -) 7.20%
Bias -5.54%, strong negative bias on earnings.
With stock at 23.20 the data suggests these ranges:
Based on current IV (expected move into Friday per TOS): CANNOT ACCESS
Based on AVERAGE one-day move over last 12 quarters: 21.53 to 24.87
Based on MAXIMUM one-day move over last 12 Q’s (-19.5%): 18.68 to 27.72
Based on UP max only (+7.3%): 24.90
NOTE: 5-day maximum DOWN is the same, while max UP is less, meaning 5-day performance is even more negative for KSS.
Open to requests for other symbols.
SPX 7-dte
#SPX7dteLong Bought to Open $SPX Aug 21st 3360/3380-3390/3410 condors for 15.20, with SPX at 3382. Lowest price I have paid in this strategy. But if we are going to consolidate near the 3400 level the exits will get tricky.
ThinkorSwim slow?
Anyone else having issues with TOS being slow or nonfunctional this morning?
Earnings expirations
#Earnings
$BIDU and $AMAT iron condors sold yesterday both expired worthless.
SPX trades
#SPX1dte Sold to Open $SPX Aug 17th 3290/3310-3410/3430 condors for 1.00, IV 9.35%, SPX close: 3372, deltas: -.07,+.07. Exact same strikes and premium as today’s expiration. Filled 11 minutes after the bell.
Expiring: Aug 14th 3290/3310-3410/3430 condors, sold yesterday for 1.00
#SPX7dte Waiting until Monday morning to buy the Aug 21st spread
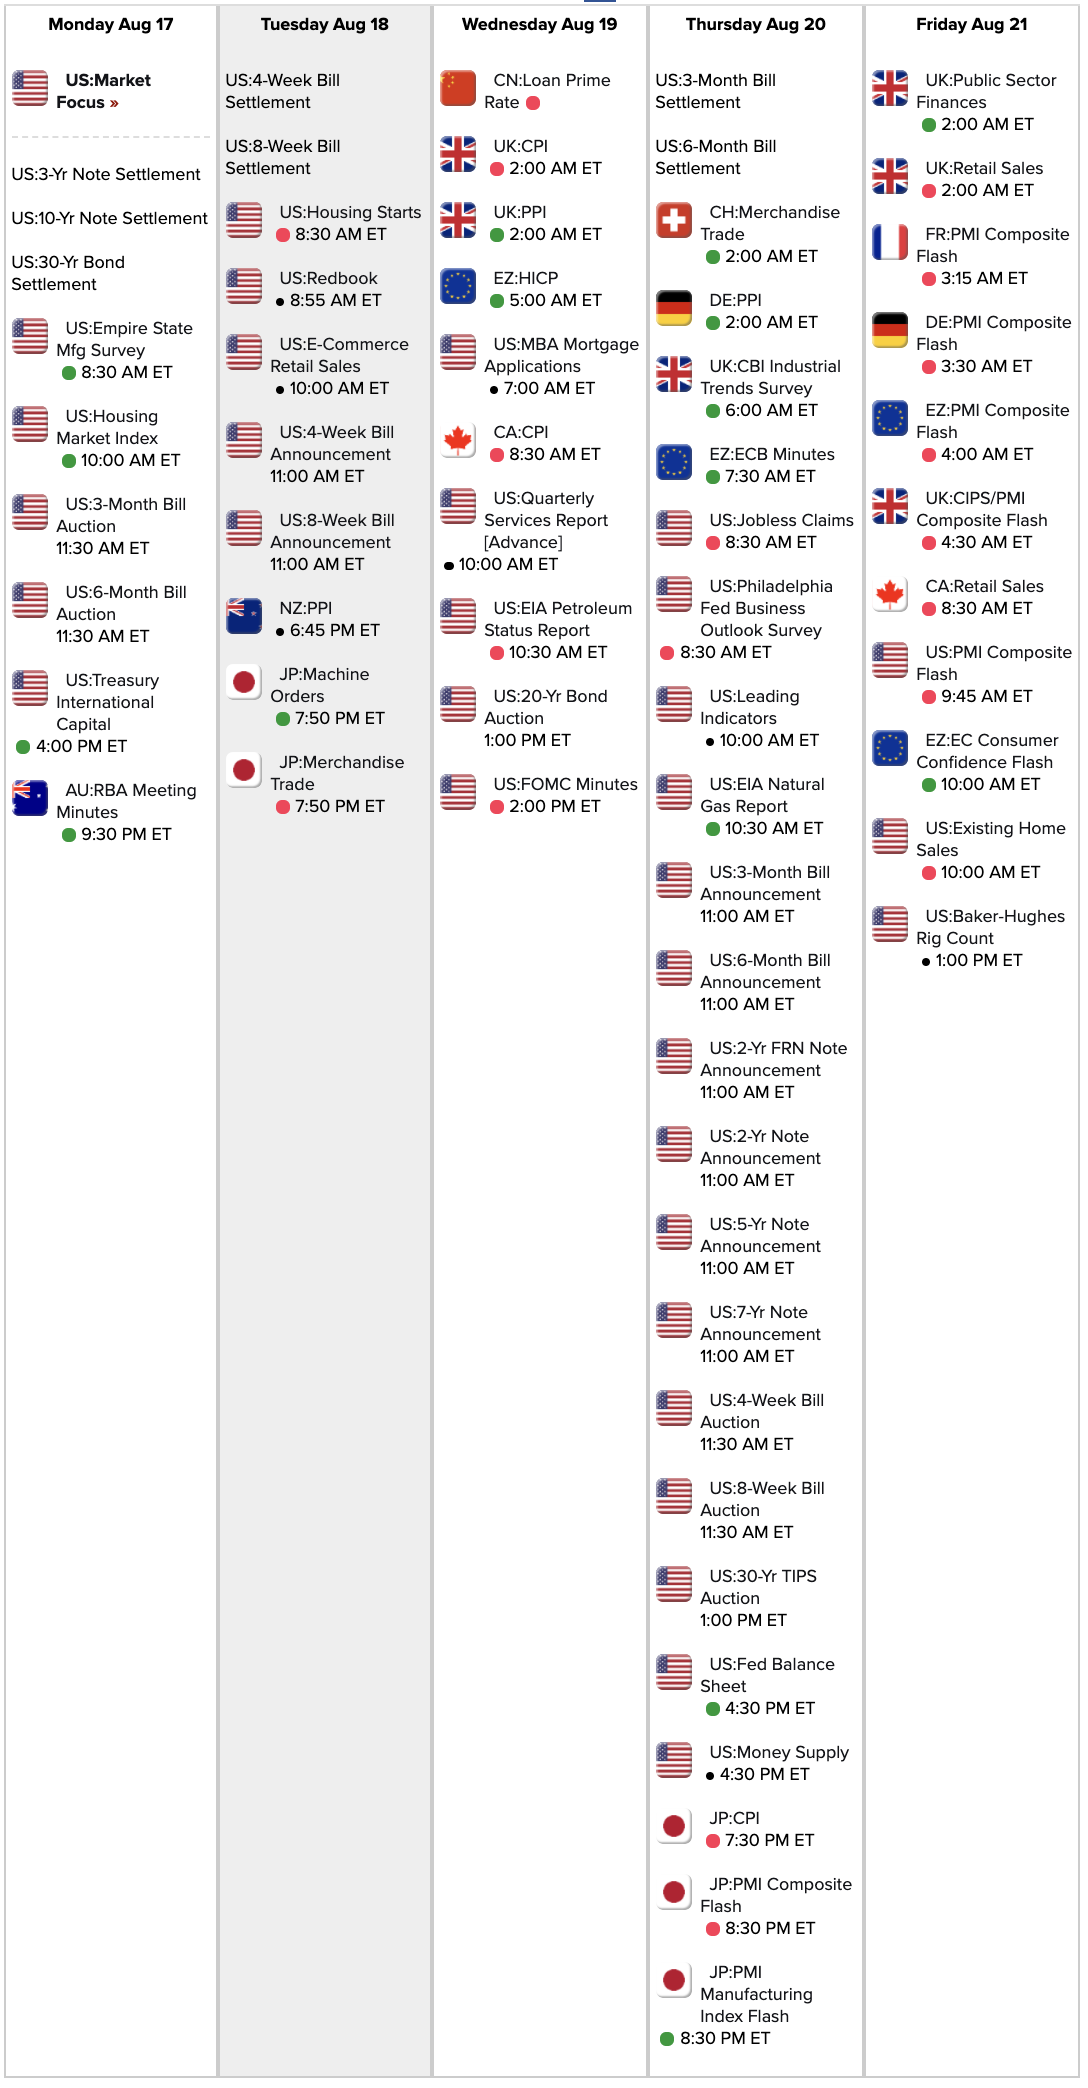
Econ Calendar for week of 8/17/20
SPX 1dte
#SPX1dte Sold to Open $SPX Aug 14th 3290/3310-3410/3430 condors for 1.00, IV 14.1%, SPX 3373, deltas, -.06, +.07
SPX 7-dte
#SPX7dteLong Sold to close $SPX Aug 14th 3335/3315 put spreads for 1.35. Planning to close the call side today as well, but looking for a higher close.
Condors bought last Friday for 16.30. If we get a down open tomorrow this one will be flirting with the danger zone, so getting out today.
AMAT IC
#Earnings Same story here, looking for an average or less move, low risk. This one leans bullish because I set it when the stock was closer to 66.00. Only partial fill so far:
Sold to Open $AMAT Aug 14th 62/63-69/70 iron condors for .42
BIDU IC
#Earnings. Sold to Open $BIDU Aug 14th 114/116-134/136 iron condors for .60. Looking for a move at the average or less.
AMAT earnings analysis
#Earnings $AMAT reports tonight. Below are details on earnings one-day moves over the last 12 quarters.
May 14, 2020 AC -4.39%
Feb. 12, 2020 AC +3.05%
Nov. 14, 2019 AC +8.95% Biggest UP
Aug. 15, 2019 AC -1.12%
May 16, 2019 AC +2.49%
Feb. 14, 2019 AC -3.95%
Nov. 15, 2018 AC +1.08%
Aug. 16, 2018 AC -7.71%
May 17, 2018 AC -8.24% Biggest DOWN
Feb. 14, 2018 AC +3.89%
Nov. 16, 2017 AC -2.33%
Aug. 17, 2017 AC +2.73%
Avg (+ or -) 4.16%
Bias -0.46%, negative bias on earnings.
With stock at 125.00 the data suggests these ranges:
Based on current IV (expected move into Friday per TOS): 62.49 to 69.51 (+/- 5.3%)
Based on AVERAGE one-day move over last 12 quarters: 63.25 to 68.75
Based on MAXIMUM one-day move over last 12 Q’s (9.0%): 60.09 to 71.91
Based on DOWN max only (-8.2%): 60.56
Open to requests for other symbols.
BIDU earnings analysis
#Earnings $BIDU reports tonight. Below are details on earnings one-day moves over the last 12 quarters.
May 18, 2020 AC +2.00%
Feb. 27, 2020 AC +0.05%
Nov. 6, 2019 AC +13.51% Biggest UP
Aug. 19, 2019 AC +4.31%
May 16, 2019 AC -16.51% Biggest DOWN
Feb. 21, 2019 AC -2.70%
Oct. 30, 2018 AC +3.64%
July 31, 2018 AC -7.73%
April 26, 2018 AC +5.54%
Feb. 13, 2018 AC +4.56%
Oct. 26, 2017 AC -8.15%
July 27, 2017 AC +9.45%
Avg (+ or -) 6.51%
Bias 0.66%, positive bias on earnings.
With stock at 125.00 the data suggests these ranges:
Based on current IV (expected move into Friday per TOS): 115.84 to 134.16 (+/- 7.3%)
Based on AVERAGE one-day move over last 12 quarters: 116.86 to 133.14
Based on MAXIMUM one-day move over last 12 Q’s (16.5%): 104.36 to 145.64
Based on UP max only (+13.5%): 141.89
Open to requests for other symbols.
SPX 7-dte (or maybe 6-dte)
#SPX7dteLong Bought to Open $SPX Aug 19th 3350/3370-3380/3400 condors for 15.80, with SPX at 3378.
SPX trades
#SPX1dte BTC $SPX Aug 12th 3390/3410 call spreads for .25. Not risking the small chance of a volatile close. Condors sold yesterday for 1.30.
Not buying a #SPX7dteLong today… going to buy it in the morning, which seems to save me about a buck in price.
Expiring: Aug 12th 3350/3350 call spreads for 20.00 max credit. Condors bought last Thursday morning for 15.80.
NTES earnings analysis
#Earnings $NTES reports tonight. Below are details on earnings one-day moves over the last 12 quarters.
May 19, 2020 AC -1.35%
Feb. 26, 2020 AC -6.91%
Nov. 20, 2019 AC +2.28%
Aug. 7, 2019 AC +10.26% Biggest UP
May 15, 2019 AC +6.51%
Feb. 20, 2019 AC -5.88%
Nov. 14, 2018 AC +5.31%
Aug. 8, 2018 AC -10.96% Biggest DOWN
May 16, 2018 AC -7.45%
Feb. 7, 2018 AC -6.27%
Nov. 15, 2017 AC +7.85%
Aug. 9, 2017 AC -9.77%
Avg (+ or -) 6.73%
Bias -1.37%, negative bias on earnings.
With stock at 473.00 the data suggests these ranges:
Based on current IV (expected move into Friday per TOS): 445.25 to 500.75 (+/- 5.9%)
Based on AVERAGE one-day move over last 12 quarters: 441.15 to 504.85
Based on MAXIMUM one-day move over last 12 Q’s (11.0%): 421.16 to 524.84
Based on UP max only (+10.3%): 521.53
Open to requests for other symbols.
PLUG play
#Speculation This one is waking up after a long dormancy and Cramer was talking it up this morning.
Bought to Open $PLUG Jan 2021 20 calls for .80, when stock dipped to 10.11.
SPX 1-dte
#SPX1dte Sold to Open $SPX Aug 12th 3225/3245-3390/3410 condors for 1.30, IV 19.8%, SPX 3338, deltas: -.07,+.07
SPX trades
#SPX7dteLong Bought to Open $SPX Aug 17th 3335/3355-3365/3385 condors for 16.05, with SPX at 3360.
Expiring: Aug 10th 3300/3320 call spreads for max credit of 20.00. Condors bought last Monday for 16.65.
#SPX1dte Expiring: Aug 10th 3255/3275-3395/3415 condors, sold Friday for 1.10
Earnings fail
#Earnings. Lost 1.25 on my $YELP supposed-to-be-Straddle but ended up being only a long call. Sure enough, I got the direction wrong.
SPX 1-dte
#SPX1dte Sold to Open $SPX Aug 10th 3255/3275-3395/3415 condors for 1.10, with SPX at 3350. IV 11.24%, ∆ -.06,+.06
Expiring: Aug 7th #RiskReversal 3290/3270 put credits spreads & 3390/3405 call debit spreads. Keeping credit of .20.
SPX 7-dte
#SPX7dteLong Bought to Open $SPX Aug 14th 3315/3335-3345/3365 condors for 16.30, with SPX at 3342.
Expiring: Aug 7th 3165/3185 call spreads for 20.00 DEBIT. This is the one I sold last Friday , but never had a chance to take profit as index only moved up since then. Sold last Friday for 18.95, closed puts for .05, so total loss 1.10.
July Jobs Reports
#Jobs — an increase that sightly beats expectations.
Gain of +1,763,000 non-farm payroll jobs, vs. expected 1.48M gain
Unemployment at 10.2%, down by 0.9%, vs. expected 10.6%
U6 unemployment at 16.5%, down by 1.5%
Labor force participation 61.4%, down by 0.1%
Average hourly earnings up 0.2%.
June jobs revised down by -9K
May jobs revised upward by +26K
SPX 1-dte
#SPX1dte Since we have another #Jobs report tomorrow I’m going with a #RiskReversal for the upside.
Sold to Open $SPX Aug 7th 3290/3270 put spreads
Bought to Open Aug 7th 3390/3405 call spreads
Total credit: .20
IV: 16.27%, short put ∆ -.10, long call ∆ +.05
SPX 7dte
#SPX7dteLong Bought to Open $SPX Aug 12th 3320/3340-3350/3370 condors for 15.80 with SPX at 3347. I didn’t buy the ATM spread yesterday because it was going for over 19.00. Wait one day and now it is the cheapest I’ve ever gotten on this strategy. Does this mean I should always wait for 6 days out rather than 7?
Also, BTC $SPX Aug 7th 3155/3135 put spreads for .05. This is for the lottery ticket chance of a major down day tomorrow, allowing me to close the call side for a profit without worrying about the put side. Condors SOLD last Friday for 18.95.
YELP earnings analysis
#Earnings $YELP reports tonight. Below are details on earnings one-day moves over the last 12 quarters.
May 7, 2020 AC +2.35%
Feb. 13, 2020 AC -3.47%
Nov. 7, 2019 AC +15.43%
Aug. 8, 2019 AC +5.20%
May 9, 2019 AC -14.37%
Feb. 13, 2019 AC -0.70%
Nov. 8, 2018 AC -26.59% Biggest DOWN
Aug. 8, 2018 AC +26.65%
May 10, 2018 AC -7.81%
Feb. 7, 2018 AC -14.04%
Nov. 1, 2017 AC -0.10%
Aug. 3, 2017 AC +27.66% Biggest UP
Avg (+ or -) 12.03%
Bias 0.85%, slightly positive bias on earnings.
With stock at 27.00 the data suggests these ranges:
Based on current IV (expected move into Friday per TOS): 24.15 to 29.85 (+/- 10.6%)
Based on AVERAGE one-day move over last 12 quarters: 23.75 to 30.25
Based on MAXIMUM one-day move over last 12 Q’s (27.7%): 19.53 to 34.47
Based on DOWN max only (-26.6%): 19.82
Open to requests for other symbols.
SPX trades
#SPX7dteLong I am not buying a spread for next Wednesday because, like last Friday, it is going for over 19.00. I don’t know why this is, as I was able to buy Monday’s spread for only 16.65, which is perhaps the least I have ever paid. I SOLD one on Friday, but that spread will be a loss unless we drop into Friday’s close. Friday is the unemployment report for July, so it could be a wild day.
Expired: $SPX Aug 5th 3245/3265 call spreads for max credit of 20.00. Condors bought last Wednesday for 16.85.
#SPX1dte Expiring: Aug 5th 3220/3240-3345/3365 condors, sold yesterday for .85.
ROKU earnings analysis
#Earnings $ROKU reports tonight. Below are details on earnings one-day moves over the last 11 quarters, representing its entire history of earnings reports.
May 7, 2020 AC -7.88%
Feb. 13, 2020 AC -6.32%
Nov. 6, 2019 AC -16.01%
Aug. 7, 2019 AC +20.85%
May 8, 2019 AC +28.11%
Feb. 21, 2019 AC +25.23%
Nov. 7, 2018 AC -22.29% Biggest DOWN
Aug. 8, 2018 AC +21.31%
May 9, 2018 AC -1.71%
Feb. 21, 2018 AC -17.71%
Nov. 8, 2017 AC +54.93% Biggest UP
Avg (+ or -) 20.21%
Bias 7.14%, positive bias on earnings.
With stock at 166.00 the data suggests these ranges:
Based on current IV (expected move into Friday per TOS): 146.03 to 185.97 (+/- 12.0%)
Based on AVERAGE one-day move over last 12 quarters: 132.45 to 199.55
Based on MAXIMUM one-day move over last 12 Q’s (54.9%): 74.82 to 257.18
Based on DOWN max only (-22.3%): 129.00
Open to requests for other symbols.
WDC earnings analysis
#Earnings $WDC reports tonight. Below are details on earnings one-day moves over the last 12 quarters.
April 30, 2020 AC -12.15%
Jan. 30, 2020 AC -2.18%
Oct. 30, 2019 AC -16.90%
July 31, 2019 AC +3.00%
April 29, 2019 AC +1.28%
Jan. 24, 2019 AC +7.52% Biggest UP
Oct. 25, 2018 AC -18.18% Biggest DOWN
July 26, 2018 AC -7.73%
April 26, 2018 AC -7.99%
Jan. 25, 2018 AC +1.82%
Oct. 26, 2017 AC -2.53%
July 27, 2017 AC -7.54%
Avg (+ or -) 7.40%
Bias -5.13%, strongly negative bias on earnings.
With stock at 45.00 the data suggests these ranges:
Based on current IV (expected move into Friday per TOS): 41.39 to 48.61 (+/- 8.0%)
Based on AVERAGE one-day move over last 12 quarters: 41.67 to 48.33
Based on MAXIMUM one-day move over last 12 Q’s (18.2%): 36.82 to 53.18
Based on UP max only (+7.5%): 48.38
Open to requests for other symbols.
Square up
#Earnings “Square reported numbers a day earlier than expected after a media outlet leaked them.” $SQ
https://www.cnbc.com/2020/08/04/square-sq-earnings-q2-2020.html
SPX 1-dte
#SPX1dte Sold to Open $SPX Aug 5th 3220/3240-3345/3365 condors for .85, IV 13.91%, SPX 3299, deltas -.06,+.06
DIS earnings analysis
#Earnings $DIS reports tonight. Below are details on earnings one-day moves over the last 12 quarters.
May 5, 2020 AC -0.17%
Feb. 4, 2020 AC -2.32%
Nov. 7, 2019 AC +3.76% Biggest UP
Aug. 6, 2019 AC -4.94% Biggest DOWN
May 8, 2019 AC -1.03%
Feb. 5, 2019 AC -1.10%
Nov. 8, 2018 AC +1.72%
Aug. 7, 2018 AC -2.21%
May 8, 2018 AC -1.78%
Feb. 6, 2018 AC -1.32%
Nov. 9, 2017 AC +2.04%
Aug. 8, 2017 AC -3.87%
Avg (+ or -) 2.19%
Bias -0.94%, negative bias on earnings.
With stock at 117.50 the data suggests these ranges:
Based on current IV (expected move into Friday per TOS): 111.05 to 123.95 (+/- 5.5%)
Based on AVERAGE one-day move over last 12 quarters: 114.93 to 120.07
Based on MAXIMUM one-day move over last 12 Q’s (4.9%): 111.70 to 123.30
Based on UP max only (+3.8%): 121.92
Open to requests for other symbols.
SPX 7-dte
#SPX7dteLong Bought to Open $SPX Aug 10th 3270/3290-3300/3320 condors for 16.65, with SPX at 3293.
Expiring: Aug 3rd 3245/3265 call spreads for max credit of 20.00. Condors bought last Monday for 17.05.
SPX 1-dte
#SPX1dte Bought to close $SPX Aug 3rd 3310/3330 call spreads for .40. Condors sold for 1.10 on Friday. Stop was hit at the open but was able to wait for low cost exit.
Episode 12 – Adda Girl
Charlize Theron and pals cheat death, Tom Hanks navigates a deadly game of chess, and could it be that grandma is possessed? Michelle Staley Mahony joins Kevin & Jeff with New Music Picks, streaming picks, plus a video exclusive: “Guess the 80’s music video”. More details, the video, playlists and links at https://thepickcast.com
Econ Calendar for week of 8/3/20

Earnings expirations
#Earnings. Breaking alm ost even as these both expire:
$NOW July 31st 425/420 put spread, sold Wednesday for 1.40.
$AMZN July 31st 3050/3080/3110 Iron Butterfly, sold yesterday for 28.45, so loss of 1.55
SPX trades
#SPX7dteLong Although NOT long this time. When setting up this trade it was going for 19.00… the most I ever paid was about 18.40. I don’t know why it is so expensive but I’m guessing it’s because next Friday is the jobs report. So, I sold it instead. I will watch all week to look for an exit… I will not be waiting for the miniscule chance of a big win next Friday.
Sold to Open $SPX Aug 7th 3235/3255-3265/3285 condors for 18.95, with SPX at 3260.
#SPX1dte Sold to Open $SPX Aug 3rd 3165/3185-3310/3330 condors for 1.05, with SPX at 3260. IV 11.95%, deltas -.06,+.06
SPX 7-dte
#SPX7dteLong This is the fourth trade in a row for this strategy where I’ve been faced with the danger zone at expiration. I have to make a choice as to whether we are going to finish the day higher or lower, and I chose lower. I am, however, notorious for making the wrong choice in these spots. So look for a higher close!
Sold to close $SPX July 31st 3215/3235 call spreads for 12.20. Already looking like I’m wrong as we have a small spike higher and this can be closed for a lot more now. Condors bought last Friday for 17.55. Looking for a further move down so I can close the put side for a decent credit. If I’m wrong then my loss is locked in.
SPX 1-dte
#SPX1dte Sold to Open $SPX July 31st 3140/3160-3300/3320 condors for 1.25, IV 20.24%, SPX 3243, ∆ -.07,+.06
AMZN target practice
#Earnings Sold to Open $AMZN July 31st 3050/3080/3110 #IronButterfly for 28.45. Risking 1.55 to make up to 28.00 if AMZN ends tomorrow near 3080, or if it swings wildly and passes through the 3080 area. I’ve done this trade many times and paid for the losses by winning two or three times. Doesn’t always sell for this much; 28+ is a good price. But to be clear, probability is highest that it will expire with one side deep ITM , which means a 30.00 debit (thus the 1.55 loss).
AMZN earnings analysis
#Earnings $AMZN reports tonight. Below are details on earnings one-day moves over the last 12 quarters.
April 30, 2020 AC -7.59%
Jan. 30, 2020 AC +7.37%
Oct. 24, 2019 AC -1.09%
July 25, 2019 AC -1.55%
April 25, 2019 AC +2.54%
Jan. 31, 2019 AC -5.38%
Oct. 25, 2018 AC -7.81% Biggest DOWN
July 26, 2018 AC +0.51%
April 26, 2018 AC +3.60%
Feb. 1, 2018 AC +2.87%
Oct. 26, 2017 AC +13.21% Biggest UP
July 27, 2017 AC -2.48%
Avg (+ or -) 4.67%
Bias 0.35%, tiny positive bias on earnings.
With stock at 3020.00 the data suggests these ranges:
Based on current IV (expected move into Friday per TOS): 3197.00 to 3551.00 (+/- 6.5%)
Based on AVERAGE one-day move over last 12 quarters: 2879.07 to 3160.93
Based on MAXIMUM one-day move over last 12 Q’s (13.2%): 2621.06 to 3418.94
Based on DOWN max only (-7.8%): 2784.14
Open to requests for other symbols.
AAPL earnings analysis
#Earnings $AAPL reports tonight. Below are details on earnings one-day moves over the last 12 quarters.
April 30, 2020 AC -1.60%
Jan. 28, 2020 AC +2.09%
Oct. 30, 2019 AC +2.26%
July 30, 2019 AC +2.04%
April 30, 2019 AC +4.90%
Jan. 29, 2019 AC +6.83% Biggest UP
Nov. 1, 2018 AC -6.63% Biggest DOWN
July 31, 2018 AC +5.89%
May 1, 2018 AC +4.41%
Feb. 1, 2018 AC -4.33%
Nov. 2, 2017 AC +2.61%
Aug. 1, 2017 AC +4.72%
Avg (+ or -) 4.03%
Bias 1.93%, positive bias on earnings.
With stock at 376.00 the data suggests these ranges:
Based on current IV (expected move into Friday per TOS): 351.44 to 400.56 (+/- 6.5%)
Based on AVERAGE one-day move over last 12 quarters: 360.86 to 391.14
Based on MAXIMUM one-day move over last 12 Q’s (6.8%): 350.32 to 401.68
Based on DOWN max only (-6.6%): 351.07
Open to requests for other symbols.
FB earnings analysis
#Earnings $FB reports tonight. Below are details on earnings one-day moves over the last 12 quarters.
April 29, 2020 AC +5.41%
Jan. 29, 2020 AC -6.13%
Oct. 30, 2019 AC +1.80%
July 24, 2019 AC -1.93%
April 24, 2019 AC +5.84%
Jan. 30, 2019 AC +10.81% Biggest UP
Oct. 30, 2018 AC +3.80%
July 25, 2018 AC -18.96% Biggest DOWN
April 25, 2018 AC +9.06%
Jan. 31, 2018 AC +3.31%
Nov. 1, 2017 AC -2.04%
July 26, 2017 AC +2.91%
Avg (+ or -) 6.00%
Bias 1.16%, positive bias on earnings.
With stock at 230.00 the data suggests these ranges:
Based on current IV (expected move into Friday per TOS): 216.31 to 243.69 (+/- 6.0%)
Based on AVERAGE one-day move over last 12 quarters: 216.20 to 243.80
Based on MAXIMUM one-day move over last 12 Q’s (19.0%): 186.39 to 273.61
Based on UP max only (+10.8%): 254.86
Open to requests for other symbols.
SPX 7-dte
#SPX7dteLong Bought to open $SPX Aug 5th 3235/3255-3265/3285 condors for 16.85. with SPX at 3259.
NOW trade this
#Earnings Sold to Open $NOW July 31st 425/420 put spreads for 1.40, with stock at 441.00. Short strike is at the max negative move.
NOW earnings analysis
#Earnings $NOW reports tonight. Below are details on earnings one-day moves over the last 12 quarters.
Overwhelmingly positive response on earnings…
April 29, 2020 AC +9.17%
Jan. 29, 2020 AC +9.16%
Oct. 23, 2019 AC +8.07%
July 24, 2019 AC -3.86% the only DOWN move since Jan 2016
April 24, 2019 AC +7.41%
Jan. 30, 2019 AC +13.41% Biggest UP
Oct. 24, 2018 AC +1.42%
July 25, 2018 AC +4.60%
April 25, 2018 AC +4.53%
Jan. 31, 2018 AC +2.64%
Oct. 25, 2017 AC +1.21%
July 26, 2017 AC +0.74%
Avg (+ or -) 5.52%
Bias 4.88%, overwhelmingly positive bias on earnings.
With stock at 443.00 the data suggests these ranges:
Based on current IV (expected move into Friday per TOS): 417.67 to 468.33 (+/- 5.7%)
Based on AVERAGE one-day move over last 12 quarters: 418.55 to 467.45
Based on MAXIMUM one-day move over last 12 Q’s (13.4%): 383.59 to 502.41
Based on DOWN max only (-3.9%): 425.90
Open to requests for other symbols.
DVA earnings analysis (for tomorrow)
#Earnings $DVA reports THURSDAY after the bell. By request, here are details on earnings one-day moves over the last 12 quarters.
May 5, 2020 AC +4.41%
Feb. 10, 2020 AC +6.94%
Nov. 5, 2019 AC +12.92% Biggest UP
Aug. 1, 2019 AC +1.28%
May 7, 2019 AC -8.55%
Feb. 13, 2019 AC +0.29%
Nov. 7, 2018 AC -7.79%
Aug. 1, 2018 AC +5.34%
May 3, 2018 AC +4.86%
Feb. 13, 2018 AC +1.64%
Nov. 7, 2017 AC -7.83%
Aug. 1, 2017 AC -8.84% Biggest DOWN
Avg (+ or -) 5.89%
Bias 0.39%, small positive bias on earnings.
With stock at 90.00 the data suggests these ranges:
Based on current IV (expected move into Friday per TOS): 85.35 to 94.65 (+/- 5.2%)
Based on AVERAGE one-day move over last 12 quarters: 84.70 to 95.30
Based on MAXIMUM one-day move over last 12 Q’s (12.9%): 78.37 to 101.63
Based on DOWN max only (-8.8%): 82.04
Open to requests for other symbols.
QCOM earnings analysis
#Earnings $QCOM reports tonight. Below are details on earnings one-day moves over the last 12 quarters.
April 29, 2020 AC -0.37%
Feb. 5, 2020 AC -0.32%
Nov. 6, 2019 AC +6.32%
July 31, 2019 AC -2.67%
May 1, 2019 AC +0.89%
Jan. 30, 2019 AC -1.29%
Nov. 7, 2018 AC -8.16% Biggest DOWN
July 25, 2018 AC +7.00% Biggest UP
April 25, 2018 AC +1.44%
Jan. 31, 2018 AC -2.12%
Nov. 1, 2017 AC +2.58%
July 19, 2017 AC -4.94%
Avg (+ or -) 3.18%
Bias -0.14%, no significant bias on earnings.
With stock at 92.50 the data suggests these ranges:
Based on current IV (expected move into Friday per TOS): 87.12 to 97.88 (+/- 5.8%)
Based on AVERAGE one-day move over last 12 quarters: 89.56 to 95.44
Based on MAXIMUM one-day move over last 12 Q’s (8.2%): 84.95 to 100.05
Based on UP max only (+7.0%): 98.98
Open to requests for other symbols.
SPX trades
#SPX1dte Sold to Open $SPX July 29th 3125/3145-3265/3285 condors for 1.65, IV 18.1%, SPX 3219, deltas: -.06, +.09
#SPX7dteLong Sold to close July 29th 3270/3290 call spreads for .75… as usual, I get the direction wrong! Wanted to close up to get 3.00 or more for this.
SHOP earnings analysis
#Earnings $SHOP reports tomorrow morning. Below are details on earnings one-day moves over the last 12 quarters.
May 6, 2020 BO +6.91%
Feb. 12, 2020 BO +7.81%
Oct. 29, 2019 BO -3.81%
Aug. 1, 2019 BO +7.39%
April 30, 2019 BO +7.85%
Feb. 12, 2019 BO +1.37%
Oct. 25, 2018 BO +12.03% Biggest UP
July 31, 2018 BO -6.66%
May 1, 2018 BO -4.45%
Feb. 15, 2018 BO +0.28%
Oct. 31, 2017 BO -9.02% Biggest DOWN
Aug. 1, 2017 BO +5.77%
Avg (+ or -) 6.11%
Bias 2.12%, positive bias on earnings.
With stock at 982.00 the data suggests these ranges:
Based on current IV (expected move into Friday per TOS): 895.07 to 1068.93 (+/- 8.9%)
Based on AVERAGE one-day move over last 12 quarters: 921.98 to 1042.02
Based on MAXIMUM one-day move over last 12 Q’s (12.0%): 863.87 to 1100.13
Based on DOWN max only (-9.0%): 893.42
Open to requests for other symbols.
AMD earnings analysis
#Earnings $AMD reports tonight. Below are details on earnings one-day moves over the last 12 quarters.
April 28, 2020 AC -3.33%
Jan. 28, 2020 AC -5.97%
Oct. 29, 2019 AC +0.30%
July 30, 2019 AC -10.09%
April 30, 2019 AC -2.96%
Jan. 29, 2019 AC +19.94% Biggest UP
Oct. 24, 2018 AC -15.44% Biggest DOWN
July 25, 2018 AC +14.33%
April 25, 2018 AC +13.69%
Jan. 30, 2018 AC +6.75%
Oct. 24, 2017 AC -13.47%
July 25, 2017 AC +4.60%
Avg (+ or -) 9.24%
Bias 0.70%, small positive bias on earnings.
With stock at 69.00 the data suggests these ranges:
Based on current IV (expected move into Friday per TOS): 62.72 to 75.28 (+/- 9.1%)
Based on AVERAGE one-day move over last 12 quarters: 62.62 to 75.38
Based on MAXIMUM one-day move over last 12 Q’s (19.9%): 55. 24 to 82.76
Based on DOWN max only (-15.4%): 58.35
Open to requests for other symbols.
SPX 7-dte
#SPX7dteLong Sold to close $SPX July 29th 3260/3240 put spreads for 14.00. Condors bought last Wednesday for 16.95. Looking to avoid a possible danger zone tomorrow, and sell the call spread on a bounce.
SPX trades
#SPX7dteLong Bought to Open $SPX Aug 3rd 3215/3235-3245/3265 condors for 17.05, with SPX at 3238.
#SPX1dte Expiring: 3115/3135-3270/3290 condors, sold Friday for 1.25.
SPX 7-dte
#SPX7dteLong Sold to close $SPX July 27th 3245/3225 put spreads for 13.10. Condors bought last Monday for 16.75. Too much risk of this closing near or in the dead zone, so locking in a 3.65 loss now rather than possibly more later.

