
#SPX1dte Sold to Open $SPX Oct 2nd 3255/3275-3450/3470 iron condors for 1.40, IV 23.8%, SPX 3373, deltas -.06,+.06.
Pretty wide condor given higher volatility and premium with Jobs report in the morning.
#SPX1dte Sold to Open $SPX Oct 2nd 3255/3275-3450/3470 iron condors for 1.40, IV 23.8%, SPX 3373, deltas -.06,+.06.
Pretty wide condor given higher volatility and premium with Jobs report in the morning.
#SPX7dtelong Bought to open $SPX Oct 7th 3355/3375-3385/3405 iron condors for 17.55, with SPX at 3380.
#SPX1dte Expiring: $SPX Sept 30th 3235/3255-3415/3435 iron condors, sold yesterday for 1.20.
#SPX7dteLong In pre-market, sold to close $SPX Sept 30th 3250/3270 call spreads for 19.55. Condors bought for 17.90 last Wednesday.
#SPX7dteLong Bought to Open $SPX Oct 5th 3315/3335-3345/3365 condors for 17.50, with SPX at 3339.
#SPX1dte Sold to Open $SPX Sep 30th 3235/3255-3415/3435 condors for 1.20, IV 20.07%, SPX 3341, deltas -.05,+.06
#Earnings $MU reports tonight. Below are details on earnings one-day moves over the last 12 quarters.
June 29, 2020 AC +4.82%
March 25, 2020 AC +5.38%
Dec. 18, 2019 AC +2.80%
Sept. 26, 2019 AC -11.09% Biggest DOWN
June 25, 2019 AC +13.34% Biggest UP
March 20, 2019 AC +9.61%
Dec. 18, 2018 AC -7.91%
Sept. 20, 2018 AC -2.86%
June 20, 2018 AC +0.83%
March 22, 2018 AC -7.99%
Dec. 19, 2017 AC +4.02%
Sept. 26, 2017 AC +8.51%
Avg (+ or -) 6.60%
Bias 1.62%%, positive bias on earnings.
With stock at 51.00 the data suggests these ranges:
Based on current IV (expected move into Friday per TOS): 47.23 to 54.77 (+/- 7.4%)
Based on AVERAGE one-day move over last 12 quarters: 47.64 to 54.36
Based on MAXIMUM one-day move over last 12 Q’s (13.3%): 44.20 to 57.80
Based on DOWN max only (-11.1%): 45.34
Open to requests for other symbols.
Expiring:
#SPX1dte Sept 28th 3190/3210-3365/3385 condors, sold Friday for 1.40
#SPX7dteLong Sept 28th 3305/3325 call spreads for max credit of 20.00. Condors bought last Tuesday for 17.70.
#SPX7dteLong Bought to open $SPX Oct 2nd 3320/3340-3350/3370 iron condors for 17.30, with SPX at 3345.
#SPX1dte Sold to Open $SPX 3190/3210-3365/3385 iron condors for 1.40, IV 14.95%, SPX 3296, deltas -.07,+.06
#SPX1dte STOPPED $SPX Sept 23rd 3240/3220 put spreads for 1.55. Condors sold yesterday for 1.20
#SPX7dteLong Expiring: $SPX Sept 23rd 3335/3315 put spreads for max credit of 20.00. Condors bought last Thursday for 17.55
In our first attempt to “getaway” since this whole mess started, I will be away with the wife for two nights in a forest cabin. No internet or cell signal. We leave today after the market and will return Friday, so I will be logging in before Friday’s close to place a Monday trade. Please watch over Bistro while I’m gone!
#SPX1dte Sold to Open $SPX Sept 23rd 3220/3240-3375/3395 iron condors for 1.20, IV 18.5%, SPX 3315, deltas -.07,+.05
#SPX7dteLong Bought to Open $SPX Sept 28th 3275/3295-3305/3325 condors for 17.70, with SPX at 3298.
#SPX7dteLong Expiring today: $SPX Sept 21st 3410/3390 put spreads for max credit of 20.00. Condors bought last Tuesday for 17.35.
NOTE: I’m not buying one for this Friday’s expiration as I will be on a getaway Wednesday afternoon until Friday noon without internet.
#SPX1dte Bought to close $SPX Sept 21st 3225/3205 put spreads for 2.40. Condors sold for 1.05 on Friday.
Expected-move stop point was 3260, so I got out on the bounce after this morning’s low.
#SPX1dte Sold to Open $SPX Sept 21st 3205/3225-3390/3410 condors for 1.05
Expiring:
#SPX1dte Condor expired worthless, sold Thursday for .95
#SPX7dteLong Put side expired at full credit of 20.00, calls side sold this morning for .85, so 20.85 credit against 17.60 purchase; 3.15 profit
#Earnings $CHWY 57.5/56.5 put spreads, expire ITM for .30 loss. This was a roll but it can’t get off its ass. Walking away. Total loss on two trades: .70
#FOMC Jerome Powell scheduled to speak both Wednesday and Thursday at 10am ET
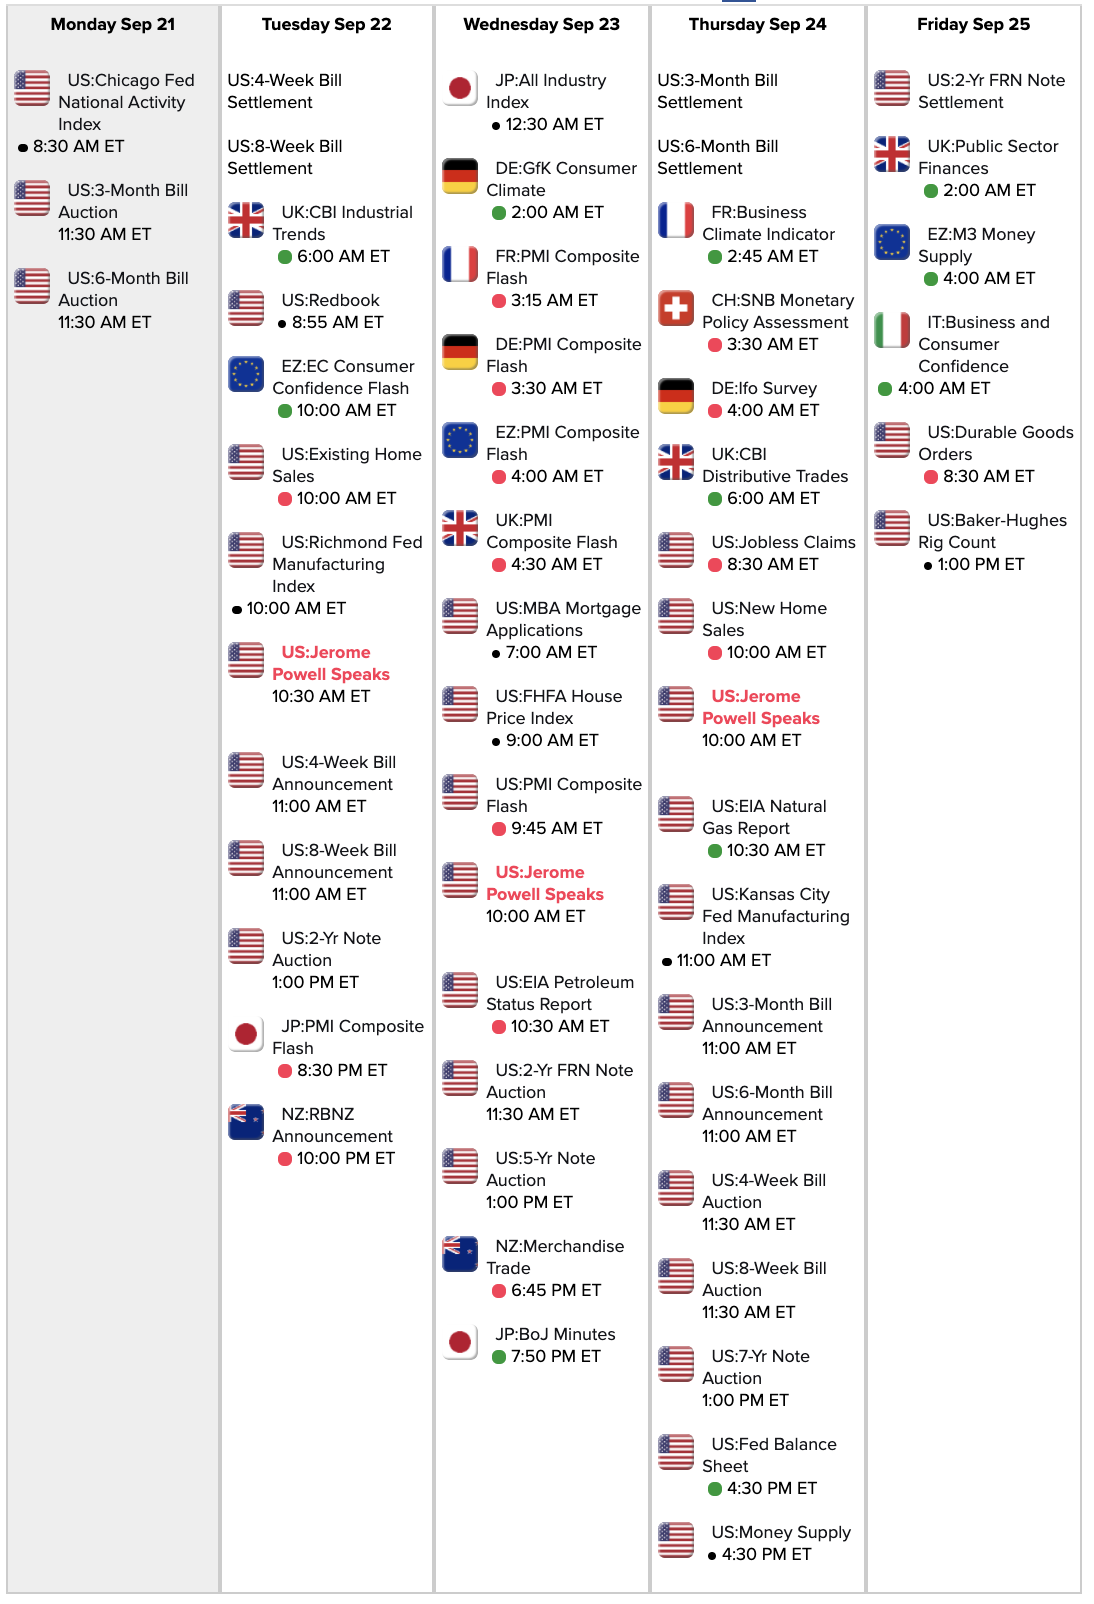

Link to calendar: https://research.investors.com/economic-calendar/
#SPX7dteLong Sold to close $SPX Sept 18th 3400/3420 call spreads for .85. Relying on the 3390/3370 put side for the big profit today. Condors bought Monday for 17.60.
#SPX1dte Sold to Open $SPX Sept 18th 3225/3245-3435/3455 condors for .95, IV 25.8%, SPX 3353, deltas -.06,+.06
#SPX7dteLong Bought to Open $SPX Sept 23rd 3315/3335-3345/3365 condors for 17.55, with SPX at 3338.
#SPX7dteLong A little stuck on today’s expiration, so going to try a leg out…
Sold to close $SPX Sep 16th 3425/3445 call spreads for 5.20.
Will look to sell puts on a swing down. I usually suck at legging out, so no high hopes.
Condors bought for 17.75 last Thursday.
#SPX1dte Sold to Open $SPX Sept 16th 3295/3315-3455/3475 condors for 1.25, IV 18.9%, SPX 3398, deltas: -.05,+.07.
#SPX7dteLong Earlier, BTO $SPX Sept 21st 3390/3410-3420/3440 condors for 17.35, with SPX at 3413.
#SPX1dte BTC $SPX Sept 14th 3415/3435 call spreads for .80. Was away with the order put in, would have ridden it lower if I could have managed it. Sold for 1.20 on Friday.
#SPX7dteLong Sold to close $SPX Sept 14 3360/3340 put spreads for 1.05. Banking on the 3370/3390 call side for close. Condors bought for 18.25 last Tuesday.
Bought to Open $SPX Sept 18th 3370/3390-3400/3420 condors for 17.60, with SPX at 3395.
#SPX1dte – watching call side for today’s short condor closely as stop level has been breached.
#SPX1dte Sold to Open $SPX Sept 14th 3205/3225-3415/3435 condors for 1.20, IV 17.07%, SPX 3341, deltas: -.06,+.06
#SPX7dteLong Sept 11th 3435/3415 put spreads expiring ITM for max credit of 20.00. Condors sold last Friday for 17.90.
(not so) Bonus trade: Sept 11th 3200/3220 call spreads expire ITM for max debit of 20.00. Sold for 17.25 last week, so loss of 2.75.
#FOMC Wednesday afternoon

Link to calendar: https://research.investors.com/economic-calendar/
Skipping the trade for tomorrow’s expiry.
#Earnings $CHWY reports tonight. Below are details on earnings one-day moves over its entire history.
A rare case where the expected move is nearly twice its historical maximum move.
June 9, 2020 AC -3.64% -3.64%
April 2, 2020 AC -4.82% -4.82%
Dec. 9, 2019 AC +5.45% 5.45%
Sept. 17, 2019 AC -6.14% -6.14%
July 18, 2019 AC -6.57% -6.57%
Avg (+ or -) 5.32%
Bias -3.14% , negative bias on earnings.
With stock at 62.00 the data suggests these ranges:
Based on current IV (expected move into Friday per TOS): 54.66 to 69.34 (+/- 11.8%)
Based on AVERAGE one-day move over last 5 quarters: 58.70 to 65.30
Based on MAXIMUM one-day move over last 5 Q’s (6.6%): 57.93 to 66.07
Based on UP max only (+5.5%): 65.38
Open to requests for other symbols.
#SPX7dte Bought to Open $SPX Sept 16th 3395/3415-3425/3445 condors for 17.75, with SPX at 3419.
#Earnings Got filled on what is almost a 1/1 risk/reward, on the chance this will have a smaller than usual move.
Sold $RH Sept 11th 285/287.5-352.5/355 condors for 1.202. Strikes are 10.2% OTM, while average move has been 16.2%. But that average is skewed higher by some huge moves that haven’t happened in more recent quarters.
#SPX1dte Call side stop was touches, so BTC $SPX Sept 9th 3440/3460 call spreads for .45. Condors sold for 1.15… total closing costs .60, so profit of .55.
#SPX7dteLong Set to expire: $SPX Sept 9th 3480/3460 put spreads for max credit of 20.00. Condors bought for 17.20 last Thursday, so profit of 2.80.
#Earnings $RH reports tonight. Below are details on earnings one-day moves over the last 12 quarters.
June 4, 2020 AC -0.88%
March 30, 2020 AC -14.85%
Dec. 4, 2019 AC +13.39%
Sept. 10, 2019 AC +5.07%
June 12, 2019 AC +15.82%
March 28, 2019 AC -21.96% Biggest DOWN
Dec. 3, 2018 AC +10.90%
Sept. 4, 2018 AC -13.06%
June 11, 2018 AC +30.54%
March 27, 2018 AC +22.48%
Dec. 5, 2017 AC +0.79%
Sept. 6, 2017 AC +44.75% Biggest UP
Avg (+ or -) 16.21%
Bias 7.75%, positive bias on earnings.
With stock at 320.00 the data suggests these ranges:
Based on current IV (expected move into Friday per TOS): 279.63 to 360.37 (+/- 12.6%)
Based on AVERAGE one-day move over last 12 quarters: 268.14 to 371.86
Based on MAXIMUM one-day move over last 12 Q’s (44.8%): 176.80 to 463.20
Based on DOWN max only (-22.0%): 249.73
Open to requests for other symbols.
#SPX1dte BTC $SPX Sept 9th 3200 puts for .15. Condors sold yesterday for 1.15.
#SPX1dte Sold to Open $SPX Sept 9th 3180/3200-3440/3460 condors for 1.15, IV 31.32%, SPX 3343, deltas -.05,+.06.
Today’s condor: closed put side for .10, remainder expires.
#SPX1dte BTC $SPX Sept 8th 3260 puts for .10. Condors sold for 1.25 on Friday.
I will be selling a new one for tomorrow’s expiration.
#Earnings $LULU reports tonight. Below are details on earnings one-day moves over the last 12 quarters.
June 11, 2020 AC -3.81%
March 26, 2020 AC -5.95%
Dec. 11, 2019 AC -3.73%
Sept. 5, 2019 AC +7.81%
June 12, 2019 AC +2.12%
March 27, 2019 AC +14.12%
Dec. 6, 2018 AC -13.36% Biggest DOWN
Aug. 30, 2018 AC +13.08%
May 31, 2018 AC +16.31% Biggest UP
March 27, 2018 AC +9.21%
Dec. 6, 2017 AC +6.42%
Aug. 31, 2017 AC +7.19%
Avg (+ or -) 8.59%
Bias 4.12%, strongly positive bias on earnings.
With stock at 360.00 the data suggests these ranges:
Based on current IV (expected move into Friday per TOS): 320.79 to 399.21 (+/- 10.9%)
Based on AVERAGE one-day move over last 12 quarters: 329.07 to 390.93
Based on MAXIMUM one-day move over last 12 Q’s (16.3%): 301.28 to 418.72
Based on DOWN max only (-13.4%): 311.90
NOTE: Max 5-day moves are -11.1% and +18.1%, so slightly more bullish than 1-day.
Open to requests for other symbols.
#SPX7dteLong Bought to Open $SPX Sept 14th 3340/3360-3370/3390 condors for 18.25, with SPX at 3367.
I’m no longer going to use Options Bistro to post my podcast, “The Pick,” but that won’t stop me from shameless self promotion. I’ve added a section for my podcast at the bottom of the right hand column. It will display the three latest posts, and clicking on any of them will connect to the website where you can link to the episodes, videos, and other information about the show.
This podcast s NOT about trading, but rather music and entertainment. I hope you listen and enjoy!
#SPX1dte Sold to Open $SPX Sept 8th 3240/3260-3545/3565 condors for 1.25, IV 22.38%, SPX 3431, deltas -.07,+.06. Bit nervous with the three day weekend, but strikes are decently OTM.
#SPX7dteLong Sold to close $SPX Sept 4th 3500/3480 put spreads for 19.25. Condors bought on Monday for 15.90. There looks to be a small chance of a rally to 3480, so not risking it. Now I’m rooting for it so I can make some money on my call side.
Also, super proud for shorting the market near the low today. But I still actually think that will be a winner next week.

Link to Calendar: https://research.investors.com/economic-calendar/
#SPX1dte Sold to Open $SPX Sept 11th 3200/3220 call spreads for 17.25, when SPX was at 3370. Betting on more downside. Risking 2.75.
#Jobs — increase meets expectation, while UE rate falls more than expected
Gain of +1,371,000 non-farm payroll jobs, vs. expected 1.32M gain
Unemployment at 8.4%, down by 1.8%, vs. expected 9.8%
U6 unemployment at 14.3%, down by 2.3%
Labor force participation 61.7%, up by 0.3
Average hourly earnings up 0.4%, up by 0.2
July jobs revised down by -29K to +1.734M
June jobs revised down by -10K to +4.781M
#VIXIndicator A double warning today as $VIX closed up over 25% from yesterday’s close and is also up over 50% from the August 11th VIX low. Expect lower markets in the coming days or weeks.
#Earnings Unless it rallies tomorrow, looks like $CRWD will be a bust, but it was sold ITM so I knew the risk…
BTC $FIVE Sept 4th 112 puts for .05. Will let the call side wait for tomorrow.
#SPX7dteLong Bought to Open $SPX Sept 9th 3460/3480-3490/3510 condors for 17.20, with SPX at 3480.
Also, yesterday: Sept 2nd 3490/3510 call spreads expired ITM for max credit of 20.00. Condors bought last Thursday for 16.45.
VIX has spiked over 50% higher than its recent low.
#Earnings $AVGO reports tonight. Below are details on earnings one-day moves over the last 12 quarters.
June 4, 2020 AC +2.65%
March 12, 2020 AC +7.05%
Dec. 12, 2019 AC -3.77%
Sept. 12, 2019 AC -3.41%
June 13, 2019 AC -5.56% Biggest DOWN
March 14, 2019 AC +8.23% Biggest UP
Dec. 6, 2018 AC +0.58%
Sept. 6, 2018 AC +7.69%
June 7, 2018 AC -2.53%
March 15, 2018 AC -4.81%
Dec. 6, 2017 AC
Aug. 24, 2017 AC -3.70%
Avg (+ or -) 4.17%
Bias 0.20%, no significant bias on earnings.
With stock at 365.00 the data suggests these ranges:
Based on current IV (expected move into Friday per TOS): 340.68 to 389.32 (+/- 6.7%)
Based on AVERAGE one-day move over last 12 quarters: 349.80 to 380.20
Based on MAXIMUM one-day move over last 12 Q’s (8.2%): 334.96 to 395.04
Based on DOWN max only (-5.6%): 344.71
Open to requests for other symbols.
#Earnings. Aggressive put spread: Sold to Open $CRWD Sept 4th 150/145 put spreads for 3.20.
#Earnings Sold to Open $FIVE Sept 4th 107/112-135/140 condors for 1.661 (avg price). Bullish lean based on past performance, and market’s direction.
#SPX1dte BTC $SPX Sept 2nd 3560/3580 call spreads for .95. Condors sold yesterday for 1.10. Stop hit at the open.
#SPX7dteLong Bought to Open $SPX Sept 8th 3495/3515-3525-3545 condors for 16.10, with SPX at 3519.
#Earnings $ZM reports tonight. Below are details on earnings one-day moves over its entire history.
June 2, 2020 AC +7.58%
March 4, 2020 AC +7.02%
Dec. 5, 2019 AC -9.94%
Sept. 6, 2019 BO -7.85%
June 6, 2019 AC +18.40%
Avg (+ or -) 10.16%
Bias 3.04%, positive bias on earnings.
With stock at 305.00 the data suggests these ranges:
Based on current IV (expected move into Friday per TOS): 267.52 to 342.48 (+/- 12.3%)
Based on AVERAGE one-day move over last 5 quarters: 274.02 to 335.98
Based on MAXIMUM one-day move over last 12 Q’s (18.4%): 248.88 to 361.12
Based on DOWN max only (-9.9%): 274.68
NOTE: 5-day results show reversals into the negative for the last two quarters!
Open to requests for other symbols.
#SPX7dteLong Bought to Open $SPX Sept 4th 3480/3500-3510/3530 condors for 15.90, with SPX at 3506.
#SPX1dte Sold to Open $SPX Aug 31st 3425/3445-3555/3575 condors for .95, IV 10.16%, SPX 3507, deltas -.07, +.06.
Expiring: Aug 28th 3400/3420-3550/3570 condors , sold yesterday for .90.
#Supercharger expiring: $SPX Aug 28th 3400/3425 call spreads for max credit of 20.00, bought yesterday for 18.80.
#Earnings Expired at full loss: $ANF 10.5 puts, bought Wednesday for .85.
#SPX7dteLong Sold to close $SPX Aug 31st 3445/3465 call spreads for 18.75. Condors bought for 15.30 on Tuesday. Will look to sell the put side for a buck or less or keep it as a hedge. But it seems hedges are no longer necessary. We are never going down again, ever.
#SPX1dte Sold to Open $SPX 3400/3420-3550/3570 condors for .90, IV 16.37%, SPX 3497, deltas -.06,+.06.
My put side are the same strikes as my #Supercharger bought earlier. Of course, call Superchargers have the exact same profile and risk as Put credit spreads. So I’m doubled up on the down side risk.
#SPX7dteLong Bought to Open $SPX Sept 2nd 3460/3480-3490/3510 condors for 16.45, with SPX at 3483. The price on these went up about a buck after the VIX spike. It was in the mid-15’s this morning.
#SPX1dte Bought to Open $SPX Aug 28th 3400/3420 call spreads for 18.80, with SPX at 3482. This is a result of mistakenly entering the wrong strikes on a spread… but then I saw that I could make over a buck in one day, pretty much a no-brainer to buy it.
#SPX1dte Rolled the dice on a favorable close and lost. Condors sold for .90, ITM expiration costs me 8.93.
I’m probably going to sell an aggressive call spread soon, but imma wait for now.
…as the indices reach unreal heights. I left my desk for a couple hours this morning after the open was pretty calm. As it turned out, the SPX rose steadily the whole time I was away, so when I returned my short call had been hit. Tried to stop out but was not filled, not getting deep ITM. Missed my stop point so I’m without oars at the moment.
#Earnings $ANF reports tomorrow morning. Below are details on earnings one-day moves over the last 12 quarters.
May 28, 2020 BO -11.11%
March 4, 2020 BO +8.98%
Nov. 26, 2019 BO -2.57%
Aug. 29, 2019 BO -15.09%
May 29, 2019 BO -26.46% Biggest DOWN
March 6, 2019 BO +20.37%
Nov. 29, 2018 BO +20.91%
Aug. 30, 2018 BO -17.15%
June 1, 2018 BO -8.72%
March 7, 2018 BO +11.90%
Nov. 17, 2017 BO +23.90% Biggest UP
Aug. 24, 2017 BO +17.06%
Avg (+ or -) 15.35%
Bias 1.84%, positive bias on earnings.
With stock at 11.25 the data suggests these ranges:
Based on current IV (expected move into Friday per TOS): 9.88 to 12.62 (+/- 12.2%)
Based on AVERAGE one-day move over last 12 quarters: 9.52 to 12.98
Based on MAXIMUM one-day move over last 12 Q’s (26.5%): 8.27 to 14.23
Based on UP max only (+23.9%): 13.94
Open to requests for other symbols.
#Earnings $SPLK reports tonight. Below are details on earnings one-day moves over the last 12 quarters.
May 21, 2020 AC +12.73%
March 4, 2020 AC -9.10% Biggest DOWN
Nov. 21, 2019 AC +10.76%
Aug. 21, 2019 AC -7.83%
May 23, 2019 AC -7.32%
Feb. 28, 2019 AC -0.90%
Nov. 29, 2018 AC +9.93%
Aug. 23, 2018 AC +14.81%
May 24, 2018 AC -5.20%
March 1, 2018 AC +9.26%
Nov. 16, 2017 AC +17.89% Biggest UP
Aug. 24, 2017 AC +8.47%
Avg (+ or -) 9.52%
Bias 4.46%, strong positive bias on earnings.
With stock at 215.00 the data suggests these ranges:
Based on current IV (expected move into Friday per TOS): 197.02 to 232.98 (+/- 8.4%)
Based on AVERAGE one-day move over last 12 quarters: 194.54 to 235.46
Based on MAXIMUM one-day move over last 12 Q’s (17.9%): 176.54 to 253.46
Based on DOWN max only (-9.1%): 195.44
Open to requests for other symbols.
#Earnings $NTAP reports tonight. Below are details on earnings one-day moves over the last 12 quarters.
May 27, 2020 AC -4.64%
Feb. 12, 2020 AC -9.27%
Nov. 13, 2019 AC +3.17%
Aug. 14, 2019 AC +3.93%
May 22, 2019 AC -8.10%
Feb. 13, 2019 AC -5.47%
Nov. 14, 2018 AC -11.72% Biggest DOWN
Aug. 15, 2018 AC -3.58%
May 23, 2018 AC +1.93%
Feb. 14, 2018 AC -4.89%
Nov. 15, 2017 AC +15.91% Biggest UP
Aug. 16, 2017 AC -6.72%
Avg (+ or -) 6.61%
Bias -2.45%, negative bias on earnings.
With stock at 42.00 the data suggests these ranges:
Based on current IV (expected move into Friday per TOS): 38.61 to 45.39 (+/- 8.1%)
Based on AVERAGE one-day move over last 12 quarters: 39.22 to 44.78
Based on MAXIMUM one-day move over last 12 Q’s (15.9%): 35.32 to 48.68
Based on DOWN max only (-11.7%): 37.08
Open to requests for other symbols.
#SPX7dteLong Bought to Open $SPX Aug 31st 3415/3435-3445/3465 condors for 15.30, with SPX at 3439.
#SPX1dte Sold to Open $SPX Aug 26th 3370/3390-3470/3490 condors for .90, IV 10.9%, SPX 3438, deltas -.07,+.07
#Earnings $CRM reports tonight. Below are details on earnings one-day moves over the last 12 quarters.
May 28, 2020 AC -3.48% Biggest DOWN
Feb. 25, 2020 AC -1.32%
Dec. 3, 2019 AC -3.18%
Aug. 22, 2019 AC +2.24%
June 4, 2019 AC +5.05%
March 4, 2019 AC -0.96%
Nov. 27, 2018 AC +10.27% Biggest UP
Aug. 29, 2018 AC -1.71%
May 29, 2018 AC +1.90%
Feb. 28, 2018 AC +2.73%
Nov. 21, 2017 AC -1.81%
Aug. 22, 2017 AC +0.12%
Avg (+ or -) 2.90%
Bias 0.82%, positive bias on earnings.
With stock at 191.00 the data suggests these ranges:
Based on current IV (expected move into Friday per TOS): 198.50 to 226.50 (+/- 6.6%)
Based on AVERAGE one-day move over last 12 quarters: 206.34 to 218.66
Based on MAXIMUM one-day move over last 12 Q’s (10.3%): 190.68 to 234.32
Based on DOWN max only (-3.5%): 205.11
Open to requests for other symbols.
#SPX7dte Sold to close on GTC order in premarket: $SPX Aug 26th 3370/3390 call spreads for 19.00. Condors bought for 16.00 last Thursday. Will look to get some pennies for the put side, too.
#SPX7dteLong Expiring ITM: long $SPX Aug 24th 3395/3415 call spreads for max credit of 20.00. Bought for 15.05 last Tuesday.
#SPX1dte Expiring worthless: short Aug 24th 3320/3340-3440/3460 condors, sold Friday for .90.
#SPX7dte Bought to open $SPX Aug 28th 3395/3415-3425/3445 condors for 15.25, with SPX at 3421.
#Earnings $PANW reports tonight. Below are details on earnings one-day moves over the last 12 quarters.
May 21, 2020 AC +3.67%
Feb. 24, 2020 AC -17.01% Biggest DOWN
Nov. 25, 2019 AC -11.95%
Sept. 4, 2019 AC +5.76%
May 29, 2019 AC -5.11%
Feb. 26, 2019 AC +8.20%
Nov. 29, 2018 AC -1.76%
Sept. 6, 2018 AC +3.28%
June 4, 2018 BO -0.52%
Feb. 26, 2018 AC +2.31%
Nov. 20, 2017 AC +4.82%
Aug. 31, 2017 AC +10.53% Biggest UP
Avg (+ or -) 6.24%
Bias 0.19%, no significant bias on earnings.
With stock at 191.00 the data suggests these ranges:
Based on current IV (expected move into Friday per TOS): 246.70 to 285.30 (+/- 7.3%)
Based on AVERAGE one-day move over last 12 quarters: 249.61 to 282.61
Based on MAXIMUM one-day move over last 12 Q’s (17.0%): 220.75 to 311.25
Based on UP max only (+10.5%): 294.01
Open to requests for other symbols.