
#VIXIndicator #Markets
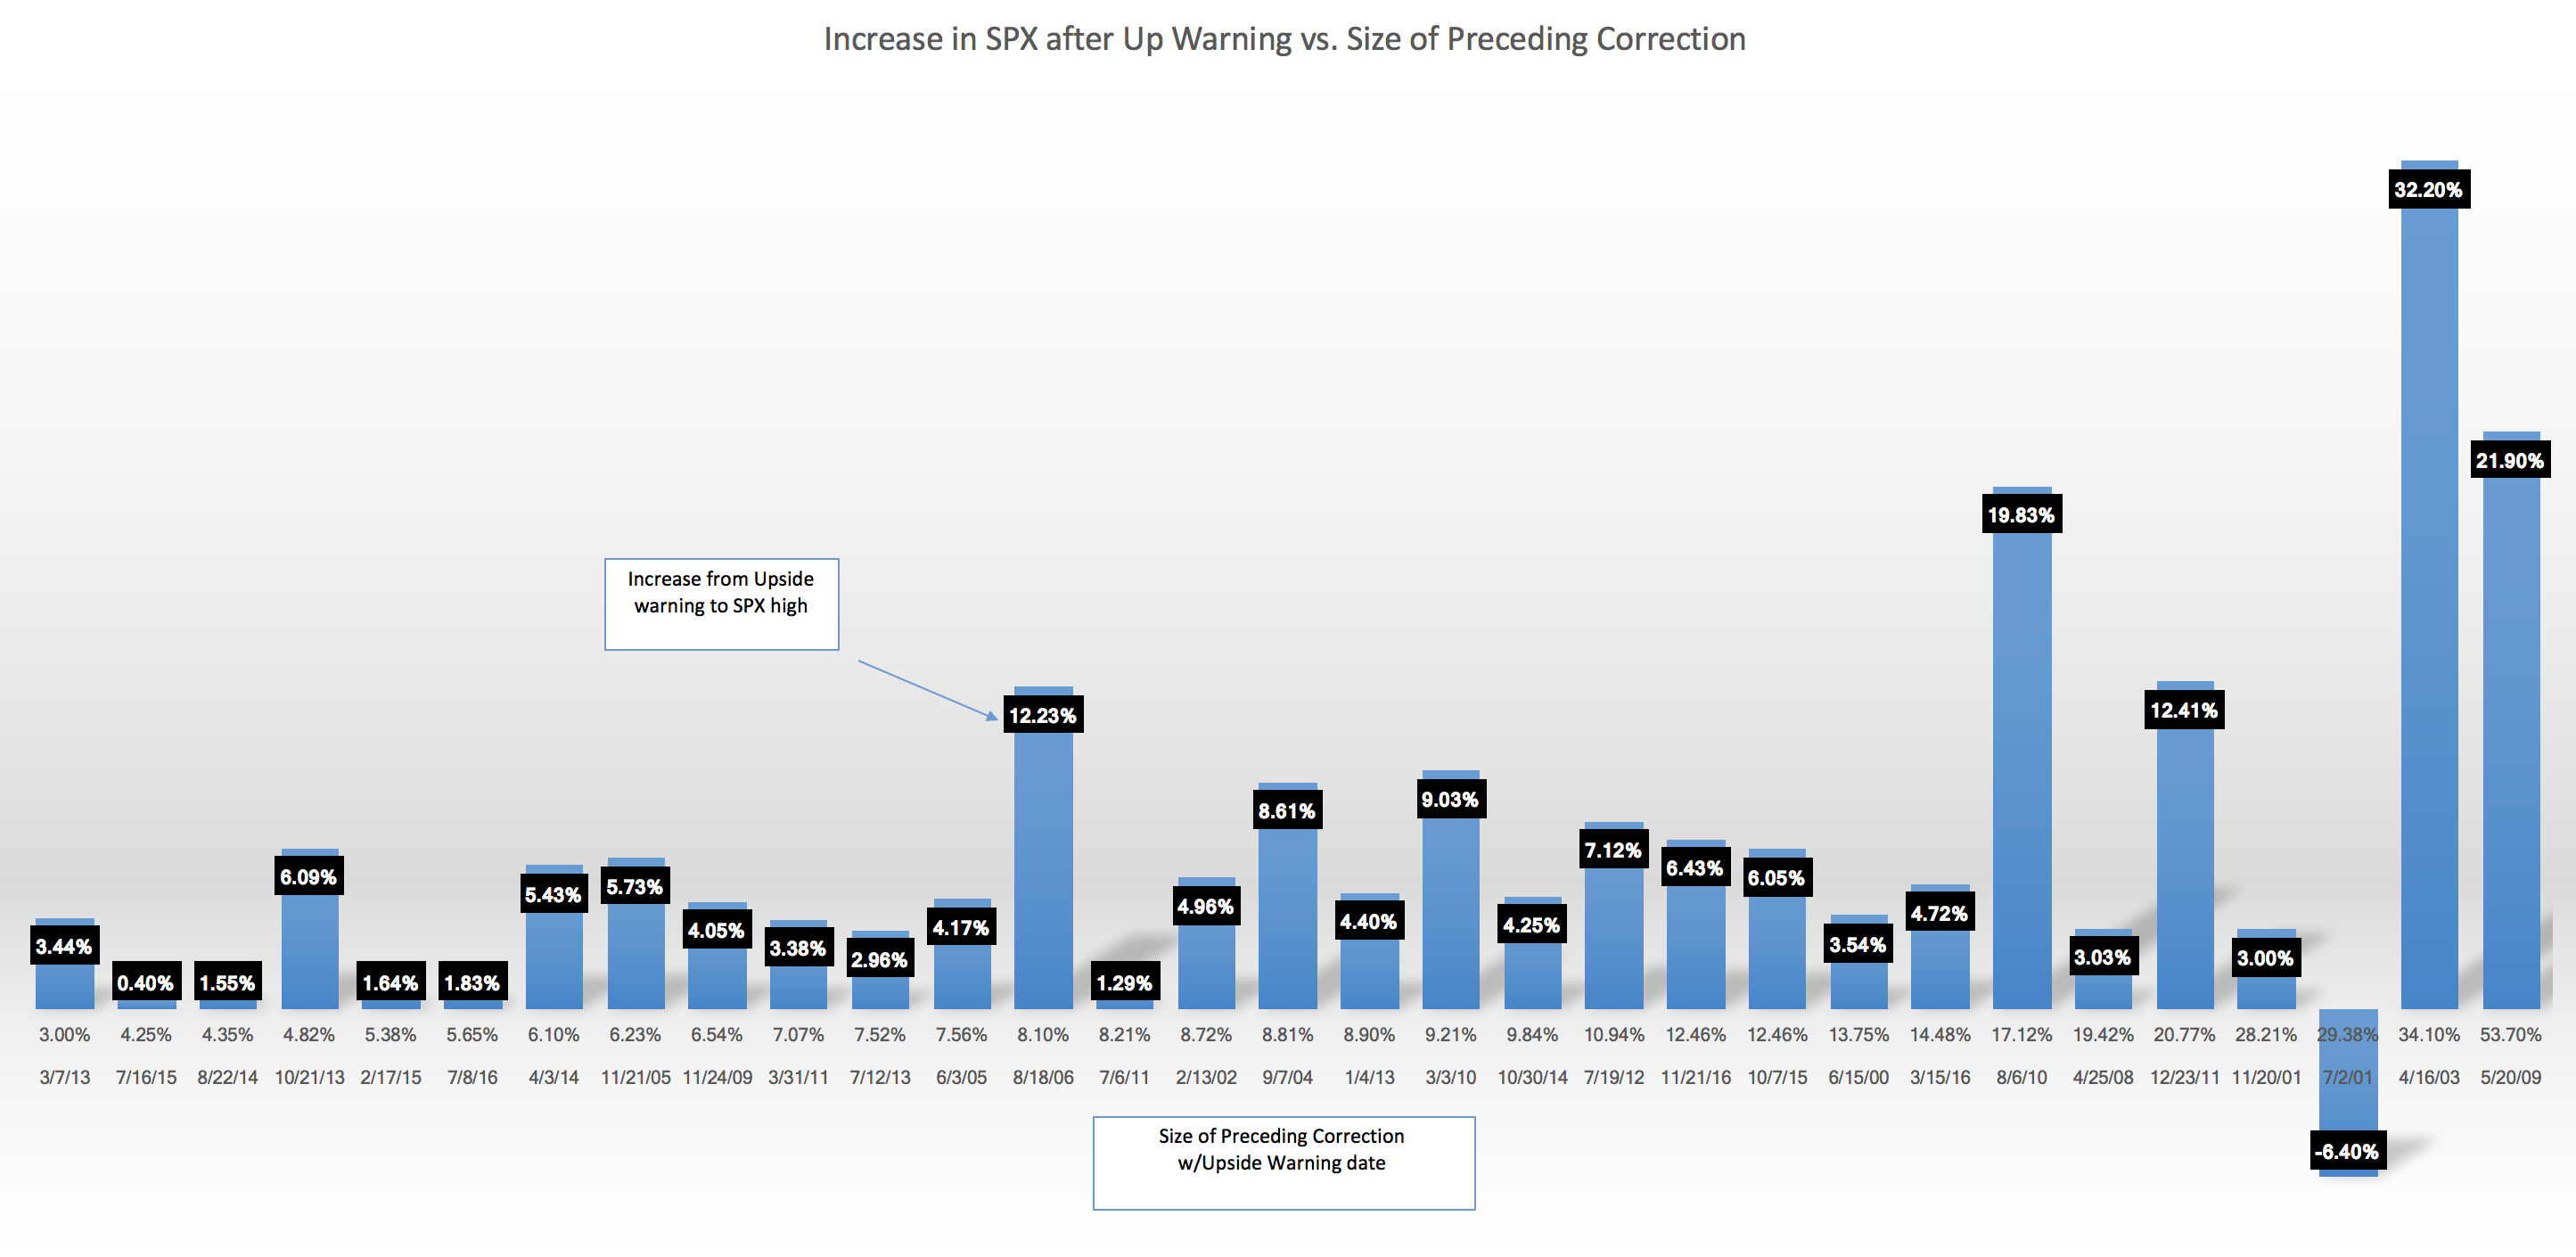
I’ve created a chart to compare the performance of Upside Warnings with the correction that precedes it. The bigger the correction, the bigger the subsequent rally in the SPX. This is no surprise, but I wanted to see how it charted from all Upside Warnings since 1999. The mini-correction we just had was exactly 3.00%, which is tied for smallest with one in 2013. So the move up we should expect now is relatively minor. The first bar on the chart is that 2013 example… SPX increased 3.44% from the close of the Upside Warning day to the next SPX high. A 3.44% move this time would be a high of 2469.58.
Let me know if you have questions!
(note the only time there was a negative performance were the days leading up to 9/11/2001)
