
#VIXIndicator A third signal fired today. After the Warning fired (Oct 13th), additional warnings mean continued volatility but can also signal a market bottom. So it is best to remain on guard after the Warning until it is canceled.
Category Archives: General/Announcements
Daily Theta %
Do you guys ever look at daily theta as a percentage of net liq? TT recommends anything up to close to 1 percent on the high end with maybe one-fourth to one half of one percent as more normal. Checked mine and I’m at .46 of 1 percent…so just under one half of one percent. Seems reasonable I guess…feels like I could go higher but like having a nice cushion. These percentages according to TT should be attainable with only about a third of your account in the market at any time. I’ve never paid much attention to it but starting to watch it a little now.
Is the VIXIndicator punking us?
#VIXIndicator Well, if that was a near-term bottom today, that will be three Downside Warnings in a row that occurred on the day of the market bottom… Brexit in June, last month and this month.
That is not the historical norm, but if it’s becoming a new reality I may need to look at some adjustments. The main purpose of the Downside Warnings is to avoid huge dumps like August 2015. For the bigger corrections, it has always given fair warning before the huge dive. It may just be that it is less useful on these smaller dips.
Overcoming fear
It’s the toughest thing about trading, and nothing has provided a bigger leap away from fear than my recent experience of managing an ITM call spread. I was short the August 2130/2155 call spread as the SPX reached all time highs of 2193. It was a big trade, too, over twice my normal size, and it sucked as the index went through my strikes (I had already rolled several call spreads, but let this one sit). But as it sat there ITM for days and then weeks, I grew more relaxed and started exploring ways to roll my way out. I figured a system, without increasing position size, and started rolling it one week before it expired. All it would take is a decent pullback or two and I’d be out. It took about 6 rolls and now I’m out with no loss, in fact retaining the profit I expected on the original trade.
Going ITM and realizing max loss seems to be a great fear for many option traders. To help overcome it, I suggest trading an ITM spread on an index. Indices do not have huge overnight gaps like stocks, and there is no possibility of early assignment, as they are cash settled at expiration, never earlier. Your risk never changes, whether you are 100 points OTM or 100 points ITM (except with Portfolio Margin, which is unpredictable).
Today, I sold a 1-lot:
Sold to Open $SPX Nov 25th 2175/2150 put spread for 14.00. I will wait until mid November to even worry about it. It will be similar to having a trade go against you, except we now have the benefit of a very fat credit upon entry, rather than the 1.30 or so for which we usually sell these spreads.
Feel free to join if you are looking to overcome some of your fear. If you do it, understand that if it remains ITM in November, we may be selling condors or extra options during the rolls. But as before, I do not plan to increase risk very much. #SPXcampaign #FearTrade #ITMrolling
Downside Warning fired
Downside Warning fired
This Chart shows which is…

This Chart shows which is the best strategy when the IV is rising, steady or dropping.
Karen SuperTrader saga
Here’s a link to the SEC’s response to request for dismissal. Interesting to read at least the intro in the continuing saga of a revered trader who was allegedly perpetrating fraud.
https://www.yumpu.com/en/document/view/56010098/mtd-opposition-10032016
NUGT-a current picture of volatility drag
Volatility drag, volatility tax, slippage or whatever else we call it shows up in leveraged ETFs and becomes more apparent the longer the timeline. But the recent implosion in $NUGT is allowing us to see how this effect can play out in a shorter time window:
Using the instrument from which $NUGT is derived, $GDX, if you measure the % gain it would have to achieve to get back to its highs (from around 23.70 right now to about 31.80 on 8/11-8/12) it calculates to around 34%.
If you take 3x the 34% (=102%) that would only get $NUGT back to around 26.25, nowhere near its corresponding high from 8/11-8/12 of 35.80. For NUGT to get back to its August highs from its current level around 13, it would need to add 175%.
This is one of the reasons I’ve been aggressively selling calls at strikes near the August highs on big moves up. It will be very difficult (and will require a much bigger corresponding move in gold and the miners) for $NUGT to challenge old highs.
The importance of Monday morning premium
#SPXcampaign On Monday in the first hour of trading, the market was down less than half a percent. I sold the Nov 4th 2235/2260 call spread for 1.40 on an uptick to 2162. 33 days until expiration.
In the first hour today, 31 days to expiration, our intraday high was just below 2162. The same spread topped out at about 80 cents.
I have seen this constantly with call spreads… Monday morning premium is highly elevated, and drops quickly by Monday afternoon. Provided there are no large moves in SPX, theta makes quick work of the premium. This is less dramatic with put spreads, and I have not tested it as much with different expirations (just the 30-35 DTE range).
This is why that I sold that call spread even though the market was down.
Concerned about Deutsche bank? Here…
Concerned about Deutsche bank? Here is an interesting article…
http://tinyurl.com/zr3feex
@TravelinTrader are you on here?
?? Saw your question on OMM…I’ve often wondered the same thing. Still no answer but performance over there can’t be too hot…unless you go in big on the winners and small on the losers…LOL
Downside Signal Fired
#Market #VIXIndicator Things suddenly look dark… DB and all banks continue dropping. After last Thursday’s Downside Warning cancelation, we have a new signal this Thursday. It takes two signals for a Warning. Next level today is 16.53.
I’m looking to exit the put side of the condor I entered earlier… immediate loss on that one!
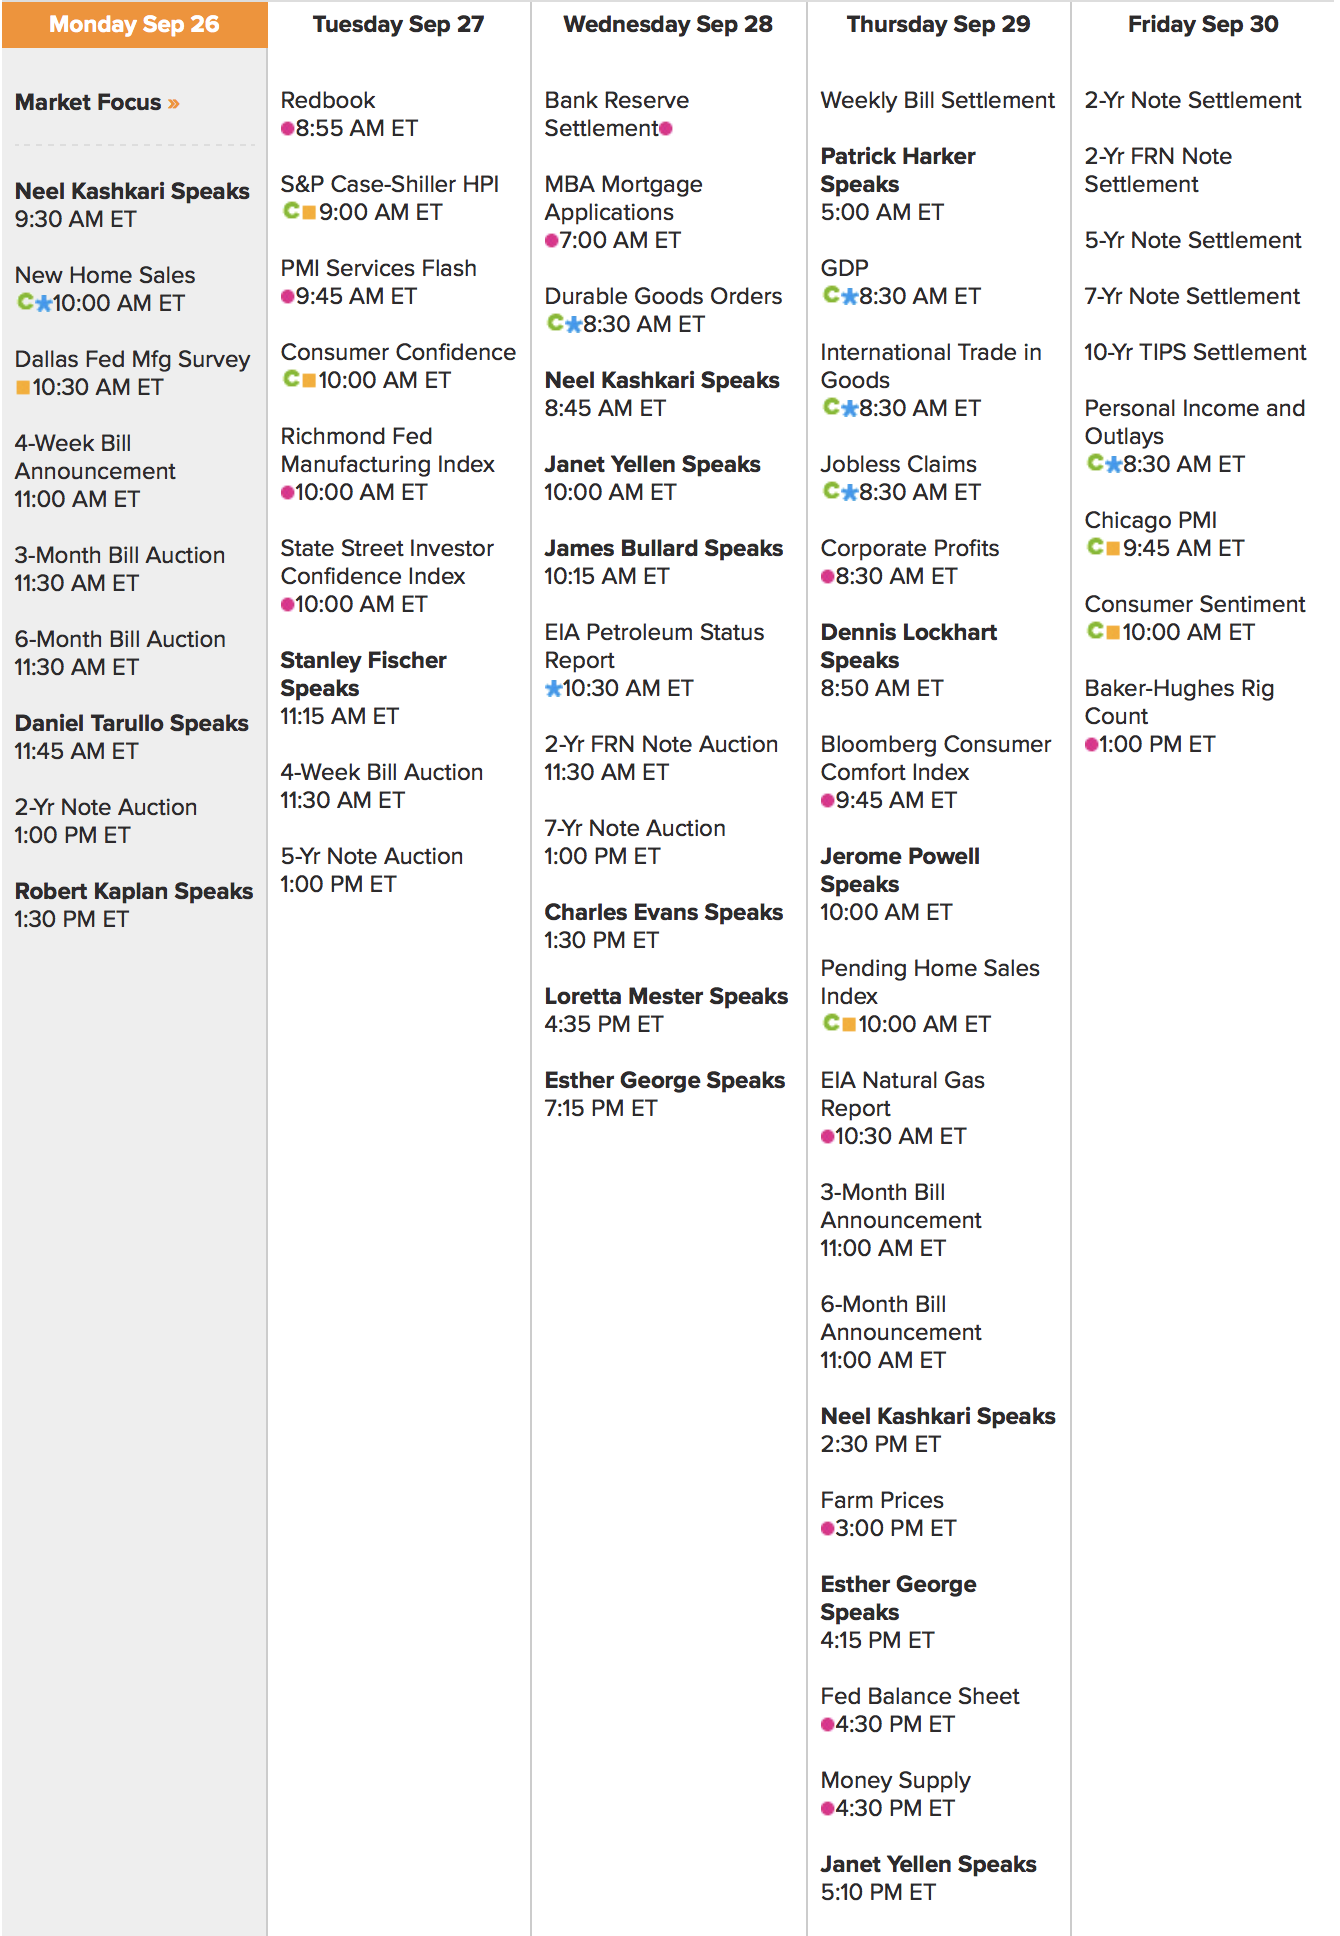
Econ Calendar for Week of Sept 26
This is quickly accessible in the menu bar, above (top/right-of-center).
Downside Warning canceled
#VIXIndicator With today’s close below the 78.6% Fib line on the VIX chart, the downside warning is canceled.
Of the 36 VIX Indicator corrections since 2000, a canceled Downside Warning led to an Upside Warning 26 times, or 72%. An Upside Warning occurs after three consecutive closes below the 78.6 line, which currently is 13.05 on the VIX. The average time between a canceled Downside Warning and an Upside Warning is 5.7 trading days.
(For the 10 times an Upside Warning did not follow, it was an average of 16 trading days until a new Downside signal).
We are still using the VIX Aug 9th low of 11.02. The levels for new Downside signals to fire are 15.03 (25% above 2-day closing low), and 16.53 (50% above Aug 9 low).
Playing the FED
Starting at about 1:59pm ET, many of our favorite tickers will start getting nutty. If you like to sell premium, have orders ready on NUGT, UVXY, SPY or SPX, etc as you might get some very good fills with the market reaction to the 2pm announcement.
Econ Calendar now in top menu
I will post this every Monday, and I’ve added it to the top menu bar (at top of your browser window, just right of center). This way, you can quickly access it for the remainder of the week. I am pulling a screenshot from Bloomberg: http://www.bloomberg.com/markets/economic-calendar
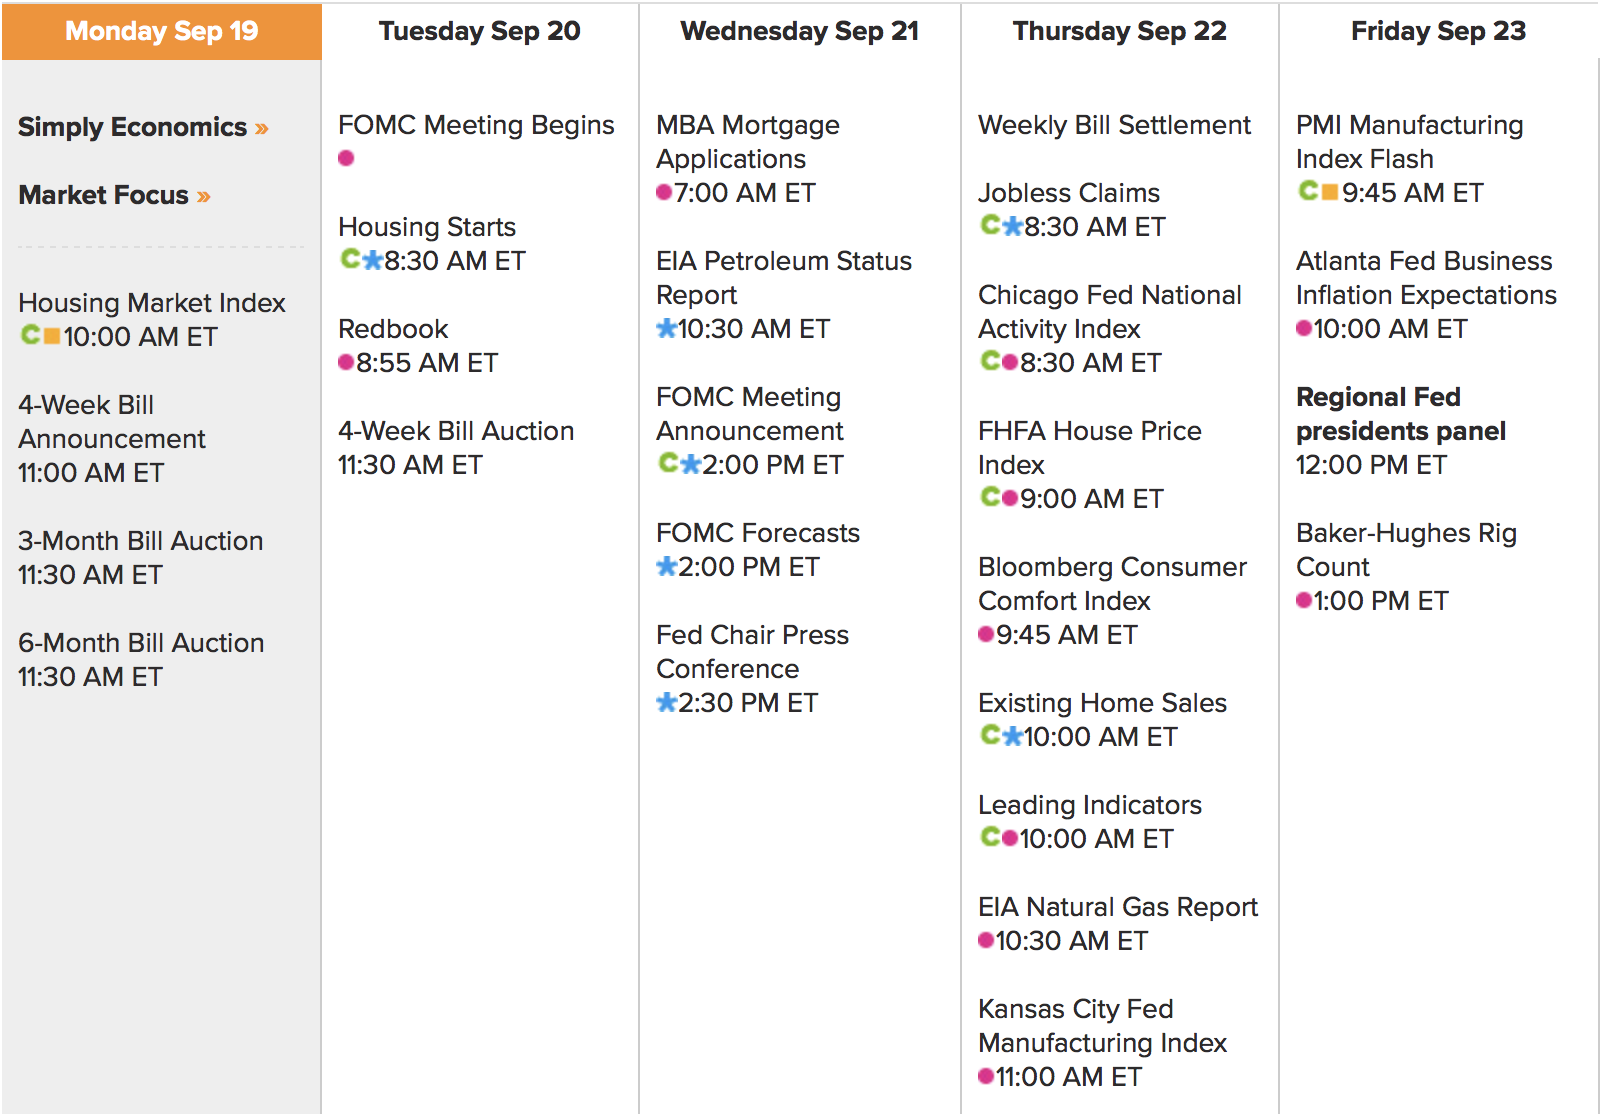
Econ Calendar this week
It’s all about FOMC on Wednesday…
Today is a quadruple witching…
Today is a quadruple witching – which is the simultaneous expiration of 4 sets of options…..Stock Index futures, Stock Index Options, Single stock options and single stock futures…it happens 4 times a year (qtr end) and is usually associated with much bigger volumes and volatility…..Look for extremely large volumes on both the openings and closings and while it looks ‘big and scary’ the fact is that in the final mins leading up to both bells – the stocks all pair off right where they are supposed to. You see – it is not a secret – traders expect it, and the mkt is well positioned to manage it.
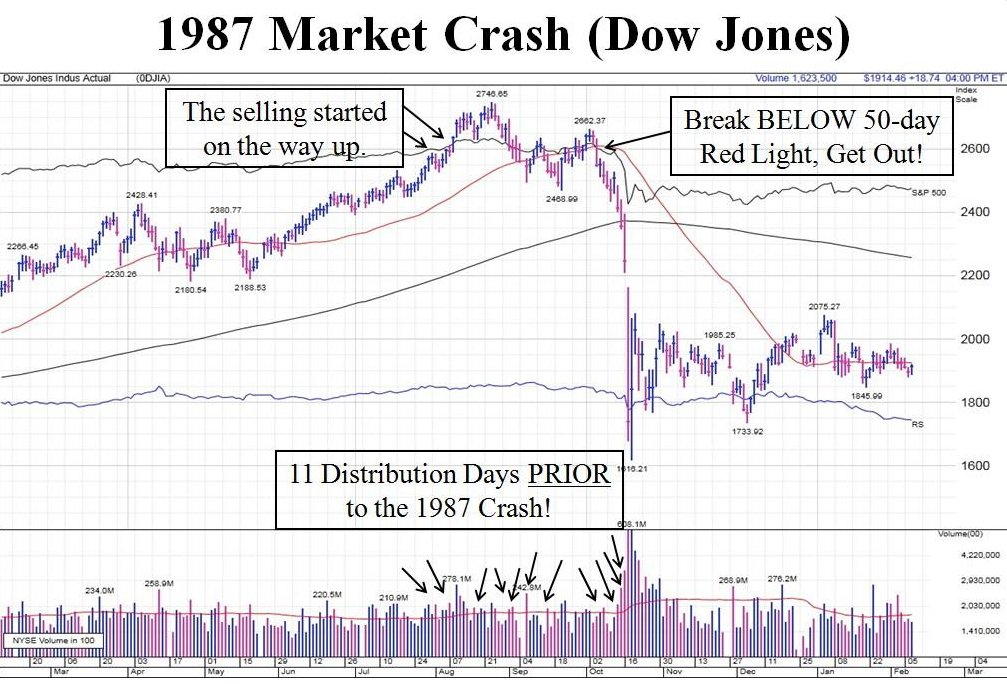
Great chart of the 1987…
Great chart of the 1987 crash for educational purposes only. A good one to keep on file. $SPY $SPX
Third signal fired on VIX Indicator
#VIXindicator A third signal just fired, after the two on Friday, as VIX is up 25% from yesterday’s close.
Of the 36 corrections since 1/1/2000, a third signal fired 29 times. A fourth signal fired 22 times. So based on that data there is just under a 25% chance that we’ve reached the bottom of the correction.
T2108
Anyone know where the T2108 is trading today?
TGO update
These daily videos are free…
VIX Indicator
A DOWNSIDE WARNING is in effect.
It was established Friday, when VIX exceeded 14.93 (25% above the 2-day low), and 16.53 (50% above August 9 low).
Since 1/1/2000, there have been 36 downside warnings. The subsequent high in the VIX is reached on an average of 12 trading days after the Warning, which in this case would be Sept 27th. The range has been from zero days (happened 3 times) to a max of 50 days (in 2007).
After the Warning, there is usually at least some upside retracement in the SPX before the VIX high is reached, but it is usually minimal and early. The average SPX rally high is only 1.9% above the Warning-day low, and happens on an average of 4 days after the warning. This would mean a high of 2168.24 reached this coming Thursday, before we collapse to new lows. Again, this is based on averages.
Additional signals that occur now will indicate worsening conditions, but also could signal a correction bottom. Monday’s next signals are 21.88 (25% above Friday’s close), and 22.04 (100% above Aug 9th low). After a warning there is a 86% chance at least one more signal will fire, and only an 8.3% chance that the Warning day is also the VIX high.
VIX low was 11.02 on Aug 9th; VIX high Friday was is 17.54. To cancel the Downside Warning, we must have one close below the 78.6% Fib retracement, which is 12.42. This level will change anytime the VIX hits a new intraday high.
Let me know if there are any questions! #VIXIndicator
VIXcontango.com highlights
First, let’s quantify the day yesterday. Yesterday’s nearly 40% jump in the VIX was the 11th biggest VIX daily spike in history. There are 6726 trading days in the VIX so the chance that any given day will be in the Top 11 is 11/6726 or 0.16%. As you can see from the table below 5 of the top 20 biggest daily spikes have happened in 2015 and 2016. There is no other 2 year period with 5 such days in the top 20 – not 2010-11, not 2007-08 and certainly not many before 2007. In fact 14 of the top 20 (70%) are since 2005 when Regulation NMS was passed by the SEC thus giving rise to the High Frequency Traders.
In addition, even though there have been spikes in volatility when the SPX is near an All-Time High, the SPX usually has not lost 50 points in a day this close to an All-Time High. The biggest such day prior to yesterday was -36 points on April 15th in 2013. The other days the SPX lost around -15 points.
Not only was the 50 point loss the biggest this close to an all-time high, but also the drop below the MA50 which is normally a big support level was also rather astounding. There are only 10 instances when the SPX opened above the MA50, dropped below the MA50 and proceeded to lose more than 30 points after that. The average drop through the MA50 is about 7 points with a standard deviation of 10 points. So dropping 36 points below the MA50 is a 3 standard deviation event (3 sigma event or 0.3% occurrence). As you can see most of these have happened during Bear Markets or during some large international crises like in 1997 or in June 2016 (Brexit). For this to happen out of the blue yesterday on no real news is rather astounding.
In fact, the only other day that bears resemblance to this VIX spike is 2/27/2007 which was triggered by a selloff caused by the government of China intervening in the Shanghai market to stop a 10% selloff there.
A Unicorn Day
Yesterday was a day that couldn’t be predicted with any of the usual methods of analysis – fundamental, technical or volatility analysis.
From a fundamental perspective stocks are fully valued, but GAAP earnings are on the way up. Also the US and overall global GDP is on an upswing in Q3. Moderately rising yields in Japan, Europe and the US normally trigger a rotation from expensive defensives to cheaper cyclical sectors. All of these are factors that dampen volatility and make the presence of high volatility days less likely.
From a technical perspective, there was no topping or reversal pattern. Big days like this are preceded by big hesitation, high volume days, some kind of a multi-day topping pattern as well. There are no such patterns to be seen. From support/resistance perspective, we had 3 pretty big support levels at 2160, 2150 and 2135 that should have held but didn’t.
From “trend following” perspective, indeed the Bollinger Bands are tightening and the near-term averages are bunched up, but the slope of these is positive so it is very unlikely for a big down day like this to transpire.
From a “mean reversion” perspective, you really can’t say that yesterday was a “mean reversion” move because the 50MA is the mean. The SPX had mean reverted by going nowhere for 2 months.
From a volatility perspective, volatility has been very calm, I would say too calm, but still this is a 3 sigma event based on the recent volatility profile and 2.5 sigma (2% occurrence) event on a more normal volatility profile. Again something that normally would not happen even if the VIX was in the 15-16 range the day before.
So what was the cause for the selloff yesterday?
I find it hard to believe that a speech by a FED president many people ignore triggered such a massive move. So all of a sudden the market doesn’t listen to Stanley Fischer and Janet Yellen, but it does listen to Eric Rosengren. Really?!? I also don’t really buy the argument that a 0.10% jump in the 10-Year Treasury yield triggered this selloff either. Yields are still at 1.67%, levels the market has traded below in only 143 out 13649 trading days in its history. That would be 99.9895% of the time people bought treasuries at higher yields. The story that you have a bond selloff on the horizon because Japan and Europe think that negative rates are not beneficial is not credible. Central banks may not like negative but they still very much like zero. So rates will go up 25-50% basis points. I am not sure why that would somehow trigger a larger escalation. So forgive me if I don’t think 1.67% 10-Year Treasury yield is a reason for a bond driven stock market selloff. I also don’t buy that North Korea nuclear test is the reason. North Korea has had other such tests, they didn’t trigger large market moves.
The most plausible explanation I have is that the market has traded in that 2160-2190 range for so long that any technical break of these levels will trigger stops, short covering and the algorithmic closing of trades tends to extend the move. What I have a hard time reconciling is that the move would be so extended. Essentially, we got a 1 week worth of selloff in 1 day. The only way I explain the 2.5% drop yesterday and the 5% drop after Brexit is high-frequency traders (HFT) algorithms. Once certain thresholds are broken, they hit kill switches and the liquidity evaporates from the market. For example, the market should’ve rallied at 2160 and 2150 yesterday but after 2150 broke, it was free fall from there.
This is a very disconcerting phenomenon, in my opinion, because it means that high frequency trading hasn’t made the markets more stable. They are more stable until they aren’t. There is a lot of liquidity up to a point and after that liquidity vanishes into thin air. I don’t really know what the fix for that it. So far it seems the SEC and the FED are really behind the ball in regulating the HFTs and making them responsible market participants. Until the FED and the SEC come up with a proper policy for the HFTs, these intraday flash-crashes are something that unfortunately market participants will have to continue to expect. We have had at least 3 of those crashes (Aug 2015, Brexit and yesterday) in a 1 year span – which is kind of amazing. I thought January’s controlled selloff proved that we have put the “flash crashes” behind us but apparently we have not.
Key Market Levels
This September was following the seasonal chart until Friday. Friday was supposed to be a down day and I expected that but it wasn’t supposed to be THAT big of a down day.
I don’t think the selloff that started last Friday will last very long or be very deep. I expect at most a 5-7% drawdown before the election which puts the SPX bottom in the 2035 to 2080 area. This is a typical pre-election drop and given the direction of earnings, with 2017 in mind I think this is an excellent opportunity to buy the dip. If rates are really rising, financials are a good buy here and if rates aren’t rising, what is different than before? Over the next couple of weeks and months, I will be looking to allocate the remaining 50% in the family 401(k) to stocks. If we get to the 2050-2100 area in the SPX, I think this is a really solid area to put money to work for the rest of 2016 and 2017.
SPX will meet serious support at the current 2130 level where the prior ATH was and after that at the 2100 level. The 2100 level where the higher low trendline of February and June is should be tough to overcome. And after that we have the 200MA at 2050 which is a big line in the sand.
Resistance areas on the topside is the 2165 where the 50MA is and 2175 level where the 10-40MAs are.
Downside Warning Fired
#VIXIndicator And there we have it… a full warning to the downside. Two signals hit today.
More downside expected in the coming days and weeks. It is very rare for the day of a warning firing to be the low.
$SVXY #CoveredCalls – a lesson…
$SVXY #CoveredCalls – a lesson on why not to trade on your phone.
Friday I was attempting to roll some strike 70 calls that were about to expire out 3 weeks to some Sep 30 2016 72.0 calls for a credit. I got a spread order off, Buying strike 70s at 5.81 and selling strike 72s at 6.69. All good, right? Well … not so much.
I realized a few hours later that I had fat-fingered the spread order and bought the Sep 9 2016 70 calls that I did not formerly have a position in, putting me long 10 contracts. And I was still short the Sep 2 2016 calls that I had intended to cover.
I spent the rest of the day trying to cover the Sep 2 contracts while liquidating the long Sep 9 contracts. The bid ask spreads just kept getting wider and wider until near the close I just put in a covering order at 6 for the Sep 2 contract figuring if it didn’t fill at least I could deliver some long stock I was holding. The stock was trading above 76 at the close but just after the close the stock dipped and the option order filled.
So this morning, thanks to strong opening I sold some stock at 76.30 in the premarket and then sold the long calls at 6.80 when the market opened.
So I made almost $1000 on the long options I didn’t really want. Most of the time it doesn’t work out so well. I’m cooling my jets for the rest of the week.
OMM…I’m moving on
With mixed emotions I’ll be letting my OMM subscription expire in October. Been there since the beginning but not really getting much value out of it anymore. Dan’s trades don’t really fit my style and I was real good at only taking the losers…LOL. I’ll be taking my educational dollars elsewhere simply for a fresh look at option selling.
I’ve watched this guy for awhile and have done a couple trials over the years. He was running an awesome special last week so I signed on for a year. He’s a little more aggressive so I’ll be treading lightly until I get a feel but you can’t argue with his performance. Various portfolios up 50-75 percent YTD. If you see me posting an odd looking trade (for me) you can probably guess where it came from…LOL
Yellen: “Case for raising rates…
Yellen: “Case for raising rates has strengthened in recent months but no signal of September move…” USA Today
TSLA looking very bearish….

There is a squeeze on the 5, 195, and daily chart which should fire down.
Mylan Pharmaceuticals (MYL) increased the…
Mylan Pharmaceuticals (MYL) increased the epinephrine (very cheap medication) pen (this is a device) used. MYL brought it from Merk @ $93.88 and selling it at $608.61, that 500% increase. I wonder when these pharma companies stop doing this. There is no justification of selling a cheap medicine which is 50 ml at $20.99, each 1 ml cost 20.99/50= $0.42, so MYL selling it for $608.61. The reality is not 500% increase but it is $1,500.00 of the drug. Let us say the device ONLY cost $20.00, it is syringe. Therefore the pen would cost $20.42 per pen. So how they would justify sell it for $608.61. To prove they are cheating, they reduce the price by 50%, this is even worse, this way they are saying openly that they over price it, and cheating.
Bistro
FYI, the number that pops up on the orange tab at bottom represented new posts, but sometimes it will show a large number as “new” when they are not. This occurs when I am categorizing past posts… when I update old posts it sometimes shows them as “new” on the counter.
Sosnoff said something interesting…
The other day he talked about how there are certain tickers that he ALWAYS has a position in. Said he makes the bulk of his money carrying these all the time and constantly adjusting and collecting theta. Most of the ones he mentioned were all the usual suspects….big and liquid.
Seemed like an interesting idea to me. That’s almost how I’ve been trading NUGT lately. Not so worried about selling and expiring….trading it for bigger premium with smaller positions and just planning on doing that indefinitely…(as long as premium stays elevated).
With all this in mind, I’d like to try it in a regular stock. Looking at CMG since it’s not crazy expensive (see PCLN) and offers weeklies. What do you guys think of his theory?
tastytrade iron fly research…
Quite a few segments on these. Think I’ll review a few tonight.
https://www.tastytrade.com/tt/learn/iron-fly
$VIX $SPX – http://www.bloomberg.com/news/articles/2016-08-01/insuring-against-a-market-selloff-just-keeps-getting-cheaper
$VIX $SPX – http://www.bloomberg.com/news/articles/2016-08-01/insuring-against-a-market-selloff-just-keeps-getting-cheaper
CBOE details on SPX Monday Expirations
http://ir.cboe.com/press-releases/2016/07-11-2016-193925310.aspx
SPX Monday-Expiring Weeklys Options to…
SPX Monday-Expiring Weeklys Options to Launch on August 15
WOW!!
SPX Upside Warning data
I have been compiling data on the #VIXindicator. I hope to present it to everyone in a webinar soon, but since we are in an Upside Warning now, I wanted to share some points of interest.
(An Upside Warning fires when the VIX closes below the Fib 78.6% retracement for three consecutive days)
1. 33 corrections since Nov 1999, as determined by the VIX Indicator’s downside signals. These corrections average 12.5% each. Smallest was 3% and largest was 53.7% (2008-9).
2. Of those corrections, an Upside Warning fired 28 of the 33 times.
3. In 27 out of 28 times, the SPX continued higher after the Warning.
4. The average SPX bottom to top recovery was 16.4%. The average rise AFTER the Warning was 6.40%. This means that the Upside Warning captured an average of 38.9% of each recovery.
5. The average amount of time between an Upside Warning and the next SPX high is 2.5 months.
For instance, in the recovery we are now in: SPX low was 1991 on June 27, high was 2169 on July 14. That is an 8.9% recovery. The Upside Warning fired Friday, July 8, when we closed at 2120.90. Since then, we topped out at 1.83% higher, which means the warning caught 21% of the move so far.
21% is below the 38.9% average, so more upside is definitely possible. But pullbacks can and do happen during Upside Warnings. A new spike in the VIX that triggers a Downside signal would end the Upside Warning.
In summary, when an Upside Warning fires it is almost guaranteed that more upside will come, and it could last several weeks.
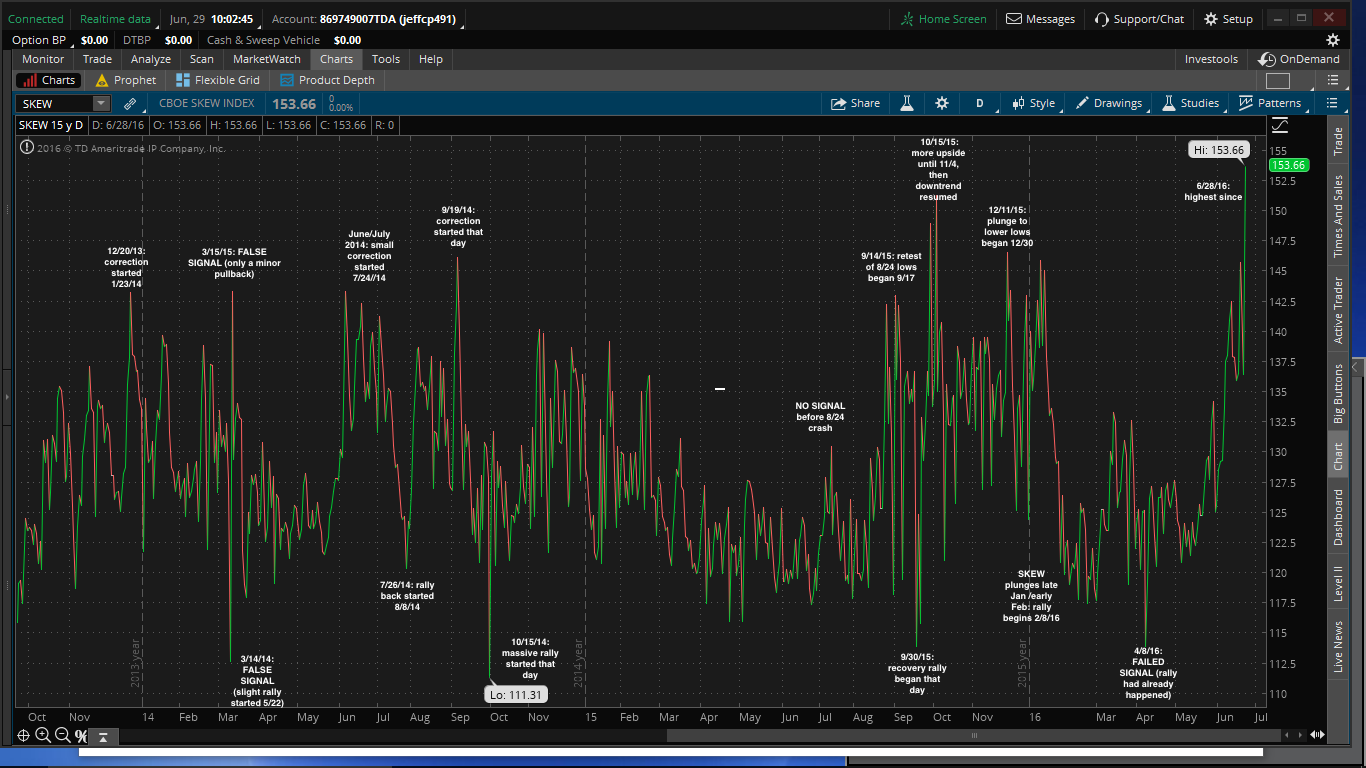
SKEW history
Below I’ve compiled a daily chart of the SKEW since 2013 to show how accurate it can be. Most peaks in the SKEW (above 140) are followed by corrections. We don’t always get a signal; the August 2015 crash was preceded by no SKEW peak. But when it does peak, a correction almost always follows. Slightly less reliable but still significant are signals below 120… we usually get a strong rally. 10/15/14 and 9/30/15 are good examples, with rallies beginning the very same day that brought us back to pre-correction highs.
Bistro SPXcampaign position chart
My positions in the #SPXcampaign are now visible in the chart linked in the right hand column; just click on the image to open it full screen.
You can use your browser’s zoom function on the chart since the print is small. I have included a key to all of the info included in each spread. I will add each day’s spreads in text form at right before I’m able to update the chart.
Please feel free to ask any questions; I know it may be confusing! I will be providing updated webinars and more info soon.
Bistro VIX Indicator – Jeff…
Bistro VIX Indicator – Jeff your information on the Vix Indicator – is that a specific Indicator you have or is it your commentary on the action of the VIX ??
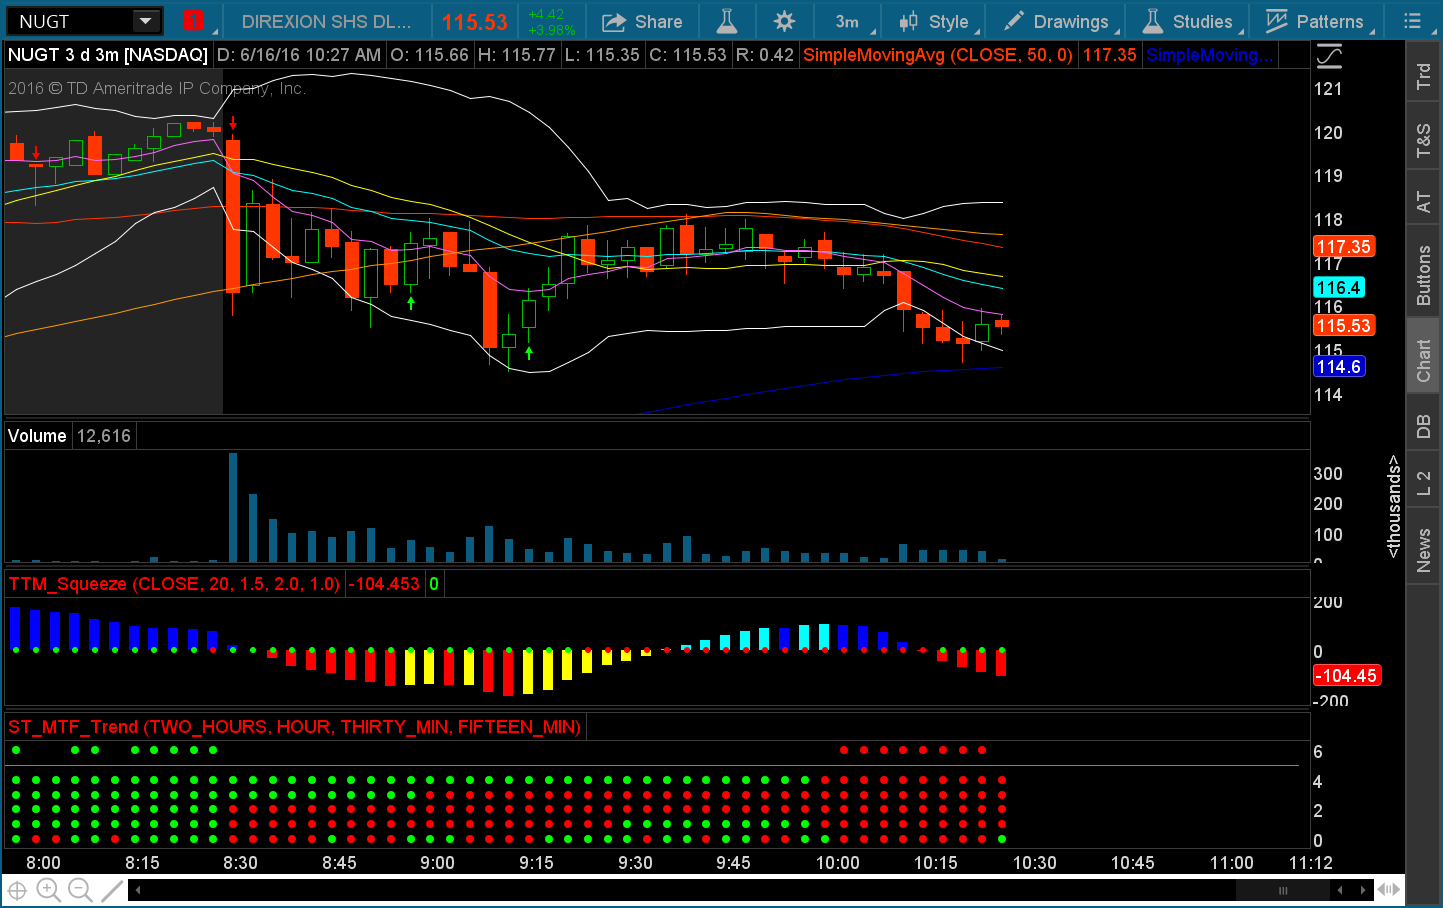
New indicator from John Carter…
Got this recently…seems kinda cool. The red/green dots at the bottom signal bearish or bullish on each of the next 4 higher time frames based on the time frame of the current chart. Haven’t quite figured out exactly how to trade it since I missed most of the webinar Saturday. Hoping to catch up over the weekend…seems like it could be a powerful tool combined with the squeeze indicator.
Downside WARNING fired
#VIXIndicator The Bistro VIX indicator has fired a downside warning. This means there is a high probability of a correction in the coming days or weeks. The VIX has increased 25% within 2 days, hitting 18.30, which is 25% above Thursday’s close. That was the first signal. Then we crossed 18.75, which is 50% above the most recent VIX low (12.50 from April 20th). That was the second signal, and two signals equal a WARNING.
Be leery of the downside, careful with any rolls. Historically, a bigger correction usually occurs after two signals fire; it could be this week, or it could occur weeks from now. To negate this warning, we would need new highs on the S&P (above most recent high of 2120.55, set last week), or the VIX closing three consecutive days below the 78.6% Fib retracement, or 14.32 (based on VIX intraday high of 21.01).
Microsoft to buy LinkedIn for…
Microsoft to buy LinkedIn for $26.2 billion; LNKD shares jump 48%
http://www.cnbc.com/2016/06/13/microsoft-to-buy-linkedin.html
Anyone sold LNKD calls will be deeeeep ITM.
Bistro VIX Indicator for Monday 6/13 (always available in the right-hand column >>> )
Friday’s move in the VIX was the biggest one-day change since January 7th, but fell short of firing a warning signal.
Monday’s signal levels in the VIX that would fire a Downside Warning are 18.30 (25% above 2-day closing low), and 18.75 (50% above Apr 20 low).
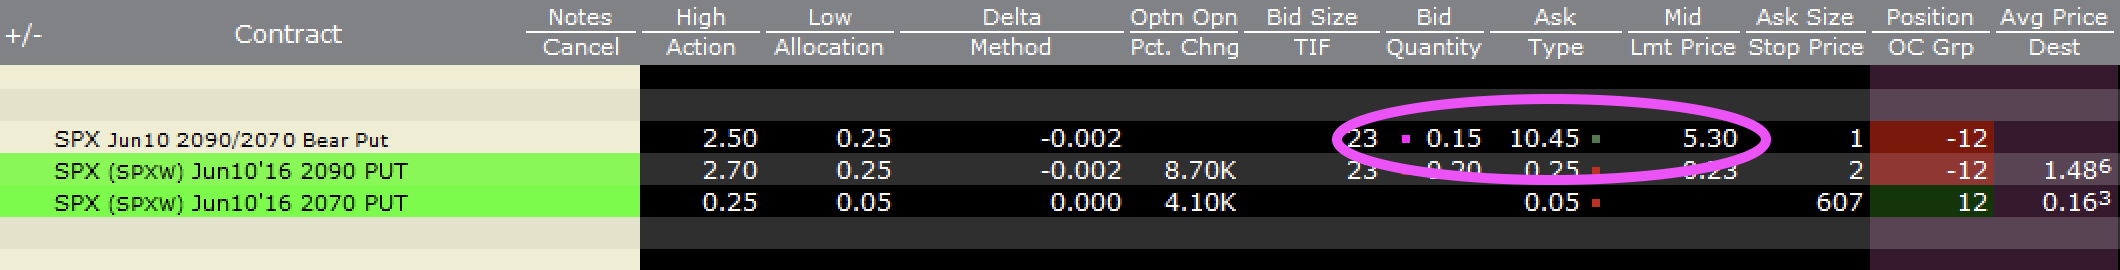
Never use auto-STOPS on spreads
#SPXcampaign Here’s a good example of why you should avoid automated stops on spreads, especially SPX spreads. This is a screen shot from my broker I just took. It’s the spread I sold this morning, 2090/2070. Bid is .15 and ask ia 10.45, so Mid is 5.30! If I had put a 3.00 auto-stop on it, it would have survived the whole day until a few minutes ago. Of course, the bid/ask can get wacky when it’s about to expire in 30 minutes (and also first thing in the morning, and after hours), but this kind of anomaly can happen at any time and slam you out of your spread with a horrible fill.
Tasty Trade discuss Karen
They say they’ll address it more fully when they know more, but here they respond to a caller’s question about Karen (starts about 17:45 in)
https://www.tastytrade.com/tt/shows/talkin-with-tom-and-tony
Tasty Trade response
Tastytrade has taken down the video of Karen’s last interview and put up this notice.
Like many, we are concerned about the SEC investigation into the accounting and reporting practices of Karen Bruton and her firm Hope Advisors. Ms. Bruton is not an employee of tastytrade and last appeared and was interviewed on the network 2 years ago, as a guest. In light of the investigation, we have removed all past videos airing Ms. Bruton for the time being. We at tastytrade believe in full and transparent disclosure by money managers and will continue to advocate on behalf of the retail trading community.
Jack Follick
Karen the SuperTrader maybe not so Super
Looks like Karen had been using In-The-Money Calendars on E-minis to avoid showing losses for about 19 months. You can read section 58 onwards in the SEC filing for an explanation of the trading scheme. Quite sad if it’s true.
http://www.tennessean.com/story/news/2016/05/31/feds-brentwood-firm-schemed-gain-millions-ill-gotten-fees/85211006/
Broker call????
Just had a call from my broker asking me to buy back a spread that was partly in the money. I had today’s $AMZN 702.5/707.5 call spread. The broker said I would have to close it before the bell because the short leg was in the money. Is that right on a spread? I don’t remember ever having to close a spread because one leg was in the money. I thought that was what the other leg was for, to cover that. Any ideas there why? Was it because of the large dollar value of AMZN? Any explanations would be helpful here. I went ahead and closed it, but didn’t really understand why I had to do so.
Adjust Bistro email notifications
Author/Contributors can set preferences for Bistro, to receive (or not receive) emails when someone replies to your post, or other actions. To adjust, click your avatar in upper right of screen and select “Account Settings.” Then select “Notifications” and check the boxes you want.
If you’d like to become an Author/Contributor, just comment below or email me!


#interestRates #Fed – from the…
#interestRates #Fed – from the horse’s mouth
https://www.stlouisfed.org/on-the-economy/2016/may/negative-interest-rates-tax-sheep-clothing
NUGT thoughts and reflections…
Crazy couple weeks with a lot going on with more to come this week…LOL Caught up on the NUGT conversation from the last couple days. Thanks everyone for posting thoughts and ideas.
I closed some of my short call positions on Friday morning (so far I’m up on those trades!) at hopefully temporary losses. Taking a page from Jeff’s SPX book and setting them off to the side until I can find a safer entry point to get back in.
After watching this thing rise 300 percent I’ve thought all weekend about how I maybe could have played this better. I’ve decided to start playing my option selling trades a little more directional sometimes but still with an emphasis on time decay.
For example, when NUGT started breaking out a little in early Feb I started looking at recent resistance to establish some call sales. To my eyes that was up over 50 with the 200ma and a couple short term tops looking like they would hold. Of course hindsight is 20/20 and nobody could have seen a 300 percent run coming. I feel like what I should have done was start selling PUTS on the breakout above the 20ma and using the moving average as a stop. Seems like if I were to add a little directional bias into my sales and get out when I’m obviously wrong might be a safer play in the long run.
I’m certainly open to any thoughts or crticisms on this way of thinking…
Using this theory, I would re-sell my short call positions on NUGT when it starts showing signs of weakness and closes back below some major moving averages and then using those levels as stops if it breaks back above. Basically trading it the way I would trade a stock with entries near support or resistance and then having a nice close “I’m wrong” level. I’d just like to avoid selling a call for a 2 bucks and watching it go to 50! At least then I know what I’m risking and I think I could put on more positions knowing my risk is small and avoiding all the rolling and reverse rolling and margin worries. Of course I’ll never capture the entire move but I’m ok with sacrificing that for some safety.
So for now sitting on the NUGT sidelines (except for my short puts that are still out there) until we get a definite break of the uptrend. Then I’ll jump back in with some call sales possibly closer to the money with a (mental) stop loss level in mind.
I’m thick skinned so tell me if I’m crazy…LOL!
Off to training this week then back home to move my daughter back in for the summer. Happy trading everyone and SVXY and XIV you just keep on doing what you’ve been doing!
VIX indicator
Although we thus far have fallen short of triggering a Downside signal, I’m removing the Upside Warning that’s been in effect since March 15th. It served its purpose, albeit a little late, as the market has remained strong since the Feb 11th low. If we don’t get a downside warning, keep call spreads at 2135 or higher. But if we continue lower, Downside signals are likely to be hit next week (if not today). The first signal is 17.21 (high today so far is 17.09)… if that’s not hit today, it will be adjusted to 18.75 and 19.03 for Monday. I will be looking at taking off at least one put spread today before their stops are hit to reduce downside risk going into weekend.
Does it pay to sell Options before the Weekend?
TT did a study…
https://www.tastytrade.com/tt/daily_recaps/2016-04-27/episodes/selling-options-capturing-weekend-decay-04-27-2016
Follow the link.
New Members! We’d like to see you…
Adding a Picture or Avatar to your Profile.
For Contributor/Authors, to add an avatar or photo by your Posts, click on the profile button in upper right (round button with silhouette). Select “My Profile.” (this is also where you can enter profile info and adjust email notifications). Click on the silhouette. This will take you to a separate site, Gravatar, where you can upload a picture. Once finished there it may take several minutes or hours before your photo will appear in OptionsBistro.
The avatars of all contributors can be found on the right-hand column of this site. —->
By hovering over an avatar, you can see the user’s name and click through to their profile.
If you’d like to become a Contributor, please let me know!
VIX Indicator… Jeff would appreciate…
VIX Indicator… Jeff would appreciate if you would explain how the Tuesday levels are 19.20 and 19.50 as I thought it was 25% above previous days close.
The new Department of Labor Fiduciary Rule
This week, the Department of Labor finally released its new fiduciary rule, which requires investment advisers to put the interests of their clients ahead of those of themselves or the firms for which they work. On the surface this sounds good, and in its final form it may end up being good (no opinion here yet, I don’t know enough about all its ramifications), but the most interesting part from my perspective was the past 12 months of back and forth between the DOL and the financial industry (the OCC was a major force in this) about the proposals to restrict or eliminate trading of options in IRA accounts, restrict educational information from brokers/trading platforms, and prevent entertainment figures like Jim Cramer, Dave Ramsey and Suze Orman from offering specific recommendations or advice to their viewers and listeners.
The most important of the above concerns for me was the restrictions on IRA accounts and the industry responded in a very big way apparently, since the final DOL rule does not affect the ability to trade options (or futures) in IRA accounts. The final rule also spares the restrictions on entertainment personalities so I guess we will continue to hear “buy-buy-buy!” screaming from the TV, so that’s a comfort. There is also still some clarity that needs to be worked out on the issue of how much options education can be offered to IRA account holders by their brokers.
I don’t know if the financial industry won out on this issue because of the sheer weight of the groundswell, or because they were actually able to convince the DOL that many IRA account holders utilize options to reduce risk (covered calls, etc). From what I understand it is a bit of a surprise they ended up completely leaving this issue alone so either way score a victory for the industry in defending something worth defending. However it happened, I believe it ends up being a good thing for retirement account investors.
Some articles:
http://www.businesswire.com/news/home/20160406006592/en/OCC-Gratified-DOL-Fiduciary-Rule-Benefit-Users
http://www.reuters.com/article/us-usa-brokers-fiduciary-options-idUSKCN0X427F
Wall Street Dodged a Bullet on the Retirement Fiduciary Rule
There is also an article that summarizes the issue nicely on Barrons.com if you have access.
Why we trade from the Short Side (mostly)
Most, if not all of us, like to trade predominantly from the short side; do you know why?
The real reason is not that it is easier or that Theta decay works for the position; even though those are all valid.
The real reason is because normally, when trading from the short side we have a better probability to win than when trading from the long side.
Any stock, ETF, or Index can only move in 5 different ways:
1. Fast up
2. Slowly up
3. Stagnant
4. Slowly down
5. Fast down.
When we are short, we win in 3 out of the 5 and possibly even on 4 of the 5; when we are long, we need the underlying to move otherwise we lose, so we only win in 1 out of the 5.
If only I would have known this two years ago!
#Fidelity
FYI #Fidelity I just received an email about my password had been blocked which was odd as I hadn’t been in the account in a week. I call their security and no event had taken place. They suspect this is a phishing event. The logo in the email is identical to theirs so if you see this don’t click on any link. Call them for verification.
The Importance of the Greeks!…
Back when I was taking my first options course, I remember the instructors emphasizing how important the Greeks were in trading options.
The truth is that, at the time, they didn’t look so important to me.
Well, after reviewing a lot of losing trades as well as some small winners, I found that most of my losers and those winners were I made very little, were due to not matching the right strategy with the market conditions; basically, the root of the problem was not watching the Greeks when placing the trades.
The majority of my problems came from trying to fit the wrong strategy for the market conditions at the time. Like selling credit spreads on a low volatility environment; buying options or debit spreads on a high volatility period; Using Iron Condors when the market was running hard. Using debit spreads on a squeeze; using Calendars or Diagonals on decreasing IV periods.
I wonder how much money I would have saved, by just looking at the damned Greeks!
What about you guys; do you watch the Greeks before placing a trade?
SPX expirations? Can never remember…
SPX expirations? Can never remember this, but does the monthly expiration occur on Friday morning and the weeklys on Friday afternoon at the close?
$GMCR – just a little…
$GMCR – just a little story about what happens when a company that has options gets bought out for CASH –
Last December GMCR announced that they were being acquired. I got crushed on some short calls so I decided to try and make some of that back.
I sold some long term puts for whatever I could get for them, knowing that they would go away once the merger was completed.
I covered the Jan 2018 puts a few weeks ago at 0.02. The ones below I kept –
GMCR Jan 20 2017 70.0 Puts – Sold at an average of 1.50
GMCR Jan 20 2017 75.0 Puts – Sold at an average of 1.50
GMCR Jun 17 2016 70.0 Puts – Sold at an average of 1.00
The expiration dates have all been adjusted so they expire this Friday.
It’s nice to know that it worked the way I expected it would.
What to do when an Option Trade goes against you?
This is an interesting article from Dough Trading.
https://www.dough.com/blog/managing-options-trades
Jeff, I believe that this is something to look at when dealing with the SPX trades.
When it is Best to Sell an Option and to take Profits.
A nice segment from the guys at Tasty Trade covering time decay and the why they do what they do when selling options.
https://www.tastytrade.com/tt/daily_recaps/2016-03-11/episodes/tips-for-new-traders-the-role-of-time-decay-03-11-2016
It explains why they get out with 50% profit on all short options.
Why they prefer selling higher IV options.
And why they go out 45 days when selling OTM options.
Very interesting.
#OOps
Looks like I accidentally deleted a thread on $NUGT
Searching on Bistro
There are multiple ways to Search for past Posts on Bistro, including stock symbols, hashtags, strategies, by date, by Contributor.

Are SPX Dailys next?
#SPXcampaign I have joked for awhile that with the advent of weeklys we would eventually see “Dailys”, where stocks like AAPL and SPY and indices like SPX will have different options series expiring EVERY trading day. Well, it looks like we’re getting closer to that craziness…. (thanks to @alsumde for bringing this to my attention):
Extended Listings For Equity, ETF, ETN And Index Weeklys Options. Check Wednesday rule starting on 2/23/2016
In January 2014 CBOE issued Regulatory Circular RG14-010 re: “Expansion of Number of Expirations Listed in S&P 500 Index Weeklys Options (SPXW).” The circular provides that CBOE will list out and maintain six consecutive SPXW expirations at once, not counting the current expiration.
SPX Weeklys options (part of SPXW) are options that are listed to provide expiration opportunities every week. SPX Weeklys expiring at the end of each week (End of Week – EOW) are typically listed on Thursdays and expire on Fridays. As of February 23, 2016, CBOE began offering Wednesday Weeklys (also part of SPXW), which are typically listed on Tuesdays and expire the following Wednesday. (Note that EOW Weeklys or Wednesday Weeklys are not listed if either would correspond with a currently listed option, i.e. regular 3rd Friday or SPX End of Month – EOM options).
SPX Weeklys are PM-settled on the last trading day, typically a Friday for SPX EOW Weeklys, or a Wednesday for SPX Wednesday Weeklys. As with other PM-settled index options, the exercise-settlement value is calculated using the last (closing) reported sales price in the primary market of each component stock. On the last trading day, trading in expiring SPX Weeklys closes at 3:00 p.m. (Chicago time). All non-expiring SPX Weeklys continue to trade until 3:15 p.m. (Chicago time). For standard PM-settled, S&P 500 options that expire on 3rd Fridays, see ticker SPXPM.
These options are already tradeable at Interactive Brokers. They will be nice to use for rolls or occasional short-term spreads. This morning I sold the 1850/1825 spread for 1.35… got up toward 2.00, now is only .70. With the Wednesday options, there will be more opportunities for short-termers in these volatile markets.
OptionsBistro available on mobile phones or tablets…
Just add the WordPress app to your mobile device! #Welcome

Margin
I wanted to get some insight with those on regular 3 to 1 Margin accounts with under 50k.
When selling naked calls/puts (especially calls right now) on NUGT/UVXY what is the max number of calls you sell?
Also, how did you fare in August with margin requirements when UVXY went from 40s to 90 in 2 days. For example, a 170 Jan 2017 call or March 165 call, even though way otm would triple or quadruple on the next big selloff.
Were you able to maintain those positions with say 25k in the account or should spreads be the call sale of choice.
Any insight as to how best play the #vxxgame with a smaller 3-1 margin account would be great.
Add your photo, change your screen name, and more…
For Member/Contributors, just wanted to repost details on Adding a Photo/Avatar. You can also change your Public Display Name…
To add an avatar or photo by your Posts, click on the profile button in upper right (round button with silhouette). Select “My Profile.” (this is also where you can enter profile info, including Public Display Name, and adjust email notifications). Click on the silhouette. This will take you to a separate site, Gravatar, where you can upload a picture. Once finished there it may take several minutes or hours before your photo will appear in OptionsBistro.
The avatars of all contributors can be found on the right-hand column of this site. —->
By hovering over an avatar, you can see the user’s name and click through to their profile.
If you’d like to become a Member/Contributor, please let me know via email, jpayne.rdb@gmail.com
CBOE To Begin Overnight Dissemination…
CBOE To Begin Overnight Dissemination Of CBOE Volatility Index (VIX) – Date 02/02/2016
- Will Provide Additional Real-Time Volatility Information When News Breaks Overnight
- Will Enable Overseas Investors to Reference VIX Index During Their Regular Trading Hours
The Chicago Board Options Exchange® (CBOE®) today announced that it plans to begin overnight dissemination of the CBOE Volatility Index® (VIX® Index) in March.
Values for the VIX Index are expected to be published every 15 seconds during CBOE’s extended trading hours session for VIX and S&P 500® Index (SPX) options, which runs from 2:00 a.m. to 8:15 a.m. CT.
TradeKing is TradeByeBye
Thanks for those who gave input yesterday. I’m now moving out of TradeKing and into TDAmeritrade. Still having trouble today after their computer upgrades over the weekend. Opened new account and now waiting for things to transfer over.
TradeKing is TradePeasant today!
Anyone use TradeKing? I have had no problems until this weekend when they decided to upgrade their servers, etc. It was down all weekend so couldn’t check anything. Today, sometimes up and mostly down. Can’t place any online trades. Ouch.
Any suggestions? Am looking at TDAmeritrade with account via TastyTrade. Still will pay more costs than TradeKing, but it may be worth it for the extras you get.
Thoughts?
Scheduling your Posts, View videos, and more
For Contributor/Authors, you can use you Dashboard to set Posts for a future time or date, as well as access other settings and features.
Use a separate browser window and enter optionsbistro.wordpress.com/wp-admin. On the left you have multiple options for managing your posts, including “Posts/Add New.” Here you can add new Posts as you do on the normal site, but you also have access to many additional features, such as selecting Categories for your post, and also scheduling your post to appear at a later time (see “Publish immediately Edit” on the right).
Contributor/Authors also have exclusive access to past video Webinars by going to the Media section. Currently, the only one there is the Contango ETF Webinar.
I recommend saving this Admin/Dashboard on a separate bookmark/favorite right next to the main site, which is simply OptionsBistro.com.
If you’d like to become a Contributor/Author, reply below or email me and I’ll send you an invitation! #Welcome
Heading south…
Today my wife and I start the drive to Los Angeles to prepare our North Hollywood house for sale.
The last two times we drove to LA were October 2014, and late Jan/early Feb 2014. For those with fuzzy memories, a quick look at the charts shows what happened to the markets. I know there are so many traders who claim their travels cause the markets to dive…. I won’t claim that, but felt obliged to warn you.
I will still be trading next week and managing Bistro, although may not be as quick to respond.
