STO March 6, 160 puts at 1.21
STO SPY 315 puts at 1.30 for February 7 expiration
STO March 6, 160 puts at 1.21
STO SPY 315 puts at 1.30 for February 7 expiration
STO March 20, 40 calls at 3.02, I will be assigned the $40 puts on the Friday expiration. I still like this for the long term.
#ContangoETFs Sold $DRIP June 19th 150 calls for 12.75.
STC Jan 31 490/492.50 call spread #supercharger Paid 1.35 sold for 2.49
Sold $FB 3/20 200/190 bull put spread @ 1.96
#jadelizard After FB’s drop opened a JadeLizard 195/212.5/215 March13 for 3.31, can get better now
#Earnings $AMZN reports tonight. Below are details on earnings one-day moves over the last 12 quarters.
Oct. 24, 2019 AC -1.09%
July 25, 2019 AC -1.55%
April 25, 2019 AC +2.54%
Jan. 31, 2019 AC -5.38%
Oct. 25, 2018 AC -7.81% Biggest DOWN
July 26, 2018 AC +0.51%
April 26, 2018 AC +3.60%
Feb. 1, 2018 AC +2.87%
Oct. 26, 2017 AC +13.21% Biggest UP
July 27, 2017 AC -2.48%
April 27, 2017 AC +0.71%
Feb. 2, 2017 AC -3.54%
Avg (+ or -) 3.77%
Bias 0.13%, no significant bias on earnings.
With stock at 1865.00 the data suggests these ranges:
Based on current IV (expected move into Friday per TOS): 1798.07 to 1931.93
Based on AVERAGE one-day move over last 12 quarters: 1794.61 to 1935.39
Based on MAXIMUM one-day move over last 12 Q’s (13.2%): 1618.63 to 2111.37
Based on DOWN max only (-7.8%): 1719.34
Open to requests for other symbols.
#ShortPuts #Earnings – Gonna be out all day so not even messing with it…
Bought to Close TSLA FEB 07 2020 480.0 Put @ .41 (sold for 5.35)
I didn’t see this earlier but in going through the activity I see that I was filled on selling $HES 3/20 52.50 puts @ 1.15. With more downside tomorrow am I might add the 50 puts if the premium goes over $1.
#SPX1dte Expired: $SPX Jan 29th 3195/3215-3320/3340 condors, sold for 1.00 yesterday.
#Earnings A cheap long shot: Bought to open $TSLA Jan 31st 592.5/600/607.5 #CallButterfly for .281 (avg price).
Sold $EWZ 3/20 42/48 strangle @ 1.29 with the stock around 45. Deltas at 24 on both sides.
STO Feb. 21, 73.5 puts at 2.20, Stock is breaking out and trading at 77
#Earnings BTC $AAPL Jan 31st 335/337.5 call spreads for .149 (avg price). Sold condors yesterday for .61. I’m letting 290/287.5 put side expire.
Sold Feb. 21, 202.50/207.50/240/245 for 1.46, outside the Average moves provided by Jeff (thank you).
#tastytradefollow
#Earnings $TSLA reports tonight. Below are details on earnings one-day moves over the last 12 quarters.
Oct. 23, 2019 AC +17.66% Biggest UP
July 24, 2019 AC -13.61% Biggest DOWN
April 24, 2019 AC -4.26%
Jan. 30, 2019 AC -0.56%
Oct. 24, 2018 AC +9.13%
Aug. 1, 2018 AC +16.18%
May 2, 2018 AC -5.54%
Feb. 7, 2018 AC -8.62%
Nov. 1, 2017 AC -6.79%
Aug. 2, 2017 AC +6.50%
May 3, 2017 AC -5.00%
Feb. 22, 2017 AC -6.40%
Avg (+ or -) 8.35%
Bias -0.11%, no significant bias on earnings.
With stock at 586.50 the data suggests these ranges:
Based on current IV (expected move into Friday per TOS): 524.30 to 648.70
Based on AVERAGE one-day move over last 12 quarters: 537.73 to 635.77
Based on MAXIMUM one-day move over last 12 Q’s (17.7%): 483.13 to 690.37
Based on DOWN max only (-13.6%): 506.89
Open to requests for other symbols.
#JadeLizards #Earnings – In a different account I’m taking a shot at an extremely bearish Jade Lizard. Playing for a down move of at least half the expected move. Selling a put at an even number and selling a very DITM bear call spread. No upside risk here…
Sold TSLA JAN 31 2020 500/545/555 Jade Lizard @ 10.05
Jeff, what is the typical expected profit % on a DC?
BTC $LK 2/7/2020 30 puts @0.35. Was STO 1/27 @1.05.
Thanks @fuzzballl
#Earnings $HSY reports tomorrow morning. Below are details on earnings one-day moves over the last 12 quarters.
Oct. 24, 2019 BO -2.23%
July 25, 2019 BO +2.01%
April 25, 2019 BO +4.58%
Jan. 31, 2019 BO +0.49%
Oct. 25, 2018 BO -4.92%
July 26, 2018 BO +7.35% Biggest UP
April 26, 2018 BO -0.26%
Feb. 1, 2018 BO -5.94% Biggest DOWN
Oct. 26, 2017 BO -5.27%
July 26, 2017 BO -1.34%
April 26, 2017 BO -0.88%
Feb. 3, 2017 BO +1.31%
Avg (+ or -) 3.05%
Bias -0.43%, negative bias on earnings.
With stock at 151.50 the data suggests these ranges:
Based on current IV (expected move into Friday per TOS): 145.75 to 157.25
Based on AVERAGE one-day move over last 12 quarters: 146.88 to 156.12
Based on MAXIMUM one-day move over last 12 Q’s (7.4%): 140.36 to 162.64
Based on DOWN max only (-5.9%): 142.50
Open to requests for other symbols.
#earnings TSLA
I’m in a real mess with TSLA. I have an inverted 300/430 Feb. 21 strangle from Oct. earnings. I’ve taken in $6880 in premium after several rolls. I’m essentially hedging with these two trades.
Sold a Feb. 21, 570 put for 3726 and bought a Feb. 21, 580/595 call spread for 6.35.
I’m open for other ideas.
Closing early…SQ Feb 20 65 Put @.15….STO 1/16 @.96
BTC $TSLA 1/31/2020 445/455 #BuPS @0.25. Was STO @2.06 on 1/13.
#ShortPuts #Earnings – Going out a week and selling 1.5x the expected move. Hard to believe but this is still above the 50ma…
Sold TSLA FEB 07 2020 480.0 Put @ 5.35
What would I really like to see? Stock down 50 and still book a nice winner here. Immediately sell another one a lot lower in Feb monthly. We can dream can’t we? 🙂 🙂
#earnings #closing #jadelizard SQ
This goes back to Aug. 1, sold a jade lizard with a short 75 put, SQ was at about 81. It dropped into the 50s in Sept. and Oct.
Bought Feb. 21, 75 put for a gain after many trades over 6 months.
Now what to do with a disastrous TSLA position.
#ShortPuts – Thanks @Ramie !
Sold AMD FEB 28 2020 42.0 Puts @ .72
#Earnings It’s going in the wrong direction, so gotta close.
Sold to close $MCD Jan31/Feb07 212.5 #DoubleCalendar for 1.151 (avg price). Bought yesterday for .839
#Earnings $FB reports tonight. Below are details on earnings one-day moves over the last 12 quarters.
Oct. 30, 2019 AC +1.80%
July 24, 2019 AC -1.93%
April 24, 2019 AC +5.84%
Jan. 30, 2019 AC +10.81% Biggest UP
Oct. 30, 2018 AC +3.80%
July 25, 2018 AC -18.96% Biggest DOWN
April 25, 2018 AC +9.06%
Jan. 31, 2018 AC +3.31%
Nov. 1, 2017 AC -2.04%
July 26, 2017 AC +2.91%
May 3, 2017 AC -0.62%
Feb. 1, 2017 AC -1.79%
Avg (+ or -) 5.24%
Bias 1.02%, positive bias on earnings.
With stock at 220.00 the data suggests these ranges:
Based on current IV (expected move into Friday per TOS): 208.85 to 231.15
Based on AVERAGE one-day move over last 12 quarters: 208.47 to 231.53
Based on MAXIMUM one-day move over last 12 Q’s (19.0%): 178.29 to 261.71
Based on UP max only (+10.8%): 243.78
Open to requests for other symbols.
#Earnings $MSFT reports tonight. Below are details on earnings one-day moves over the last 12 quarters.
Oct. 23, 2019 AC +1.96%
July 18, 2019 AC +0.14%
April 24, 2019 AC +3.31%
Jan. 30, 2019 AC -1.83% Biggest DOWN
Oct. 24, 2018 AC +5.84%
July 19, 2018 AC +1.79%
April 26, 2018 AC +1.65%
Jan. 31, 2018 AC -0.78%
Oct. 26, 2017 AC +6.41% Biggest UP
July 20, 2017 AC -0.57%
April 27, 2017 AC +0.27%
Jan. 26, 2017 AC +2.34%
Avg (+ or -) 2.24%
Bias 1.71%, positive bias on earnings.
With stock at 166.50 the data suggests these ranges:
Based on current IV (expected move into Friday per TOS): 160.28 to 172.72
Based on AVERAGE one-day move over last 12 quarters: 162.77 to 170.23
Based on MAXIMUM one-day move over last 12 Q’s (6.4%): 155.83 to 177.17
Based on DOWN max only (-1.8%): 163.45
Open to requests for other symbols.
Sold $AMD 3/20 42 puts @ 1.20. Delta 23. Stock down today after earnings, currently 47.15. Strike is another 11% lower, well below the 50 day moving average.
Sold $BA 2/21 290/300/340/350 iron condor for 2.58 with the stock at 322.66. Put and call short strikes are 17 and 21.
#coveredcalls
$LK BTC 3/20 50 call at 2.80. STO on 1/14 for 6.60.
#shortstrangle
$LK STO 1/31 41 call/37 put at 1.73. The call is covered
#SPX1dte Sold to Open $SPX Jan 29th 3195/3215-3320/3340 condors for 1.00, IV 14.62%, SPX 3280. Short deltas -.06, .06
#ShortPuts – I’ll take it for a one night stand…
Bought to Close LK FEB 7 2020 30.0 Puts @ .45 (sold for 1.01)
#bups
$STO 2/21 212.50/222.50 BUPS at 2.90. Earnings 2/13
#Earnings $MCD reports tomorrow morning. Below are details on earnings one-day moves over the last 12 quarters.
Oct. 22, 2019 BO -5.04% Biggest DOWN
July 26, 2019 BO +0.53%
April 30, 2019 BO +0.22%
Jan. 30, 2019 BO -0.21%
Oct. 23, 2018 BO +6.31% Biggest UP
July 26, 2018 BO -1.73%
April 30, 2018 BO +5.77%
Jan. 30, 2018 BO -2.97%
Oct. 24, 2017 BO +0.33%
July 25, 2017 BO +4.75%
April 25, 2017 BO +5.56%
Jan. 23, 2017 BO -0.71%
Avg (+ or -) 2.84%
Bias 1.07%, positive bias on earnings.
With stock at 212.00 the data suggests these ranges:
Based on current IV (expected move into Friday per TOS): 205.74 to 218.26
Based on AVERAGE one-day move over last 12 quarters: 205.97 to 218.03
Based on MAXIMUM one-day move over last 12 Q’s (6.3%): 198.62 to 225.38
Based on DOWN max only (-5.0%): 201.32
Open to requests for other symbols.
#coveredcalls
$ROKU STO 1/31 130 calls at 2.16
#shortputs
$IIPR STO 3/20 75 put at 1.80 Hope this is better late than never. Thanks @jsd501
#Earnings Sold to Open $AAPL Jan 31st 287.5/290-335/337.5 condors for .61. Short strikes outside of previous max moves.
#Earnings $AAPL reports tonight. Below are details on earnings one-day moves over the last 12 quarters.
Oct. 30, 2019 AC +2.26%
July 30, 2019 AC +2.04%
April 30, 2019 AC +4.90%
Jan. 29, 2019 AC +6.83% Biggest UP
Nov. 1, 2018 AC -6.63% Biggest DOWN
July 31, 2018 AC +5.89%
May 1, 2018 AC +4.41%
Feb. 1, 2018 AC -4.33%
Nov. 2, 2017 AC +2.61%
Aug. 1, 2017 AC +4.72%
May 2, 2017 AC -0.30%
Jan. 31, 2017 AC +6.09%
Avg (+ or -) 4.25%
Bias 2.37%, positive bias on earnings.
With stock at 312.50 the data suggests these ranges:
Based on current IV (expected move into Friday per TOS): 294.74 to 330.26
Based on AVERAGE one-day move over last 12 quarters: 299.22 to 325.78
Based on MAXIMUM one-day move over last 12 Q’s (6.8%): 291.16 to 333.84
Based on DOWN max only (-6.6%): 291.78
Open to requests for other symbols.
#SPX1dte Bought to open $SPX Jan 31st 3200/3180 put spreads for 2.65.
#coveredcalls
$ROKU BTC 1/31 144 calls and STO 1/31 135 calls at added .63 credit
$NUGT BTC 1/31 33.50 calls and STO 2/7 34.50 calls at even
$ZM BTC 1/31 75 calls and STO 1/31 73 calls at added .45 credit
#spx1dte
$SPX 1/27 3195/3215/3330/3350 STO for 1.05. I was away and didn’t know how frightened
I should have been. Thank you @jeffcp66
#VIXindicator The $VIX closed well over 25% higher than Thursday’s close (2-day closing low) so a Downside Warning took effect. Highest VIX readings since October 10th. Expect further downside in the market in the coming days or weeks.
#VXXGame Bought $UVXY March 20th 35 calls for .31. Adding more longs to sell against. Already sold March 25 calls last week, as well as VXX March 25 calls.
I haven’t started selling yet. I’m going to wait for higher volatility…. that may mean I miss out on this current pop, but that’s okay. I’d prefer to wait and possibly miss out, than sell in the early days of a bigger correction.
#ShortPuts – I’ll join in. This should be before earnings by a week or two but I’m not sure…
Sold LK FEB 7 2020 30.0 Puts @ 1.01
LK STO 1/31/20 35.0 PUTS @1.40
LK STO 1/31/20 39.5 CALLS @1.95
LK STO 1/31/20 40.0 CALLS @1.55
LK STO 1/31/20 40.5 CALLS @1.35
LK ST0 2/7/20 43.0 CALLS @1.50
LK BTC 1/31/20 47.5 CALLS @.05
LK STO 1/31/20 30.5 PUTS @.55
GDX STC STOCK 229.23
Question about stop orders for long stock positions.
Do you use any stop orders for long stock positions?
Some recommend 5-10% below purchase price.
I tend to hold for too long…
LK
STO LK Feb21’20 23 PUT @1.05
#Earnings $MMM reports tomorrow morning. Below are details on earnings one-day moves over the last 12 quarters.
Oct. 24, 2019 BO -4.07%
July 25, 2019 BO -0.71%
April 25, 2019 BO -12.94% Biggest DOWN
Jan. 29, 2019 BO +1.94%
Oct. 23, 2018 BO -4.37%
July 24, 2018 BO +0.92%
April 24, 2018 BO -6.83%
Jan. 25, 2018 BO +1.88%
Oct. 24, 2017 BO +5.91% Biggest UP
July 25, 2017 BO -5.05%
April 25, 2017 BO +0.46%
Jan. 24, 2017 BO -1.42%
Avg (+ or -) 3.88%
Bias -2.02%, negative bias on earnings.
With stock at 177.50 the data suggests these ranges:
Based on current IV (expected move into Friday per TOS): 169.30 to 185.70
Based on AVERAGE one-day move over last 12 quarters: 170.62 to 184.38
Based on MAXIMUM one-day move over last 12 Q’s (12.9%): 154.53 to 200.46
Based on UP max only (+5.9%): 187.99
Open to requests for other symbols.
STO $LULU Feb 21 2020 212.5/222.5 #BuPS @1.4. Stock @235, 25 days to expire, Short option 22 delta, earnings 3/25.
#Earnings $WHR reports tonight. Below are details on earnings one-day moves over the last 12 quarters.
Oct. 22, 2019 AC +0.95%
July 22, 2019 BO +0.10%
April 22, 2019 AC +0.40%
Jan. 28, 2019 AC +9.66% Biggest UP
Oct. 24, 2018 AC +6.78%
July 23, 2018 AC -14.52% Biggest DOWN
April 23, 2018 AC +3.75%
Jan. 24, 2018 AC +2.30%
Oct. 23, 2017 AC -10.54%
July 26, 2017 AC -6.28%
April 25, 2017 BO +3.51%
Jan. 26, 2017 BO -8.54%
Avg (+ or -) 5.61%
Bias -1.04%, negative bias on earnings.
With stock at 147.00 the data suggests these ranges:
Based on current IV (expected move into Friday per TOS): 138.29 to 155.71
Based on AVERAGE one-day move over last 12 quarters: 138.75 to 155.25
Based on MAXIMUM one-day move over last 12 Q’s (14.5%): 125.66 to 168.34
Based on UP max only (+9.7%): 161.20
Open to requests for other symbols.
#Earnings $FFIV reports tonight. Below are details on earnings one-day moves over the last 12 quarters.
Oct. 23, 2019 AC +5.50%
July 24, 2019 AC -0.65%
April 24, 2019 AC -1.08%
Jan. 23, 2019 AC -2.22%
Oct. 24, 2018 AC +6.10% Biggest UP
July 25, 2018 AC +1.07%
April 25, 2018 AC +0.89%
Jan. 24, 2018 AC -5.05%
Oct. 25, 2017 AC +3.97%
July 26, 2017 AC -7.16%
April 26, 2017 AC -7.50%
Jan. 25, 2017 AC -8.25% Biggest DOWN
Avg (+ or -) 4.12%
Bias -1.20%, negative bias on earnings.
With stock at 131.00 the data suggests these ranges:
Based on current IV (expected move into Friday per TOS): 123.15 to 138.85
Based on AVERAGE one-day move over last 12 quarters: 125.60 to 136.40
Based on MAXIMUM one-day move over last 12 Q’s (8.3%): 120.19 to 141.81
Based on UP max only (+6.1%): 138.99
Open to requests for other symbols.
#ShortPuts – Staying small. Starters in TQQQ and SOXL. Adding one to UDOW.
Sold TQQQ FEB 28 2020 80.0 Put @ 2.31
Sold SOXL FEB 21 2020 190.0 Put @ 2.50
Sold UDOW MAR 20 2020 100.0 Put @ 2.48
STO March 20, 175 put at 6.90, stock is at 195
#BearCallSpreads – Added one…
Sold DRIP MAR 20 2020 140.0/180.0 Bear Call Spread @ 2.35
#BearCallSpreads – Taking some risk off with pretty good profits. Still short a few at lower strikes in Feb and a sizable position in March.
Bought to Close UVXY FEB 21 2020 18.0/30.0 Bear Call Spreads @ .44 (sold for .86)
Bought to Close UVXY FEB 21 2020 20.0/30.0 Bear Call Spreads @ .28 (sold for .80)
STO March 20, 90 puts at 4.44, stock at 102.73
#SPX1dte Bought to close $SPX Jan 27th 3215/3195 put spreads for 1.95. Condors sold for 1.15 on Friday.
Interactive Brokers
Is anyone using IB Securities Lending Program?
What is your opinion about it?
Interesting little 25 minute video. A couple of our guys in the simulator showing some of the issues…
#OptionsExpiration – No expirations but one assignment. SQ getting called away at 63.50. Was originally assigned the stock at 76.00 during an earnings implosion. Rode it all the way to 55 selling calls. Gone now with a very satisfying profit of .15 LOL
So long I’ll see ya next time!!
#SPX1dte Sold to Open $SPX Jan 27th 3195/3215-3330/3350 condors for 1.15. IV 11.20%, SPX 3290.
Expiring (a little sweaty) Jan 24th 3265/3285-3350/3370, sold yesterday for .80
#BearCallSpreads – Thanks @Jeff ! Starter position looking to add for about 2.00…
Sold DRIP MAR 20 2020 140.0/180.0 Bear Call Spread @ 1.60
Sold $UAL 3/20 75/90 strangle @ 2.32 with the stock at 81.77. Delta neutral with the strikes around 21 delta. Will adjust if the stock makes any more big moves.
#Earnings Sold to close $CTXS Jan24/Jan31 119 #DoubleCalendar for .05. Bought for .47 on Wednesday. I had three Dub Cal orders working that day. This was the only one that filled, and the only of the three that was a loser! (I closed only the call side. Long puts are a lottery ticket for next week)
#ShortPuts – Filled on another one. This is where I’d really like to build a position…
Sold XBI MAR 20 2020 80.0 Put @ 1.00
#BearCallSpreads – Adding a couple…
Sold UVXY MAR 20 2020 15.0/30.0 Bear Call Spreads @ .95
#ShortPuts – Starter position..
Sold XBI FEB 21 2020 85.0 Put @ 1.05
#ShortPuts – Back in again…
Sold ISRG FEB 14 2020 557.5 Put @ 3.12
#ShortPuts #Earnings – Small winner. Looking for a re-entry now.
Bought to Close ISRG JAN 24 2020 595.0 Put @ 2.30 (sold for 3.00)
#ContangoETFs Sold $DRIP March 125 calls for 3.25. This one is on a steady uptrend.
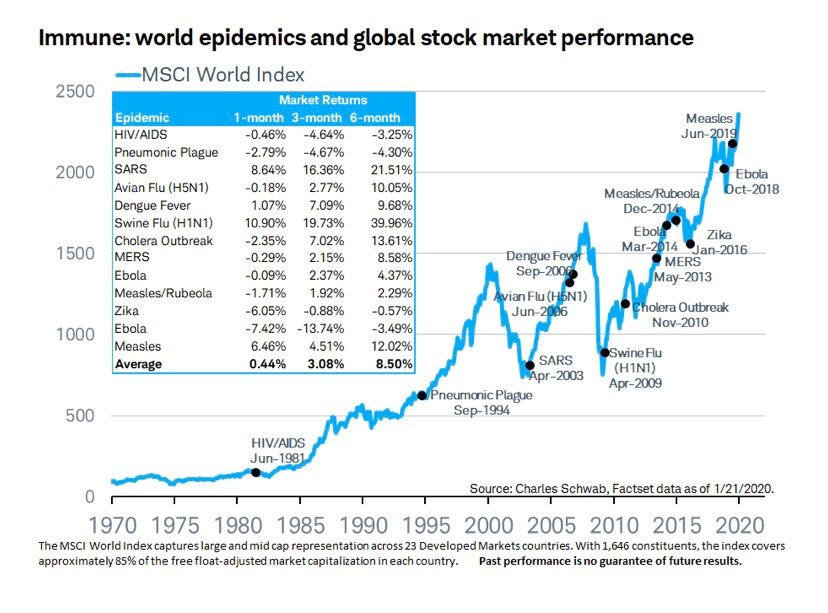
Oil is on track for its worst week since May on fears coronavirus will hit growth. https://t.co/dRu3RW8mqW
— CNBC (@CNBC) January 24, 2020