
#ShortCalls – Booking and adding…
Bought to Close UVXY FEB 21 2020 13.0 Calls @ .02 (sold for .72)
Sold UVXY MAR 13 2020 12.5 Calls @ .95
#ShortCalls – Booking and adding…
Bought to Close UVXY FEB 21 2020 13.0 Calls @ .02 (sold for .72)
Sold UVXY MAR 13 2020 12.5 Calls @ .95
STO April 17, 30 puts at .63
#Earnings $DE reports tomorrow morning. Below are details on earnings one-day moves over the last 12 quarters.
Nov. 27, 2019 BO -4.29%
Aug. 16, 2019 BO +3.84%
May 17, 2019 BO -7.65% Biggest DOWN
Feb. 15, 2019 BO -2.11%
Nov. 21, 2018 BO +2.42%
Aug. 17, 2018 BO +2.35%
May 18, 2018 BO +5.74%
Feb. 16, 2018 BO +1.57%
Nov. 22, 2017 BO +4.32%
Aug. 18, 2017 BO -5.37%
May 19, 2017 BO +7.30% Biggest UP
Feb. 17, 2017 BO +1.00%
Avg (+ or -) 4.00%
Bias 0.76%, positive bias on earnings.
With stock at 165.00 the data suggests these ranges:
Based on current IV (expected move into Friday per TOS): 158.30 to 171.70
Based on AVERAGE one-day move over last 12 quarters: 158.41 to 171.59
Based on MAXIMUM one-day move over last 12 Q’s (7.7%): 152.38 to 177.62
Based on UP max only (+7.3%): 177.05
Open to requests for other symbols.
#Earnings $OLED reports tonight. Below are details on earnings one-day moves over the last 12 quarters.
Oct. 30, 2019 AC +15.27%
Aug. 1, 2019 AC -1.64%
May 2, 2019 AC +8.76%
Feb. 21, 2019 AC +23.03%
Nov. 1, 2018 AC -20.50% Biggest DOWN
Aug. 9, 2018 AC +13.54%
May 3, 2018 AC +12.43%
Feb. 22, 2018 AC -15.81%
Nov. 2, 2017 AC +9.52%
Aug. 3, 2017 AC -1.30%
May 4, 2017 AC +23.87% Biggest UP
Feb. 23, 2017 AC +20.08%
Avg (+ or -) 13.81%
Bias 7.27%, strongly positive bias on earnings.
With stock at 177.50 the data suggests these ranges:
Based on current IV (expected move into Friday per TOS): 159.33 to 195.67
Based on AVERAGE one-day move over last 12 quarters: 153.41 to 202.59
Based on MAXIMUM one-day move over last 12 Q’s (23.9%): 135.51 to 220.49
Based on DOWN max only (-20.5%): 141.51
Open to requests for other symbols.
Morgan Stanley has agreed a $13bn all-stock deal to buy online trading platform ETrade, in a sharp escalation of the battle for the US wealth management market.
Question about owning dividend stocks vs. selling options on the same stocks.
A question came up about returns and benefits of owning dividend paying stocks.
Some argue that holding dividend stocks is a passive strategy that nets 3-5% dividend + possible stock price increase.
On the other hand, selling premium in the same stocks can possibly net 10% per year, while providing a lot of flexibility, like staying out of earnings, using different strategies, etc..
Considering similar risk and possibly lower returns, is it worth it to own dividend stocks?
What is your oppinion?
#SPX1dte BTC $SPX Feb 21st 3395 calls for .30. Condors sold for .95 yesterday.
#Earnings $SEDG reports tonight. Below are details on earnings one-day moves over the last 12 quarters.
Nov. 6, 2019 AC -0.01%
Aug. 6, 2019 AC +25.11% Biggest UP
May 6, 2019 AC +22.69%
Feb. 20, 2019 AC +1.46%
Nov. 1, 2018 AC -7.99%
Aug. 2, 2018 AC -13.94% Biggest DOWN
May 9, 2018 AC +16.53%
Feb. 14, 2018 AC +24.25%
Nov. 8, 2017 AC +19.38%
May 9, 2017 AC +11.04%
Feb. 14, 2017 AC +4.15%
Nov. 9, 2016 AC -0.71%
Avg (+ or -) 12.27%
Bias 8.50%, strongly positive bias on earnings.
With stock at 123.50 the data suggests these ranges:
Based on current IV (expected move into Friday per TOS): 108.93 to 138.07
Based on AVERAGE one-day move over last 12 quarters: 108.34 to 138.66
Based on MAXIMUM one-day move over last 12 Q’s (25.1%): 92.49 to 154.51
Based on DOWN max only (-13.9%): 106.28
Open to requests for other symbols.
Jeff – if you get a chance – SEDG has earnings tonight, I believe.
BTC March 20, 184 calls at .30 cents, sold at 2.42
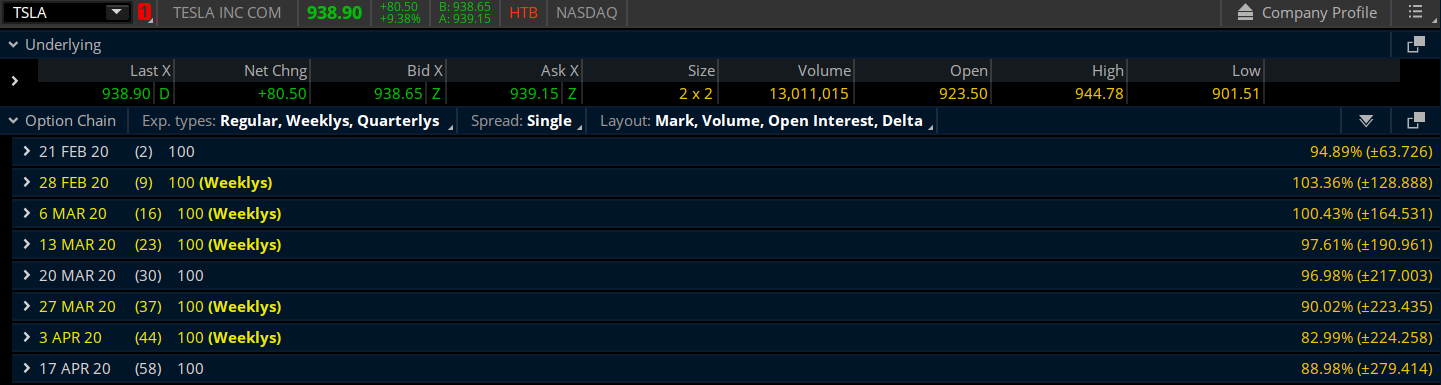
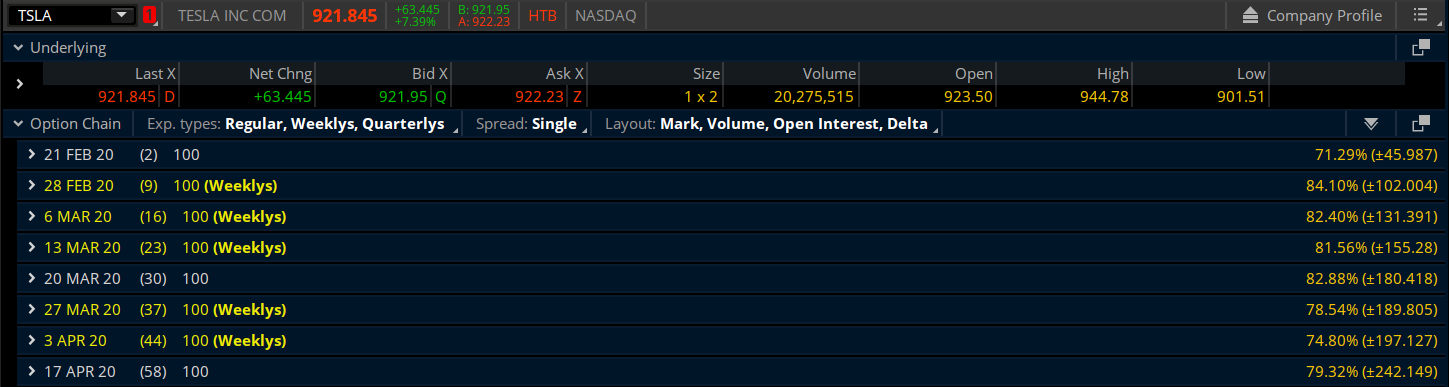
Was wondering why my TSLA short put roll was doing so well already even with a down move in the stock. Out of curiosity I took a screen shot of the IV right after the roll this morning. Compared that to one from just a few minutes ago. Interesting! I’ve always read that a massive upside move can increase volatility similar to a big downside move. This is a rare time where you can really see it. 3 hour time difference here…
#JadeLizards #Earnings – Absolutely do not trust this one so playing a Jade Lizard way to the downside with breakeven at almost 2x the expected move. No upside risk but definitely need a down move to make much. Perfect number would be down 20…LOL
Sold STMP FEB 21 2020 65.0/80.0/83.0 Jade Lizards @ 3.26
#ShortPuts – I’ll take it for a one night stand…
Bought to Close SPCE FEB 21 2020 26.0 Puts @ .20 (sold for .92)
#earningsSPCE
BTC 21 Feb 27P for .30
Was STO yesterday for 1.25
Earnings next Tuesday, I think I’ll skip it due to lack of historical data
STO February 28, 550/1300 strangle for 3.65
Shaking my head in wonder but I have to do something here. Stock is just about through my 3/20 900/920 bear call spread (it was worse earlier) so I just sold the 3/20 800/780 bull put spread for 5.35 bringing the total collected to 9.35 for a 20 point spread. If it calms down a bit I may be able to get out of this. If not I’ll roll the put spread up and collect as much as I can before letting the stock declare victory.
#shortputs
$EXAS BTC 3/20 82.50 put at .40. STO at 3.60 on 1/14. Thank you @jsd501
$NUGT STO 2/28 31 put at .40
#bups
$ROKU BTC 2/21 110/120 BUPS at .50. STO 1/15 at 2.85. Had GTC order at .50
$ROKU STO 3/20 110/120 BUPS at 2.41
$AAPL STO 3/20 300/310 BUPS at 1.80 Thank you @ramie77
#coveredcalls
$ROKU STO 2/21 135 call at 1.15
STC 28 Feb 1985/1995 for .78
Was STO Feb 7 for 2.66
Just wanted to free up a bit of capitol
#ShortPuts – Can’t believe I’m doing this. @Iceman is correct it’s Crazytown. Rolling a short put up 125 points and still 100 points outside the expected move. Setting the new strike just above the rapidly rising 50ma…
Rolled TSLA MAR 20 2020 500.0 Put to MAR 20 2020 625.0 Put @ 4.00 credit (7.10 total now)
Rolled $TSLA Feb 28 850 call // Mar 06 950 -$35.00.
Not sure thats going to be enough to get out in front of it.
Had a moment yesterday where I was thinking I’d close the 850’s at roughly even money from yesterdays roll, but I hesitated to avoid notching a day trade.
BTC $ENPH Mar 20 $35 puts @0.15. STO 2/18 @1.8. Partial fill so far.
Planning let my Feb 21 $27.5’s expire Friday, but no reason to let the March ones sit for 30 days.
#Earnings $Z reports tonight. Below are details on earnings one-day moves over the last 12 quarters.
Nov. 7, 2019 AC +12.29%
Aug. 7, 2019 AC -15.29%
May 9, 2019 AC +5.04%
Feb. 21, 2019 AC +26.36% Biggest UP
Nov. 6, 2018 AC -26.92% Biggest DOWN
Aug. 6, 2018 AC -14.77%
May 7, 2018 AC -1.44%
Feb. 8, 2018 AC -2.67%
Nov. 7, 2017 AC +2.67%
Aug. 8, 2017 AC -9.05%
May 4, 2017 AC +9.29%
Feb. 7, 2017 AC -6.37%
Avg (+ or -) 11.01%
Bias -1.74%, negative bias on earnings.
With stock at 53.50 the data suggests these ranges:
Based on current IV (expected move into Friday per TOS): 47.10 to 59.90
Based on AVERAGE one-day move over last 12 quarters: 47.61 to 59.39
Based on MAXIMUM one-day move over last 12 Q’s (26.9%): 39.10 to 67.90
Based on UP max only (+26.4%): 67.60
Open to requests for other symbols.
#Earnings $STMP reports tonight. Below are details on earnings one-day moves over the last 12 quarters.
Nov. 7, 2019 AC +12.28%
Aug. 7, 2019 AC +27.46%
May 8, 2019 AC -55.75%
Feb. 21, 2019 AC -57.76% Biggest DOWN
Oct. 31, 2018 AC -9.74%
Aug. 1, 2018 AC +8.43%
May 3, 2018 AC +3.91%
Feb. 21, 2018 AC +11.00%
Nov. 2, 2017 AC -22.59%
Aug. 2, 2017 AC +35.88% Biggest UP
May 3, 2017 AC -0.40%
Feb. 23, 2017 AC -1.60%
Avg (+ or -) 20.57%
Bias -4.07%, negative bias on earnings.
With stock at 93.00 the data suggests these ranges:
Based on current IV (expected move into Friday per TOS): 72.11 to 113.89
Based on AVERAGE one-day move over last 12 quarters: 73.87 to 112.13
Based on MAXIMUM one-day move over last 12 Q’s (57.8%): 39.28 to 146.72
Based on UP max only (+35.9%): 126.37
Open to requests for other symbols.
#Earnings Bought to close $HLF Feb 21st 37 #ShortPuts for .05. Sold yesterday for .73
#SPX1dte Sold to Open $SPX Feb 19th 3305/3325-3395/3415 condors for .95, IV 10.00%, SPX 3369, deltas -.07, +.07
Expiring: Feb 18th 3295/3315-3410/3430 condors, sold Friday for 1.05
#Earnings $HLF reports tonight. Below are details on earnings one-day moves over the last 12 quarters.
Oct. 29, 2019 AC +11.67%
Aug. 1, 2019 AC -6.77% Biggest DOWN
May 2, 2019 AC -4.51%
Feb. 19, 2019 AC -2.01%
Oct. 30, 2018 AC -2.61%
Aug. 1, 2018 AC +13.03% Biggest UP
May 3, 2018 AC +4.47%
Feb. 22, 2018 AC +3.00%
Nov. 2, 2017 AC -2.92%
Aug. 1, 2017 AC -1.95%
May 4, 2017 AC +11.57%
Feb. 23, 2017 AC -4.51%
Avg (+ or -) 5.75%
Bias 1.54%, positive bias on earnings.
With stock at 39.00 the data suggests these ranges:
Based on current IV (expected move into Friday per TOS): 35.89 to 42.11
Based on AVERAGE one-day move over last 12 quarters: 36.76 to 41.24
Based on MAXIMUM one-day move over last 12 Q’s (13.00%): 33.92 to 44.08
Based on DOWN max only (-6.8%): 36.36
Open to requests for other symbols.
#ShortPuts – A small starter position just to get involved. Earnings next week with huge IV so good for a roll or covered call sale if needed.
Sold SPCE FEB 21 2020 26.0 Puts @ .92
#ShortPuts – Now that I’m back in SOXL I’m taking this one off for risk reduction in the whole China semiconductor virus thing. Earnings in March so still watcing it.
Bought to Close AVGO MAR 06 2020 287.5 Put @ 1.30 (sold for 2.21)
Sold $AAPL 3/20 305/295 bull put spread @ 1.78
#ShortPuts – Thanks @Iceman haven’t been in this one in ages. Great divvy down here too…
Sold SLB MAR 13 2020 32.0 Puts @ .63
BTC $FB Feb-21-2020 195/205 #BuPS @0.08. Was STO 1/29 as a Feb 07 @1.2, then rolled to Feb 21 on 1/31 for +0.5.
STO $ISRG Mar-21-2020 560/570 #BuPS @1.55.
#shortputs
$LK BTC 2/21 40 put and STO 2/28 40 put at 1.25 credit. Stock at 40.30.
STO $ENPH Mar-20-2020 35 Puts @1.85.
Holding $ENPH Feb-21-2020 27.5 puts, but looking for close or expire this week.
#ShortPuts – Adding in a different account…
Sold GILD MAR 13 2020 65.0 Puts @ 1.34
#shortputs
$GSX BTC 2/21 30 put and STO 3/20 35 put at $2 added credit
#ShortPuts – Starter position…
Sold LABU MAR 13 2020 47.5 Put @ 1.30
#shortputs
$GSX STO 2/21 35 PUTS AT .60
#coveredcalls
$NVTA BTC 3/20 25 call and STO 3/20 30 call at debit of 2.33 Stock at 26.81.
$GSX STO 2/21 40 call at 1.55
$NUGT STO 2/21 31.50 call at .89
#bups
$BIDU BTC 2/21 125/130 BUPS at .40. STO at 1.50
BTO March 20, 35/40 bull call spread at 1.80 with stock making new high.
#ShortCalls – Sold UVXY MAR 13 2020 12.5 Calls @ .78
#ShortPuts – Sold SOXL MAR 20 2020 205.0 Put @ 3.00
Rolled $TSLA FEB-21-2020 825 short calls // Feb-28-2020 850 calls +$2.00.
Still selling against Mar-20-2020 585 longs.
BTC $ANET Feb-14-2020 205/215 #BuPS @0.10. Was STO 1/28/2020 @1.83
BTC $ROKU Feb-21-2020 112/122 #BuPS @.22. Was STO 1/13/2020 @2.25
BTC $NVDA Feb-21-2020 225/230 #BuPS @0.05. Was STO 1/15/2020 @1.17.
BTC $LULU Feb-28-2020 222.5/232.5 #BuPS @0.14. Was STO 1/27/2020 @1.40.
Could have let the ANET expire, turns out.
On 11/15/19 STO AMAT Dec 6 62/63/62 #jadelizard @2.14….on 11/22/19 with the 62 Put DITM it was rolled out til Dec 13 for 0.24 credit….11/22 BTC 62/63 BeCS @0.05 debit….
12/11/19 assigned on the 62 Put with a cost basis of $59.68….
Six #coveredcalls have been sold reducing my cost basis to $56.84……With the stock closing today 2/14/20 at $66.85 I was called away at $66.00
#optionsexpiration #earnings
$ROKU 122 put Thank you @fuzzball STO 2.97
$ANET 215 put Thank you @fuzzball STO 2.90
$SHOP 460/465 BUPS STO 1.35
#optionsexpiration
$SPX 1 DTE Thank you @jeff
$AMRN 20 call
$PFE 38 call
$ROKU 120 put STO on 12/10 for earnings at 4.85.
$NUGT 30 call
$NUGT 32 call
$MRVL 24 put
$ROKU 140 call Too bad I still have the stock ($131 – $151 range for today)
Happy Valentine’s Day
Have a terrific three day weekend
#SPX1dte Sold to Open $SPX Feb 18th 3295/3315-3410/3430 condors for 1.05, IV 7.86%, SPX 3372, deltas -.07, +.06.
Winners:
Expiring: Feb 14th 3310/3330-3405/3425 condors, sold yesterday for 1.05
Expiring: $SHOP Feb 14th 465/460 put spreads, sold Tuesday for 1.416
Losers:
Expiring: $YELP 31 short puts and 39 short calls. Calendars bought for .303 total…. long positions remain for next Friday, but a long shot.
$TAP #DoubleCalendars closed for .01 debit. Lost total of .31.
#ShortPuts – Another one getting green quickly so booking it too. Earnings on the 24th for a possible re-entry.
Bought to Close PANW FEB 21 2020 237.5 Put @ .35 (sold for 2.05)
Bought to close $HES 3/20 52.50 puts 2 .45. Sold for 1.15 on 1/29.
Buddy of mine called my attention to this. IV through the roof and earnings on the 25th. Weeklies also. Something to watch.
Sold $ROKU 3/20 115/110 bull put spread @ 1.25 to complete the iron condor with the 160/165 bear call spread I sold earlier today. Total premium taken in for the IC 2.55, a little more than 50% of the width of the strikes.
#ShortPuts – Really sucking the volatility out of these today. Gotta book it for a 3 day trade…
Bought to Close TSLA MAR 13 2020 550.0 Put @ 2.19 (sold for 6.10)
In honor of Monday’s holiday, Options Bistro presents the third annual Hall of Rotating Presidents. If you don’t like the President who appears in the upper right, just click “Home/REFRESH” (or refresh your browser) and a new one will appear!
Have a great three-day weekend!
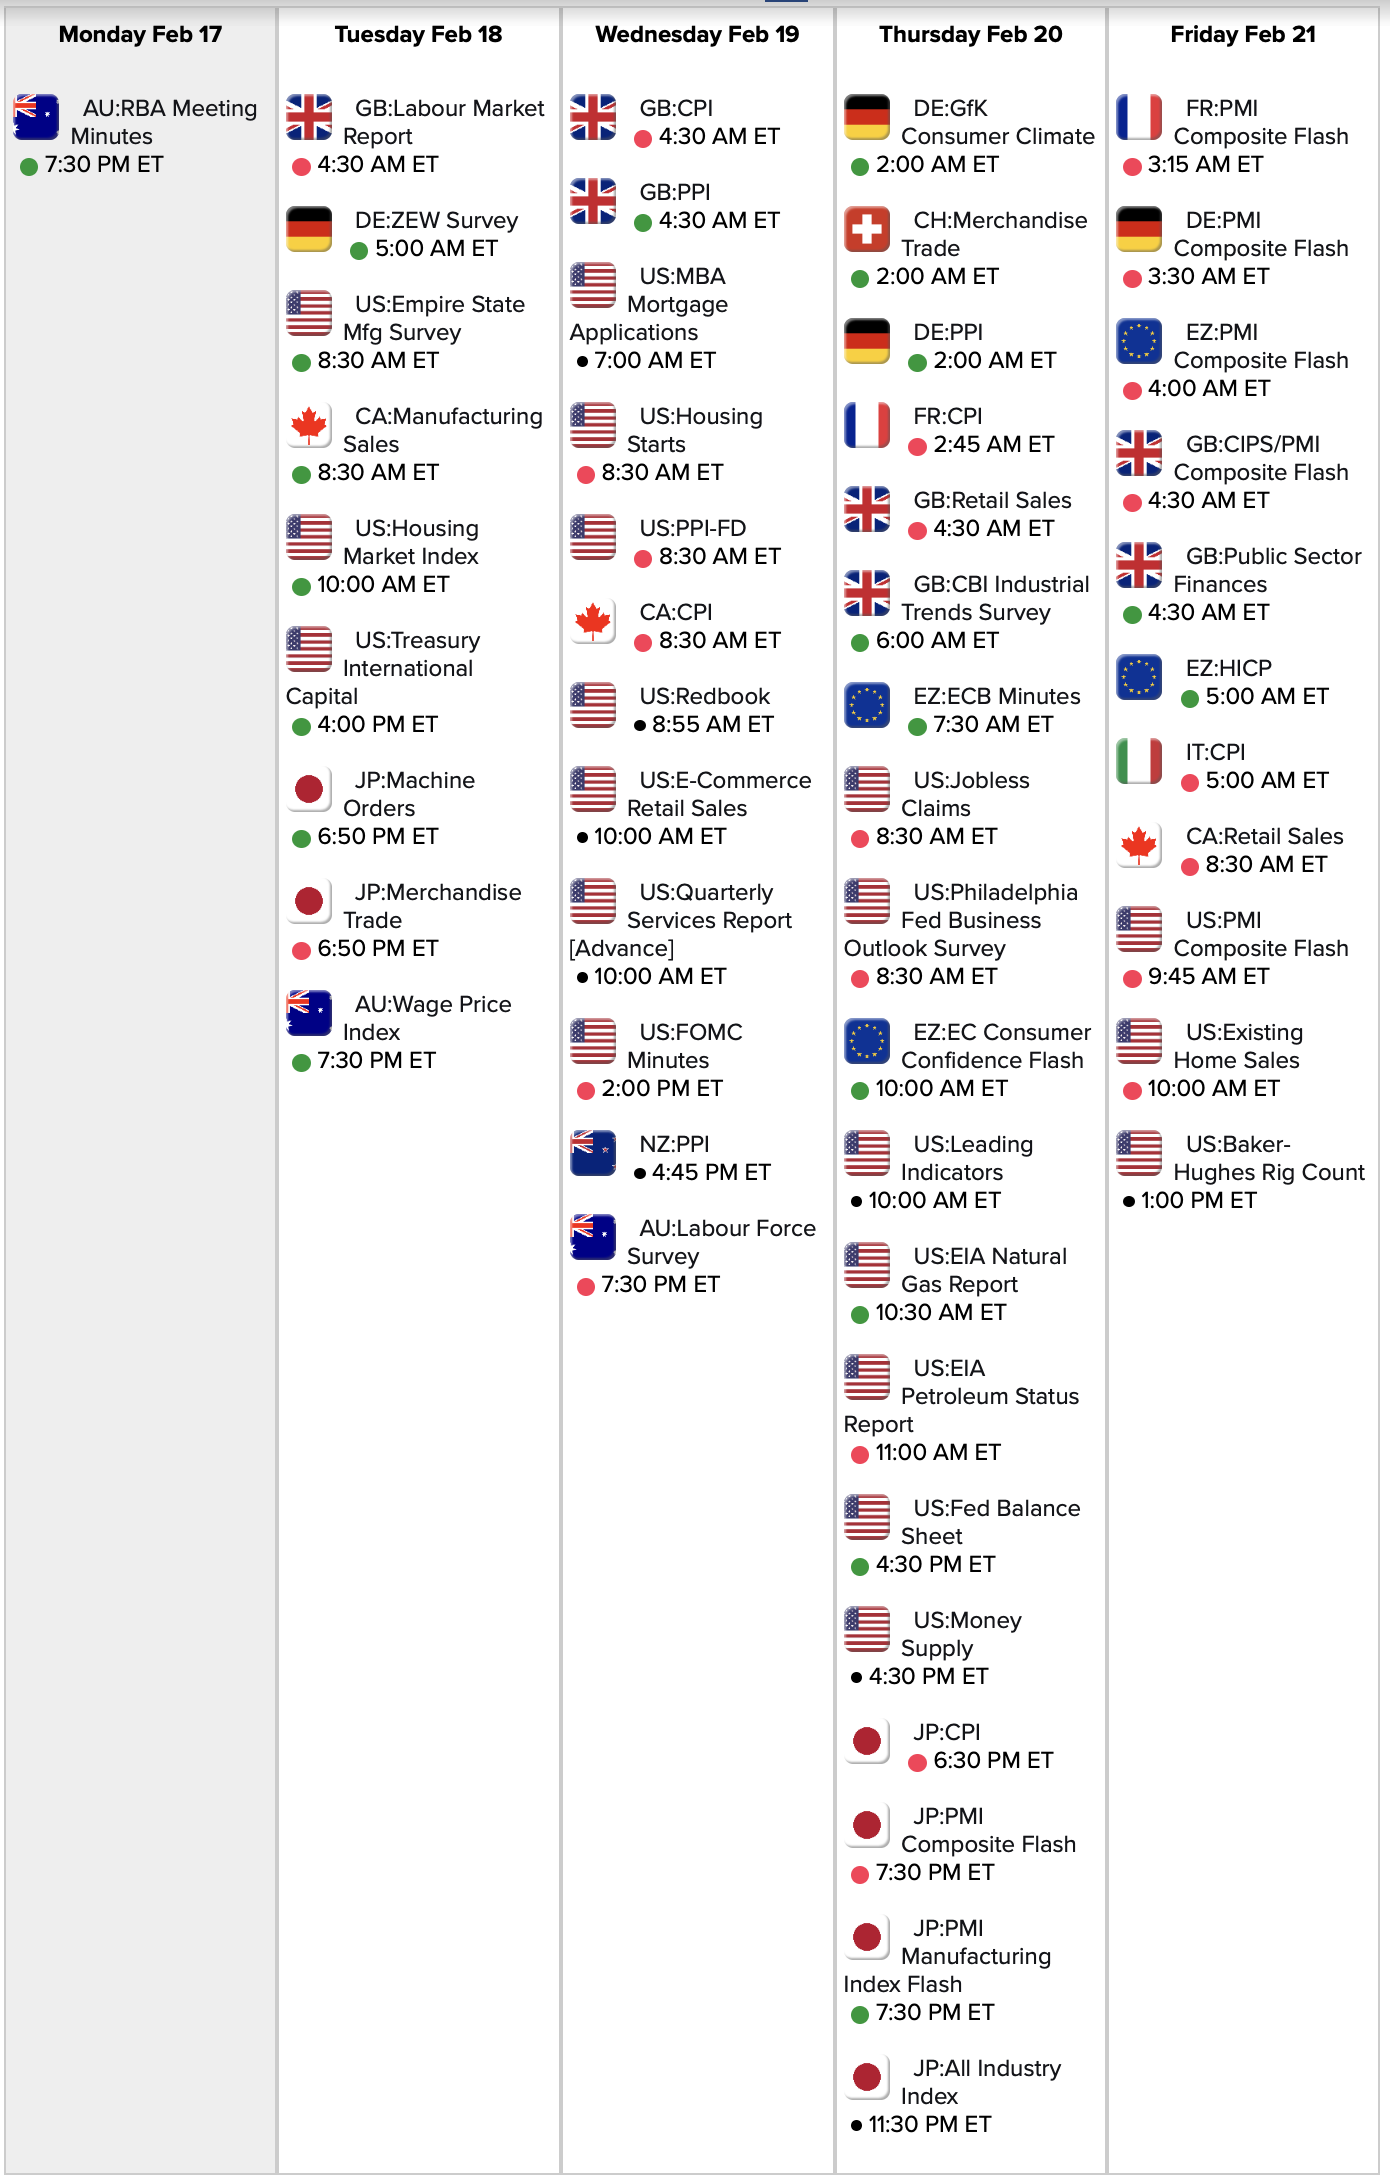

Link to Calendar: https://research.investors.com/economic-calendar/
#bups
$ANET BTC 2/21 185/200 BUPS at .20. STO 1/23 at 1.80
BTO January 2021, 155 call
STO January 2021, 170 call
STO January 2021, 150 put.
Total credit of 18.05 on the trade. Worse case is that I own AYX at 132
#CoveredCalls – I’ll be taking some stock in a tax free account. Can’t sell naked calls so going with an early spread to get the long weekend.
Sold NTAP FEB 28 2020 54.0/59.0 Bear Call Spreads @ 1.35
#earningsGILD
BTC Jade Liz 21 feb 66P/68C/69C for .55
Was STO 4 Feb prior to earnings for 1.45
Taking risk off prior to weekend
Thanks Jeff for all the data.
#earnings #shortputs
$NVDA BTC 2/14 250 put at .20. STO yesterday at 2.55. Thank you @fuzzball.
#coveredcalls
$ROKU BTC 2/14 140 call and STO 2/21 145 call at .15 credit plus gain $5 if called away. Breakeven at 139.85. Unfortunately, stock looking like a lead balloon right now.
#ShortPuts #ShortStrangles #Earnings – 🙂 🙂 🙂 🙂
ANET: Take what I can get. Might re-load on more weakness.
Bought to Close ANET FEB 14 2020 215.0 Put @ 1.20 (sold for 3.40)
NVDA: Earnings quickie.
Bought to Close NVDA FEB 21 2020 250.0 Put @ .10 (sold for 2.80)
ROKU: Wow is all I can say. Also, thanks @Ramie for the idea on the new trade.
Bought to Close ROKU FEB 14 2020 115.0/175.0 Strangles @ .06 (sold for 2.75)
Bought to Close ROKU FEB 14 2020 122.0 Put @ .04 (sold for 3.10)
Bought to Close ROKU FEB 21 2020 115.0 Put @ .09 (sold for 2.43)
And:
Sold ROKU MAR 20 2020 120.0/190.0 Strangle @ 3.50
TSLA: Book early and re-load.
Bought to Close TSLA MAR 06 2020 450.0 Put @ .90 (sold for 4.00)
Sold TSLA MAR 20 2020 500.0 Put @ 3.10
UDOW:
Bought to Close UDOW FEB 21 2020 122.0 Put @ .30 (sold for 2.05)
Sold $ROKU 3/20 160/165 bear call spread @ 1.30
#earnings #shortputs
$BABA BTC 2/14 212.5 puts at .14. STO yesterday at 1.13. TTMAR rather than LTMAC.
#ShortStrangles #Earnings – Late fill…
Sold ROKU FEB 14 2020 115.0/175.0 Strangles @ 2.75
#SPX1dte Sold to Open $SPX Feb 14th 3310/3330-3405/3425 condors for 1.05, IV 10.76%, SPX 3378, deltas -.07, +.07
#Earnings $ROKU reports tonight. Below are details on earnings one-day moves over the last 9 quarters (its entire history).
Nov. 6, 2019 AC -16.01%
Aug. 7, 2019 AC +20.85%
May 8, 2019 AC +28.11%
Feb. 21, 2019 AC +25.23%
Nov. 7, 2018 AC -22.29% Biggest DOWN
Aug. 8, 2018 AC +21.31%
May 9, 2018 AC -1.71%
Feb. 21, 2018 AC -17.71%
Nov. 8, 2017 AC +54.93% Biggest UP
Avg (+ or -) 23.13%
Bias 10.30%, strongly positive bias on earnings.
With stock at 140.00 the data suggests these ranges:
Based on current IV (expected move into Friday per TOS): 117.10 to 162.90
Based on AVERAGE one-day move over last 9 quarters: 107.62 to 172.38
Based on MAXIMUM one-day move over last 9 Q’s (54.9%): 63.10 to 216.90
Based on DOWN max only (-22.3%): 108.79
Open to requests for other symbols.
#ShortCalls Sold to Open $TSLA Feb 28th 1100 calls for 5.00. Will look to add a put side on next pull back.
#ShortPuts – Taking some risk off a couple weeks early…
Bought to Close UNH MAR 06 2020 245.0 Put @ .35 (sold for 2.91)
#fallingknife PAYC
BTC PAYC 21 Feb 280 Put for .50
Was STO Feb 6 for 3.42
#ShortPuts – Completely out of this one again…
Bought to Close LABU FEB 21 2020 48.0 Put @ .15 (sold for 1.92)
BTC $ISRG Feb-21-2020 550/560 #BuPS @0.17. Was STO Jan-12-2020 for 1.25.
#ShortPuts #Earnings – Taking a small shot at each of these…
Sold ANET FEB 14 2020 215.0 Put @ 3.40
Sold NVDA FEB 21 2020 250.0 Put @ 2.80 (went out an extra week)
Sold ROKU FEB 14 2020 122.0 Put @ 3.10
Rolled $TSLA Feb-14-2020 800 short Calls // Feb-21-2020 825 Calls @8.00 credit.
Selling against Mar-20-2020 longs.
#Earnings #DoubleCalendar in quotes because I placed them near the expected moves rather than ATM. So maybe call it #EMDC. YELP tends to move, but rather not risk the $4+ to buy a Straddle.
Bought $YELP Feb14/Feb21 39 #CallCalendar for .17
Bought $YELP Feb14/Feb21 31 #PutCalendar for .133
You may be able to get these a bit cheaper. I bid below mid-price and was filled instantly on both.
#Earnings $ANET reports tonight. Below are details on earnings one-day moves over the last 12 quarters.
Oct. 31, 2019 AC -24.23% Biggest DOWN
Aug. 1, 2019 AC -10.32%
May 2, 2019 AC -10.43%
Feb. 14, 2019 AC +9.62%
Nov. 1, 2018 AC +6.97%
Aug. 2, 2018 AC -5.26%
May 3, 2018 AC -8.51%
Feb. 15, 2018 AC -18.98%
Nov. 2, 2017 AC +11.21%
Aug. 3, 2017 AC +19.43% Biggest UP
May 4, 2017 AC +3.22%
Feb. 16, 2017 AC +18.85%
Avg (+ or -) 12.25%
Bias -0.70%, slight negative bias on earnings.
With stock at 232.50 the data suggests these ranges:
Based on current IV (expected move into Friday per TOS): 208.47 to 256.53
Based on AVERAGE one-day move over last 12 quarters: 204.45 to 261.55
Based on MAXIMUM one-day move over last 12 Q’s (24.2%): 176.54 to 289.46
Based on UP max only (+19.4%): 278.27
Open to requests for other symbols.
#Earnings $YELP reports tonight. Below are details on earnings one-day moves over the last 12 quarters.
Nov. 7, 2019 AC +15.43%
Aug. 8, 2019 AC +5.20%
May 9, 2019 AC -14.37%
Feb. 13, 2019 AC -0.70%
Nov. 8, 2018 AC -26.59% Biggest DOWN
Aug. 8, 2018 AC +26.65%
May 10, 2018 AC -7.81%
Feb. 7, 2018 AC -14.04%
Nov. 1, 2017 AC -0.10%
Aug. 3, 2017 AC +27.66% Biggest UP
May 9, 2017 AC -18.35%
Feb. 9, 2017 AC -13.64%
Avg (+ or -) 14.21%
Bias -1.72%, slight negative bias on earnings.
With stock at 35.30 the data suggests these ranges:
Based on current IV (expected move into Friday per TOS): 30.81 to 39.79
Based on AVERAGE one-day move over last 12 quarters: 30.28 to 40.32
Based on MAXIMUM one-day move over last 12 Q’s (27.7%): 25.54 to 45.06
Based on DOWN max only (-26.6%): 25.91
Open to requests for other symbols.
#Earnings $NVDA reports tonight. Below are details on earnings one-day moves over the last 12 quarters.
Nov. 14, 2019 AC -2.66%
Aug. 15, 2019 AC +7.25%
May 16, 2019 AC -2.28%
Feb. 14, 2019 AC +1.81%
Nov. 15, 2018 AC -18.75% Biggest DOWN
Aug. 16, 2018 AC -4.90%
May 10, 2018 AC -2.15%
Feb. 8, 2018 AC +6.69%
Nov. 9, 2017 AC +5.26%
Aug. 10, 2017 AC -5.32%
May 9, 2017 AC +17.82% Biggest UP
Feb. 9, 2017 AC -2.37%
Avg (+ or -) 6.44%
Bias 0.03%, no significant bias on earnings.
With stock at 270.00 the data suggests these ranges:
Based on current IV (expected move into Friday per TOS): 251.44 to 288.56
Based on AVERAGE one-day move over last 12 quarters: 252.62 to 287.38
Based on MAXIMUM one-day move over last 12 Q’s (18.8%): 219.38 to 320.63
Based on UP max only (+17.8%): 318.11
Open to requests for other symbols.
