
Macy*s says comp store sales will be more like 2% than 2.3% for this year, and investors reacted calmly by ripping 25% of its market cap out like Patrick Swayze ripped out that dude’s throat in Roadhouse.
We are very chill on Wall Street.
— Downtown Josh Brown (@ReformedBroker) January 10, 2019
Author Archives: Jeff
SPX 1-dte
#SPX1dte Sold $SPX Jan 11th 2520/2540-2635/2655 iron condors for .85
Jerome can’t stay quiet
Not originally scheduled, but added to the calendar:
Federal Reserve Chairman Jerome Powell to participate in discussion at the Economic Club of Washington in Washington, DC.
Today, 12:45 ET
https://wp.me/p6Nxuc-eeY
SPX 1-dte closed
#SPX1dte Exited short puts for .05, but had to pay .55 to exit call side. Condors sold for 1.20 yesterday.
BBBY earnings analysis
#Earnings $BBBY reports tonight. Below are details on earnings one-day moves over the last 12 quarters.
Sept. 26, 2018 AC -20.99% Biggest DOWN
June 27, 2018 AC -3.81%
April 11, 2018 AC -19.95%
Dec. 20, 2017 AC -12.49%
Sept. 19, 2017 AC -15.87%
June 22, 2017 AC -12.12%
April 5, 2017 AC 3.38% Biggest UP
Dec. 21, 2016 AC -9.17%
Sept. 21, 2016 AC 0.74%
June 22, 2016 AC 1.50%
April 6, 2016 AC 0.32%
Jan. 7, 2016 AC 0.27%
Avg (+ or -) 8.38%
Bias -7.35%, strong negative bias on earnings.
With stock at 12.00 the data suggests these ranges:
Based on current IV (expected move per TOS): 10.12 to 13.88
Based on AVERAGE move over last 12 quarters: 10.99 to 13.01
Based on MAXIMUM move over last 12 Q’s (21.0%%): 9.48 to 14.52
Open for requests on other symbols.
TQQQ calls sold
#LongLEAPs #SyntheticCoveredCalls
Sold $TQQQ Jan 11th 42.5 calls for 1.45. A roll from this week’s calls that were stopped out.
Fed minutes
Heads up… Fed minutes released today at 2pm ET. Potential market mover.
SPX 1-dte
#SPX1dte Sold $SPX Jan 9th 2485/2505/2620/2640 condors for 1.20.
SQ calls sold
#LongLEAPs #SyntheticCoveredCalls
Sold to Open $SQ Jan 18th 66 calls for 1.35. Replace the Jan 4th calls I stopped out of yesterday.
Calls stopped
#LongLEAPs #SyntheticCoveredCalls First time I’ve had to do this in weeks. Both strikes breached so I exited on pull back and will wait for spikes higher to roll.
BTC $SQ Jan 11th 61 calls for 1.65. Sold for 1.20 on Friday.
BTC $TQQQ Jan 11th 40 calls for 1.30. Sold for .85 on Friday.
SPX 1-dte closed
#SPX1dte Earlier, closed $SPX Jan 7th shorts, puts for .05 and calls for .15. Condors sold Friday for 1.10
SPX 1-dte
#SPX1dte Sold to Open $SPX Jan 7th 2440/2460-2590/2610 condors for 1.10.
Calling again
#LongLEAPs #SyntheticCoveredCalls
Sold $TQQQ Jan 11th 40 calls for .85
Sold $SQ Jan 11th 61 calls for 1.20.
SPX Feb condor
#SPX1dte Sold $SPX Feb 2250/2270-2730/2750 condors for 3.00. Will close at or near 50%, or 1.50.
Econ calendar for week of 1/7/19
Fed minutes, Wednesday at 2pm ET.


Link to calendar: https://us.econoday.com/byweek.asp?day=7&month=1&year=2019&cust=us&lid=0
SPX 1-dte closed
#SPX1dte SPX hit my upside stop (expected move breached the 2520 short calls), so I exited on the pull back.
BTC $SPX Jan 4th 2520/2540 call spreads for 1.70. Condors sold yesterday for 1.25. Puts will expire, or close for .05.
I’ll be selling another 1-dte for Monday expiration. I’m looking for longer term roll options to replace today’s stop.
December Jobs Report
#Jobs Much higher than expected.
+312,000 non-farm payroll jobs, vs. 176K expected
Unemployment at 3.9%, up 0.2%
U6 unemployment at 7.6%, unchanged
Wages up 0.4%, 3.2% year over year
Labor force participation 63.1%, up by 0.2
November revised up from 155k to 176k
October revised up from 237K to 274k
SPX 1-dte
#SPX1dte Sold $SPX Jan 4th 2345/2365-2520/2540 for 1.25.
PVTL covered calls
#CoveredCalls Sold $PVTL Jan 18th 17 calls for .50.
Calls closed (again)
If I was only selling calls and didn’t have #LongLEAPs, this would be a brilliant strategy!
BTC $TQQQ Jan 4th 39.5 calls for .05. Sold for .74 on Friday.
BTC $SQ Jan 4th 59 calls for .05. Sold for .79 on Friday.
Trades today
SPX 1-dte
#SPX1dte Sold $SPX Jan 2nd 2380/2400/2570/2590 condors for 1.10.
BOIL out
#ContangoETFs Closing out the year by closing out final $BOIL positions. Was forced out of Jan 45 short calls by the spike higher… made some back with rolls, but still at a loss overall. I will reserve this symbol for large seasonal spikes in the future.
Closed BOIL Mar 50 call for .90. Sold for 4.15.
Closed BOIL June 66 call for .70. Sold for 7.20.
Best and Worst
Here are the best and worst performing stocks of this tough and volatile year for the market. https://t.co/LC2Zt7pE8X pic.twitter.com/VZo9Og3p77
— CNBC (@CNBC) December 31, 2018
SPX 1-dte
#SPX1dte Closed both shorts for .05 each. Waiting for last hour to sell for Wednesday’s expiration.
Calls sold
#LongLEAPs #SyntheticCoveredCalls
Sold $TQQQ Jan 4th 59 calls for .79
Sold $SQ Jan 4th 39.5 calls for .74
SPX 1-dte sold
#SPX1dte Sold $SPX Dec 31st 2360/2380-2570/2590 for 1.40.
SPX 1-dte
#SPX1dte Closed yesterday’s for .25 total. With the rolls I had to execute yesterday, the full trade ends up with a .35 loss.
Waiting until closer to the close to sell today’s, to avoid that kind of mess!
Econ Calendar for week of 12/31/18
#Jobs report is Friday. And Powell speaks later that morning.
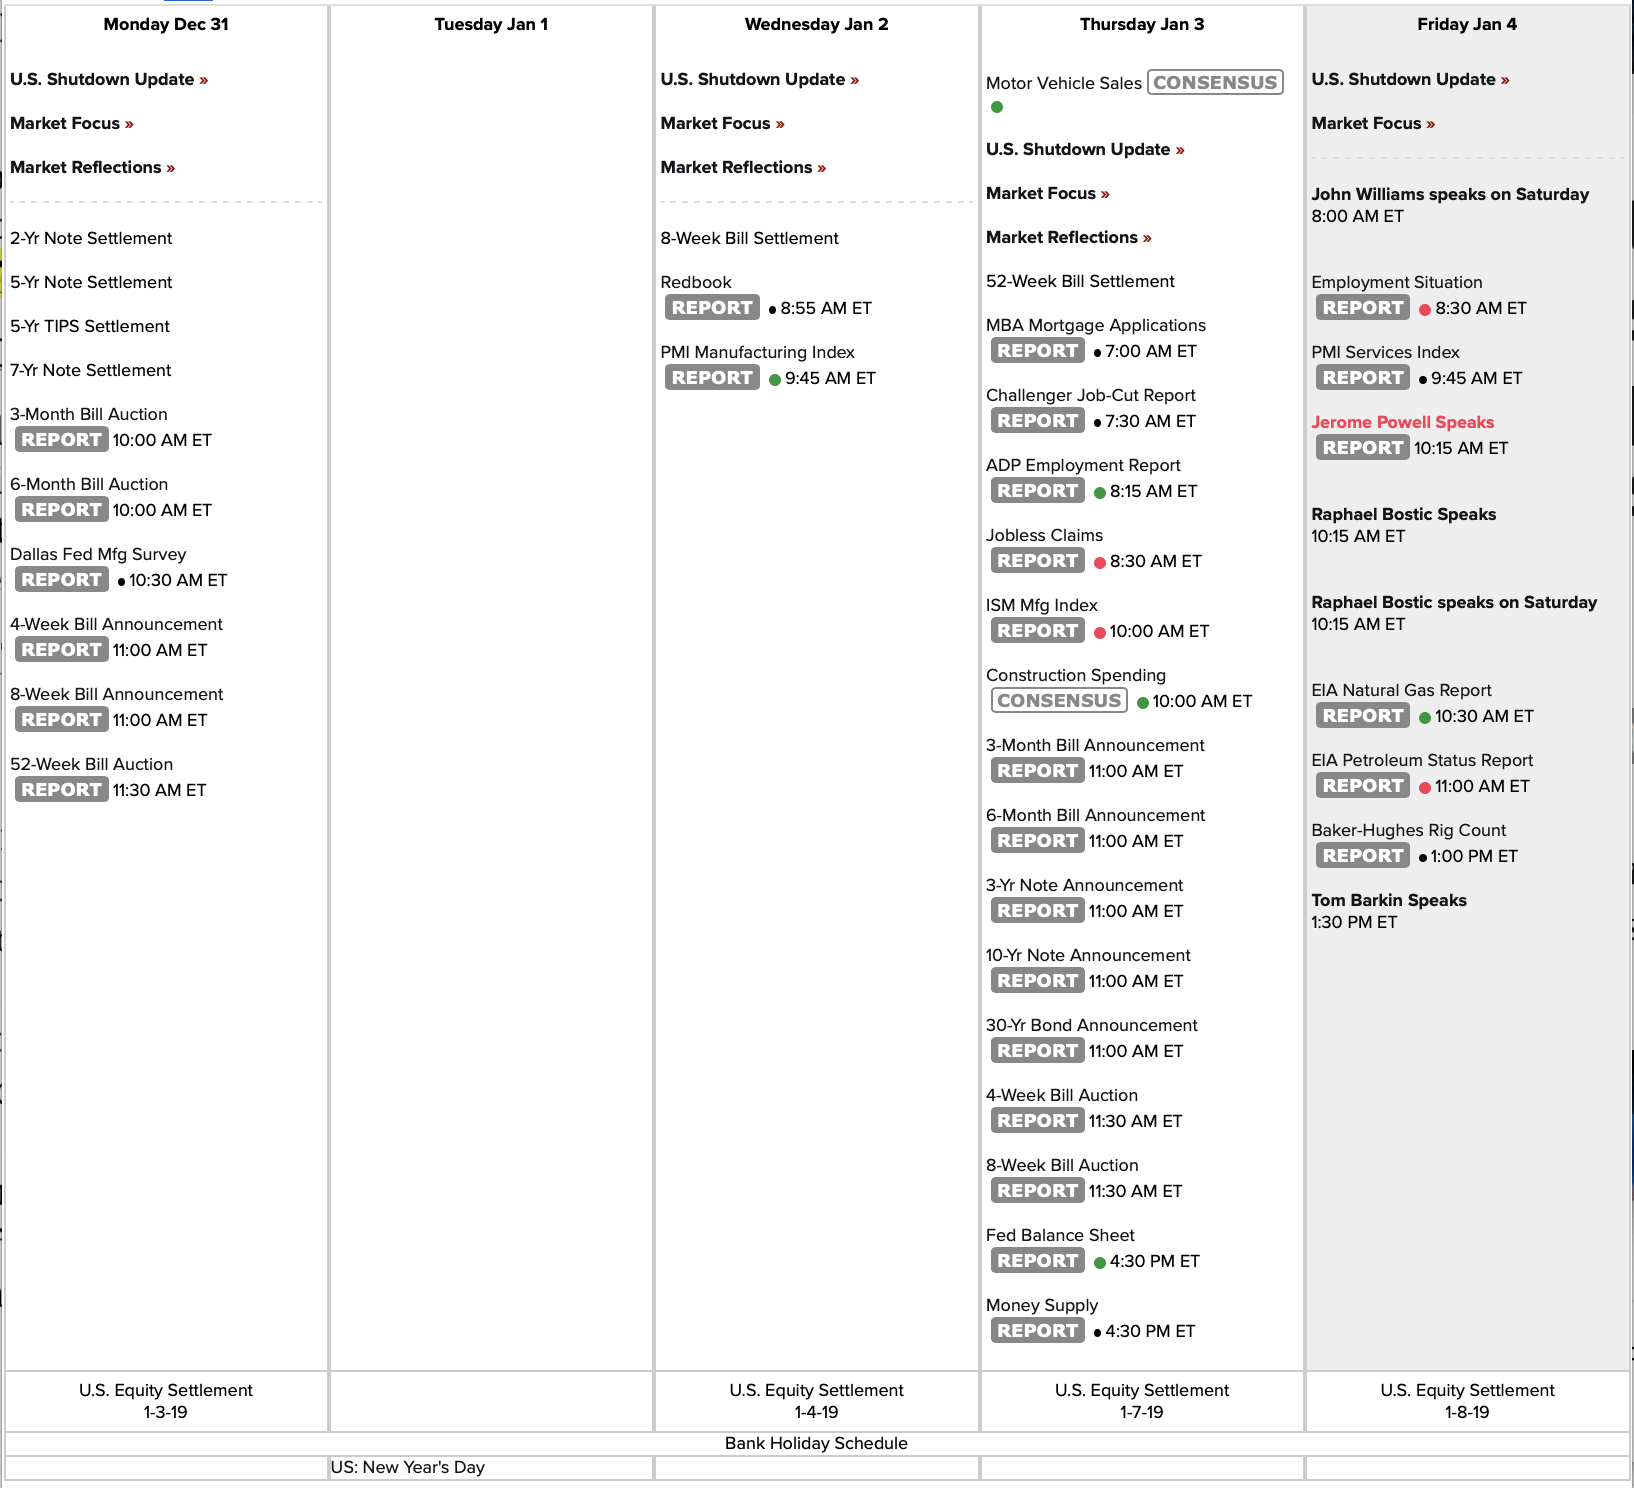
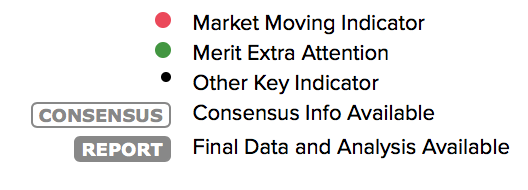
Link to calendar: https://optionsbistro.com/wp-content/uploads/2018/09/screen-shot-2018-09-24-at-6-07-52-am.png
SPX 1-dte roll
#SPX1dte What a face ripper!
Sold the condor below for 1.30 with 48 minutes before close when SPX was at 2440.
The call side hit my stop 20 minutes later (expected move breached short strike) with SPX going past 2475.
Stopped call side, BTC for 2.65.
Sold new call side: $SPX Dec 28th 2565/2585 for .75.
Then rolled put side after the bell: Closed 2340/2320 for .10.
Sold 2400/2380 for .60.
So best I can do tomorrow is small loss, near breakeven. Bonkers market… gotta wait until last 10 minutes on this trade to be safe.
SPX 1-dte
#SPX1dte Sold $SPX 2320/2340-2520/2540 condors for 1.30. Shorts are 180 apart.
SPX 1-dte
#SPX1dte Closed shorts for .05 each. On Monday, sold the 2215/2235-2470/2490 condors for 1.40. Tomorrow I’ll sell one for the Friday expiration.
SQ closed
#LongLEAPs #SyntheticCoveredCalls
BTC $SQ Dec 28th 58 calls for .07. Sold for .75 on Friday.
On Christmas Eve?
#VIXIndicator Looks like two new downside warnings, on usually the quietest day of the year. Down 2% on Christmas Eve.
May your Christmas Day be free of volatility and full of cheer!
TQQQ calls covered
#LongLEAPs #SyntheticCoveredCalls
BTC $TQQQ Dec 28th 39 calls for .10. Sold for .85 on Friday.
SPX 1 -dte
#SPX1dte Sold $SPX Dec 26th 2215/2235-2470/2490 condors for 1.40. Short strikes 235 points apart.
SPX 1-dte closed
#SPX1dte Closed $SPX Dec 24th 2270/2290-2490/2510 condors for .20. Sold for 1.40 on Friday. Selling one for Wednesday expiration before the close.
UVXY spreads & overall approach
#VXXGame My attempts at legging out of the $UVXY Dec 21st 50/60 call spreads were also a failure, but only a bit worse than allowing them to expire. Sold for 5.68 (avg price), some will expire for 10.00, some closed for 10.60, and assigned short shares on a couple others, cost basis 69.43.
Also, I took off some risk this week without rolling. First we’ve experience a market like this 2008, and I wasn’t trading then. I hold very few short options positions compared to many times in the past, and my remaining short $UVXY calls are hedged with a greater number of long calls, albeit much further OTM.
Suffice it to say the only thing working right now are the 1-day SPX condors. I’m finished trying any more directional positions until market is clearly finished with this. If we go much lower, I will continue to shed positions slowly.
BTC $UVXY Mar 15th 75 call for 16.00, sold for 6.125, avg price, in Sept/Oct
BTC $UVXY March 15th 95 call for 10.15, breakeven, sold for 10.15 in late October.
Closed $SOXL Feb 15th 75 put for 12.70. Sold for 7.00 as a roll.
SPX 1-dte
#SPX1dte I tried to leg out and leg in to the condors today. I continue to suck at those attempts like no other. This time, I paid more than necessary to exit today’s condor, but still with a profit. I was mildly successful at legging in to Monday’s.
Closed $SPX Dec 21st 2355/2375-2550/2570 condors for .60 total. Sold for 1.05 yesterday.
Sold $SPX Dec 24th 2270/2290-2490/2510 condors for 1.40 total.
Econ Calendar for week of 12/24/18
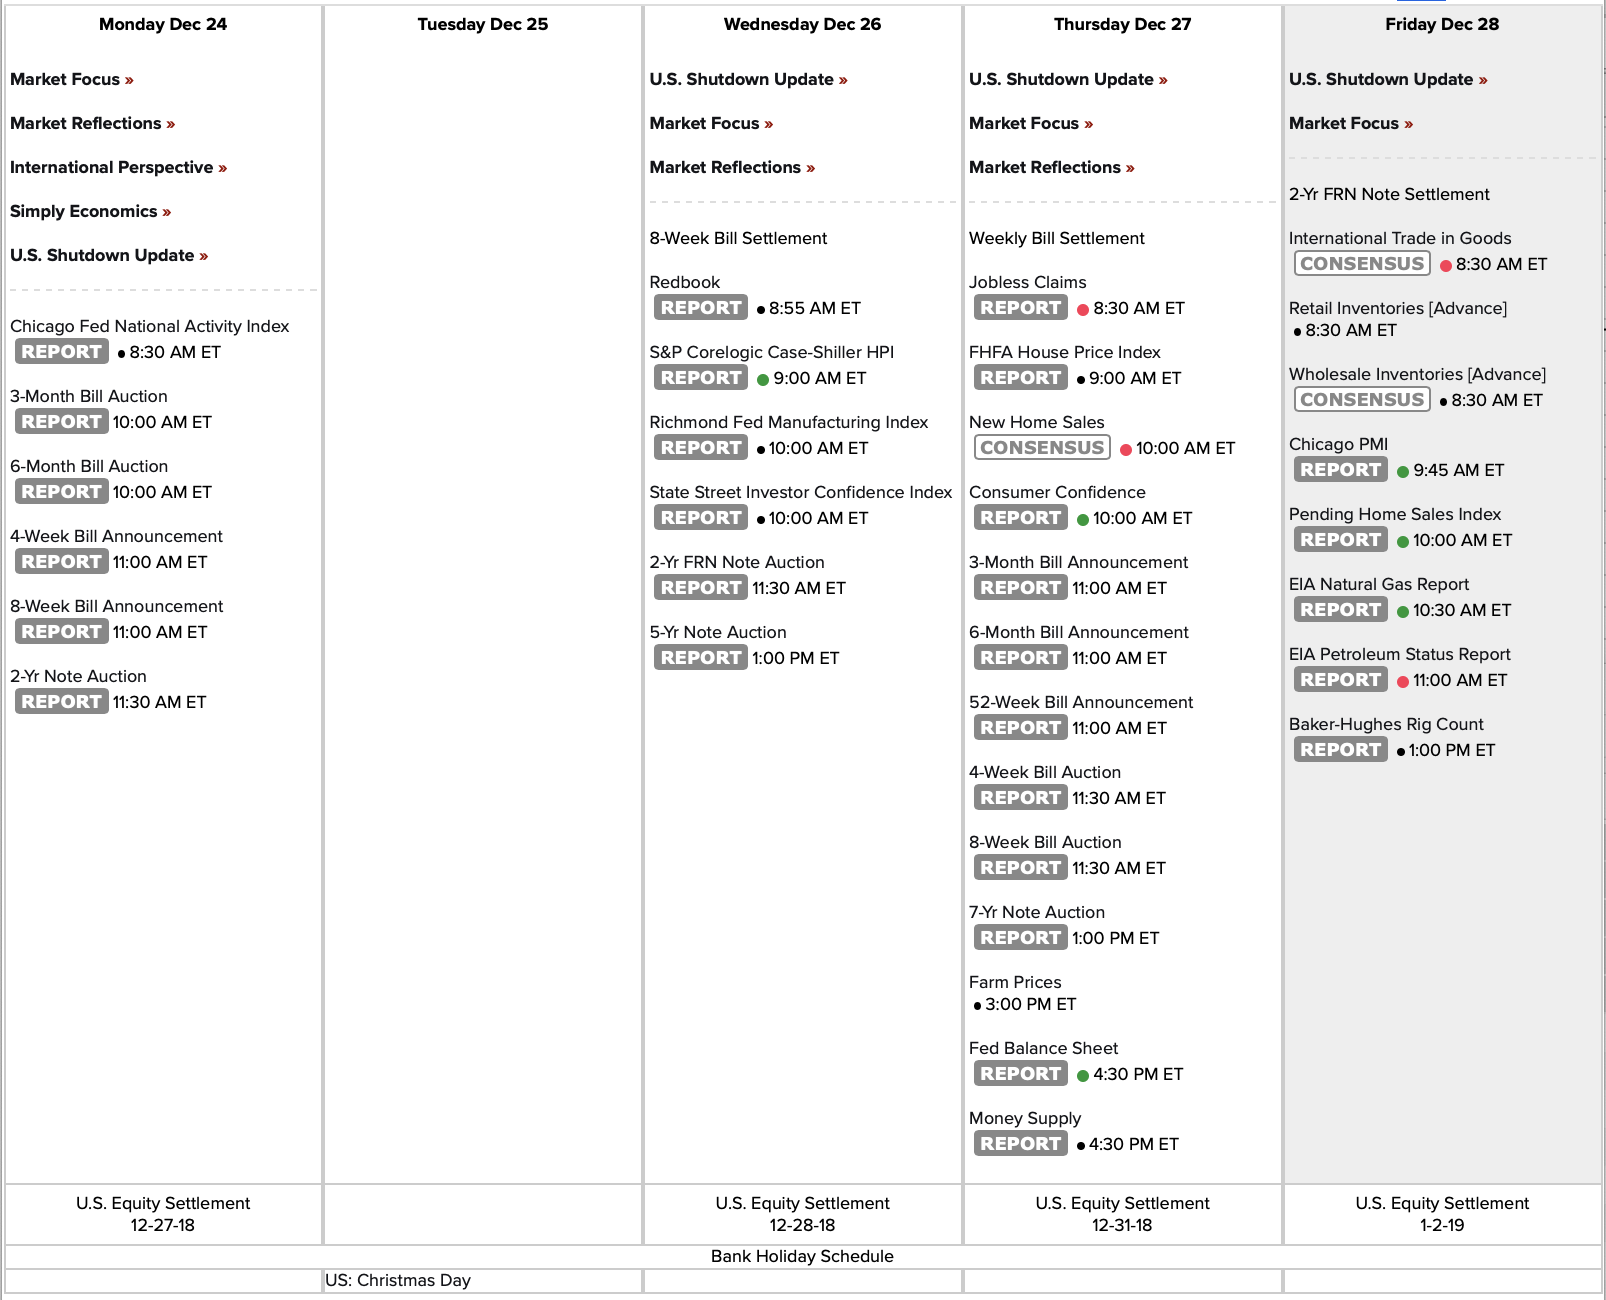
Link to calendar: https://us.econoday.com/byweek.asp?day=24&month=12&year=2018&cust=us&lid=0
So touchy
This is perhaps the most sensitive market to seemingly low impact headlines that I can remember…
BREAKING: Stocks spike to session high after NY Fed President John Williams says the Fed could reevaluate its view in 2019 https://t.co/VO5GKms1AL pic.twitter.com/1Zrhcbqyxs
— CNBC Now (@CNBCnow) December 21, 2018
Covered Calls
#LongLEAPs #SyntheticCoveredCalls These would have been better yesterday, but couldn’t catch it.
Sold $SQ Dec 28th 58 calls for .75
Sold $TQQQ Dec 28th 39 calls for .85
It will be hilarious if I just sold at the bottom! Oh, how we will laugh.
SPX 1-dte
#SPXcampaign Sold to open $SPX Dec 21st 2355/2375-2550/2570 condors for 1.05.
VIX touches above 30…
…and we get a 30-point SPX bounce… is that what everyone was waiting for to buy?
Let’s add gov’t shutdown to the mix!
Average S&P 500 stock is now
D
O
W
N
over 25% from its 52-week high. https://t.co/RXsMXKjJaR pic.twitter.com/Ov9xJk0h6R— Bespoke (@bespokeinvest) December 20, 2018
Plunge accelerating
VIX spiking
SPX 1-dte closed
#SPX1dte Closed entire condor, $SPX Dec 20th 2360/2380-2585/2605 for .30. Sold yesterday for 1.30.
At the end of today, I will sell a new one for tomorrow’s PM expiration.
NKE earnings analysis
#Earnings $NKE reports tonight. Below are details on earnings one-day moves over the last 12 quarters.
Sept. 25, 2018 AC -1.28%
June 28, 2018 AC 11.12% Biggest UP
March 22, 2018 AC 0.32%
Dec. 21, 2017 AC -2.28%
Sept. 26, 2017 AC -1.91%
June 29, 2017 AC 10.96%
March 21, 2017 AC -7.05% Biggest DOWN
Dec. 20, 2016 AC 0.98%
Sept. 27, 2016 AC -3.77%
June 28, 2016 AC 3.84%
March 22, 2016 AC -3.79%
Dec. 22, 2015 AC -2.36%
Avg (+ or -) 4.14%
Bias 0.40%, no significant bias on earnings.
With stock at 69.00 the data suggests these ranges:
Based on current IV (expected move per TOS): 64.42 to 73.58
Based on AVERAGE move over last 12 quarters: 66.14 to 71.86
Based on MAXIMUM move over last 12 Q’s (11.1%): 61.33 to 76.67
Open for requests on other symbols.
UVXY spreads
#VXXgame I had sold $UVXY 50/60 Dec 21st call spreads(for 4.35 and 7.00) in belief volatility would be calmed going into Xmas. Wrong.
On one account, I was assigned short stock at 50.00. I sold the long 60 calls for 12.60 today, and covered stock f0r 71.10, meaning out of the spread for 8.50.
On the other accounts trying to close one of the spreads for 9.30 but not getting filled. I’ll see if assigned tonight and deal with closing on the swings tomorrow.
SPX 1-dte
#SPX1dte Sold $SPX Dec 20th (monthlys) 2360/2380-2585/2605 condors for 1.30. Stop trading at 4:15pm tomorrow, settle Friday morning. I will close the trade during trading hours tomorrow.
Shorts are 205 points apart.
SPX trades
Before the announcement:
Bought to Open $SPX Dec 20th (monthlys) 2650/2670 call spreads for 1.20. This was betting on an explosion higher, and perhaps a quick double into tomorrow. So far, not looking good.
After the announcement
Sold to open Feb 14th (monthlys) 2300/2280 put spreads for 1.95. Partial roll from January spread stopped earlier this week.
Looking to sell the 1-dte trade in the next hour.
SPX 1-dte
#SPX1dte Closed $SPX 2435/2415 put spreads for .15. Looking to close call side on a pullback. If none comes I will stop out when condor is near breakeven.
SPX 1 -dte
#SPX1dte Sold $SPX Dec 19th 2415/2435-2635/2655 condors for 1.25. Shorts are 200 points apart. Will try to close before Fed announcement at 2pm ET tomorrow.
FDX earnings analysis
#Earnings $FDX reports tonight. Below are details on earnings one-day moves over the last 12 quarters.
Sept. 17, 2018 AC -5.53% Biggest DOWN
June 19, 2018 AC -2.69%
March 20, 2018 AC -1.17%
Dec. 19, 2017 AC 3.51%
Sept. 19, 2017 AC 2.08%
June 20, 2017 AC 1.60%
March 21, 2017 AC 2.12%
Dec. 20, 2016 AC -3.33%
Sept. 20, 2016 AC 6.89%
June 21, 2016 AC -4.53%
March 16, 2016 AC 11.83% Biggest UP
Dec. 16, 2015 AC 2.02%
Avg (+ or -) 3.94%
Bias 1.07%, positive bias on earnings.
With stock at 183.75 the data suggests these ranges:
Based on current IV (expected move per TOS): 172.43 to 195.07
Based on AVERAGE move over last 12 quarters: 176.51 to 190.99
Based on MAXIMUM move over last 12 Q’s (11.8%): 162.01 to 205.49
Open for requests on other symbols.
MU earnings analysis
#Earnings $MU reports tonight. Below are details on earnings one-day moves over the last 12 quarters.
Sept. 20, 2018 AC -2.86%
June 20, 2018 AC 0.83%
March 22, 2018 AC -7.99%
Dec. 19, 2017 AC 4.02%
Sept. 26, 2017 AC 8.51%
June 29, 2017 AC -5.11%
March 23, 2017 AC 7.40%
Dec. 21, 2016 AC 12.68% Biggest UP
Oct. 4, 2016 AC -0.56%
June 30, 2016 AC -9.15% Biggest DOWN
March 30, 2016 AC -0.09%
Dec. 22, 2015 AC -2.12%
Avg (+ or -) 5.11%
Bias 0.46%, no significant bias on earnings.
With stock at 34.75 the data suggests these ranges:
Based on current IV (expected move per TOS): 31.72 to 37.77
Based on AVERAGE move over last 12 quarters: 32.97 to 36.53
Based on MAXIMUM move over last 12 Q’s 12.7%): 30.34 to 39.16
Open for requests on other symbols.
SPX 1-dte
#SPX1dte Expiring: $SPX Dec 17th 2500/2520-2665/2685 condors. Sold Friday for 1.05.
Also, stopped $SPX Jan 17th 2420/2400 put spreads for 3.65, since expected move breached my short puts. These were sold as a roll from a stopped #SPX1dte spread (sold condor for 3.00 on Nov 20). With one roll down of the call side, I’m getting out of this with only a .20 profit (or basically breakeven after commissions). Will look to roll into a new condor later this week.
Double down
Bought more $SPX Dec 28th long 2700/2720 call spreads for .85 (first batch bought this morning for 1.80). With a double position it is easier to sell half at a decent profit and let the other half ride as long as I can. After today’s action the only thing I can be playing for is a rally after we get the Fed meeting out of the way. And by rally, I don’t mean much higher than 2700 before we probably resume the downtrend.
New UVXY high
#VXXGame We just exceeded the 10/29 high of this correction on $UVXY.
The $VIX is still 3 points below its correction high set on 10/11.
We are setting up today to hit our 7th downside warning in this correction.
BOIL closed
#ContangoETFs Closed the last of my $BOIL Jan 45 calls for 3.30. I’m underwater despite a few rolls, but this is closest to the money that I had. I want to be ready should we get another winter push higher.
Covered Calls closed
#LongLEAPs #SyntheticCoveredCalls
BTC $TQQQ Dec 21st 49 calls for .10. Sold for .90 on Thursday.
BTC $SQ Dec 21st 66 calls for .10. Sold for .84 on Thursday
…by the roadside in a ditch
Watching the carnage, this one came to mind. (click the photo)

SPX long
#SPXcampaign #SPX1dte Bought to open $SPX Dec 28th 2700/2720 call spreads for 1.80. Looking for a trickle higher into the end of the year.
Kinda what I’ve been expecting…
…but so far, still waiting…
$SPX: clean tag of lower trend line as support.
New lows show a positive RSI divergence.
If this trend line holds and the structure plays as a falling wedge a very sizable rally could emerge.
Previous breakout attempt failed.
Targets would include MA reconnects. pic.twitter.com/9UrAfk889d— Sven Henrich (@NorthmanTrader) December 17, 2018
Closed SOXL call
#ContangoETF’s While short puts continue to decay (very slowly), closed $SOXL Feb 150 call for .90. Sold for 4.50 on Dec 3rd. I’ll sell more calls on any rally.
ORCL earnings analysis
#Earnings $ORCL reports tonight. Below are details on earnings FIVE-day moves over the last 12 quarters, since expiration is 4 days away on Friday.
**** FIVE-DAY moves ****
Mon 09/17/2018 AC 3.90%
Tue 06/19/2018 AC -4.68%
Mon 03/19/2018 AC -13.79% Biggest DOWN
Thu 12/14/2017 AC -4.74%
Thu 09/14/2017 AC -8.99%
Wed 06/21/2017 AC 9.77% Biggest UP
Wed 03/15/2017 AC 5.06%
Thu 12/15/2016 AC -4.55%
Thu 09/15/2016 AC -4.38%
Thu 06/16/2016 AC 3.49%
Tue 03/15/2016 AC 7.07%
Wed 12/16/2015 AC -6.39%
Avg (+ or -) 6.40%
Bias -1.52%, negative bias on earnings.
With stock at 46.70 the data suggests these ranges into Friday’s expiration.
Based on current IV (expected move per TOS): 43.62 to 49.78
Based on AVERAGE move over last 12 quarters: 43.71 to 49.69
Based on MAXIMUM move over last 12 Q’s (13.8%): 40.26 to 53.14
Open for requests on other symbols.
SPX 1-dte
#SPX1dte BTC $SPX Dec 14th 2580 puts for .20.
Sold $SPX Dec 17th 2500/2520-2665/2685 condors for 1.05.
Econ Calendar for week of 12/17/18
Fed decision released Wednesday at 2pm ET

Link to chart: https://us.econoday.com/byweek.asp?day=17&month=12&year=2018&cust=us&lid=0
SPX 1-dte
#SPX1dte Closed $SPX Dec 14th 2700 calls for .05. Stop level on the put spread is the expected move to the short put… EM is currently 24.00, so stop is 2604 for the 2580/2560 put spread. Unless we breach that level I will look to exit for .05 or .10. Sold condor yesterday for 1.05.
SPX 1-dte
#SPX1dte Sold $SPX Dec 14th 2560/2580-2700/2720 condors for 1.05. Expire tomorrow.
Also, a 45-dte roll from last month…
BTC $SPX Jan 17th 2950/2970 call spreads for .20. Sold 11/20 in a condor for 3.00 (2420/2400 puts still active)
Rolled to Jan 17th 2800/2820 call spreads, sold today for 2.55.
Calls sold
#LongLEAPs #SyntheticCoveredCalls
Sold $TQQQ Dec 21st 49 calls for .90
Sold $SQ Dec 21st 66 calls for .84
PVTL calls closed
#Earnings #CoveredCalls BTC $PVTL Dec 21st 21 covered calls for .05. Sold for .80 on Tuesday. Earning report has had little effect on the stock. Cost basis 19.00. Will continue to hold and sell calls.
COST earnings analysis
#Earnings $COST reports tonight. Below are details on earnings 1-day moves over the last 12 quarters.
Oct. 4, 2018 AC -5.55%
May 31, 2018 AC -0.55%
March 7, 2018 AC -0.89%
Dec. 14, 2017 AC 3.32%
Oct. 5, 2017 AC -5.97% Biggest DOWN
May 25, 2017 AC 1.79%
March 2, 2017 AC -4.33%
Dec. 7, 2016 AC 2.43%
Sept. 29, 2016 AC 3.40%
May 25, 2016 AC 3.57% Biggest UP
March 2, 2016 AC -0.77%
Dec. 8, 2015 AC -5.41%
Avg (+ or -) 3.17%
Bias -0.75%, slight negative bias on earnings.
With stock at 229.00 the data suggests these ranges.
Based on current IV (expected move per TOS): 220.17 to 237.83
Based on AVERAGE move over last 12 quarters: 221.75 to 236.25
Based on MAXIMUM move over last 12 Q’s (6.0%): 215.33 to 242.67
Open for requests on other symbols.
ADBE earnings analysis
#Earnings $ADBE reports tonight. Below are details on earnings 1-day moves over the last 12 quarters.
Sept. 13, 2018 AC 2.29%
June 14, 2018 AC -2.43%
March 15, 2018 AC 3.05%
Dec. 14, 2017 AC 1.43%
Sept. 19, 2017 AC -4.24%
June 20, 2017 AC 2.36%
March 16, 2017 AC 3.80%
Dec. 15, 2016 AC -1.47%
Sept. 20, 2016 AC 7.11% Biggest UP
June 21, 2016 AC -5.72% Biggest DOWN
March 17, 2016 AC 3.84%
Dec. 10, 2015 AC 2.76%
Avg (+ or -) 3.38%
Bias 1.07%, positive bias on earnings.
With stock at 251.00 the data suggests these ranges.
Based on current IV (expected move per TOS): 239.69 to 262.31
Based on AVERAGE move over last 12 quarters: 242.53 to 259.47
Based on MAXIMUM move over last 12 Q’s (7.1%): 233.15 to 268.85
Open for requests on other symbols.
SPX 1-dte
#SPX1dte Expired: $SPX Nov 12th 2560/2580/2715/2735 condors, sold yesterday for 1.05
Another KOLD closed
#ContangoETFs BTC $KOLD Dec 21st 12 put for .80. Sold for 2.30 on 11/19.

