

#SPX1dte Sold $SPX Dec 12th 2560/2580/2715/2735 condors for 1.05. Expire tomorrow.
Author Archives: Jeff
Calls closed
#LongLEAPs #SyntheticCoveredCalls
Closed $SQ Dec 14th 66 calls for .37. Sold yesterday for .72.
Closed $TQQQ Dec 14th 47 calls for .85. Sold yesterday for .80.
Slight profit and about breakeven on what I sold yesterday, since both very close to being breached this morning. Will replace on next big move.
KOLD closed
#ContangoETFs
Closed $KOLD Dec 21st 8 put for .20 and 9 put for .25. Both sold for 1.20 each on 11/19, as part of a roll campaign from ITM $BOIL calls.
PVTL covered Calls
#Earnings #CoveredCalls Sold $PVTL Dec 21st 21 calls for .80. This order has been in for a couple weeks, but only today did it finally fill, and earnings are tonight. Was assigned via 22.5 puts on 9/20. This sale brings my cost basis down to 18.95.
AAPL stock
#LongStock #Dividends
Bought $AAPL stock for 168.00. Starter position. Seems like a possible bottom, so reentering the stock after selling my position on October 5.
TQQQ calls
#LongLEAPs #SyntheticCoveredCalls
Sold $TQQQ Dec 14th 47 calls for .80
SQ calls
#LongLEAPs #SyntheticCoveredCalls
Sold $SQ Dec 14th 66 calls for .72.
SPX 1-dte cosed
#SPX1dte Closed $SPX Dec 10th 2710 calls for .05, and the 25120/2490 put spreads for .10. Condors sold for 1.00 on Friday. Next one will be sold tomorrow for Wednesday expiration.
SFIX earnings analysis
#Earnings $SFIX reports tonight. Below are details on earnings 1-day AND 5-day moves over its entire history (only 4 quarters). I included both 1 & 5 because of the significant differences in the moves.
NOTE: Stock has had wide swings in the days after earnings, and in last few days. This morning it was up 5.5% only 15 minutes into today.
Oct. 1, 2018 AC 1-day: -35.15%; 5-day: -41.07% Biggest DOWN
June 7, 2018 AC 1-day: +20.21%; 5-day: +22.42%
March 12, 2018 AC 1-day: +3.77%; 5-day: -15.42%
Dec. 19, 2017 AC 1-day: +39.39%; 5-day: -0.57% Biggest UP initially, but all given back in 5 days.
Avg (+ or -) 1-day : 24.63%; 5-day: 19.99%
Bias 1-day: +7.06%; 5-day: -8.66%, positive bias in 1 day; negative bias in 5 days.
With stock at 28.00 the data suggests these ranges.
Based on current IV (expected move into Friday’s expiration per TOS): 21.87 to 34.13
Based on AVERAGE move over last 12 quarters: 1-day: 21.10 to 34.90; 5-day: 22.44 to 33.56
Based on MAXIMUM move over last 12 Q’s: 1-day (39.4%): 16.97 to 39.03; 5-day (41.1%): 16.50 to 39.50
Open for requests on other symbols.
UVXY spread
#VXXGame Sold $UVXY Dec 21st 50/60 call spreads for 7.00. Adding to my position I started for 4.35. This is entirely ITM, but I feel volatility will be quieting into Christmas, and a drift back below 50 in reasonable to believe in 2 weeks. Even without a true Santa Claus rally this can happen. Looking at the VIX and UVXY today, they’ve been drifting lower this afternoon, even as SPX continued lower. If I am wrong, it’s manageable as a spread.
SPX 1-dte
#SPX1dte Sold $SPX Dec 10th 2490/2510-2710/2730 condors for 1.00. Expire Monday. Filled on spike higher. If I were selling now I would shift the whole thing higher.
Econ calendar for week of 12/10/18
Be sure to periodically click “Home/REFRESH” above to keep Bistro features updated.
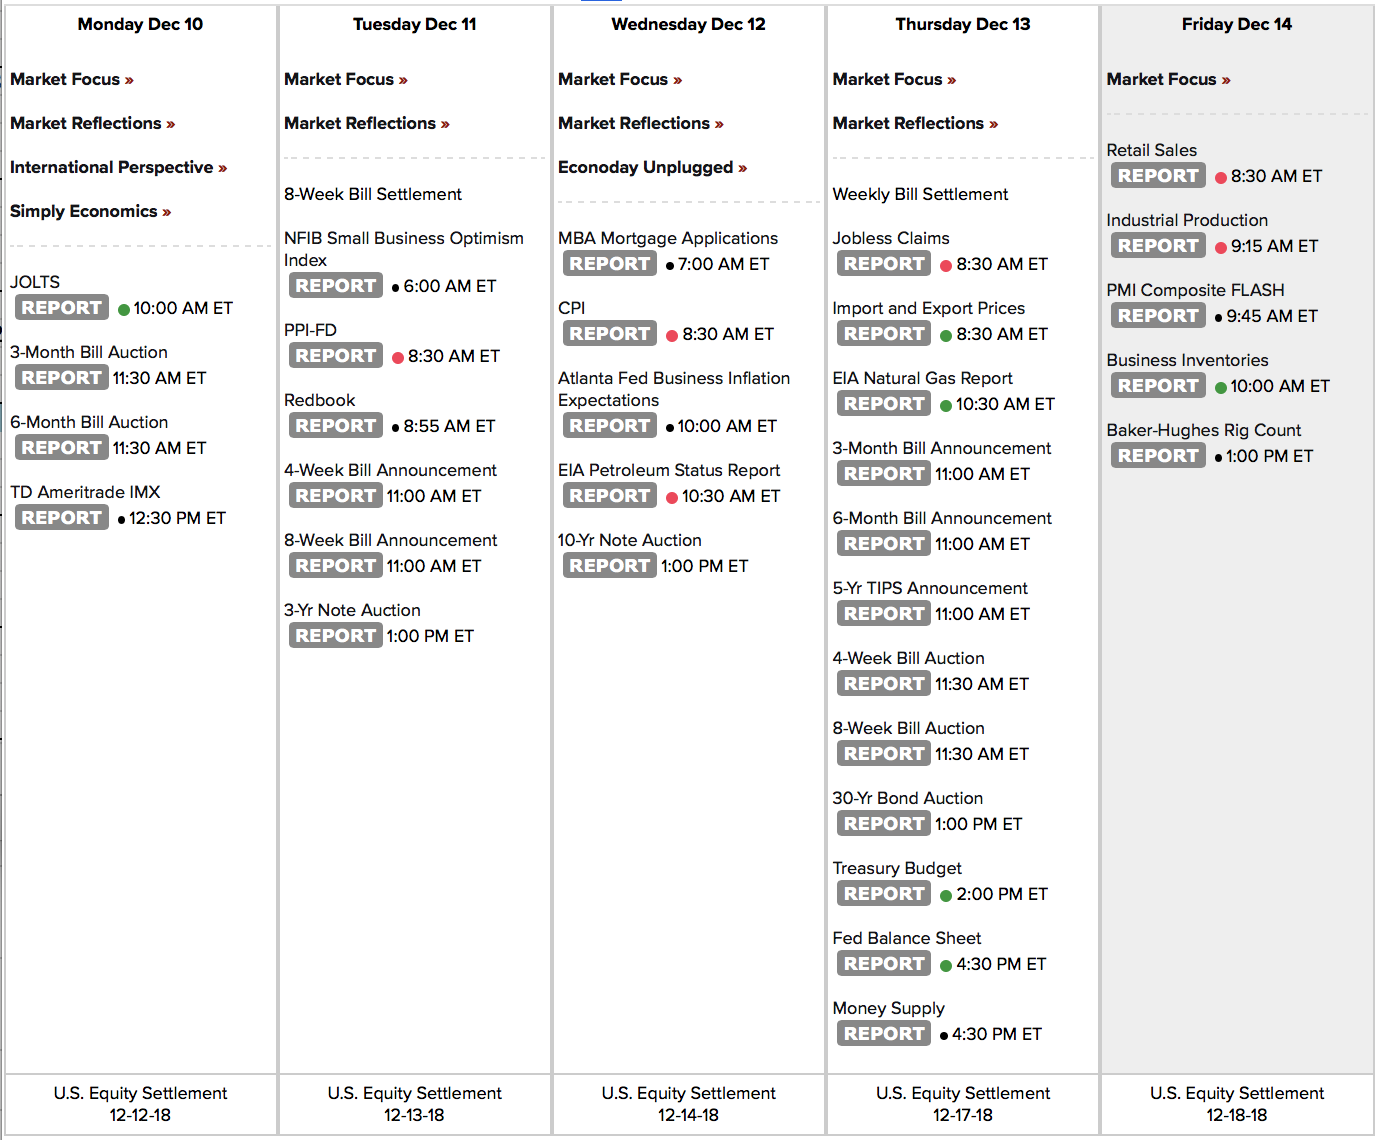

Link to calendar: https://us.econoday.com/byweek.asp?day=10&month=12&year=2018&cust=us&lid=0
Took FIVE
#Earning Sold $FIVE Dec 7th 98 puts for 1.30. That worked nicely.
Sold 100/98 spreads for .65.
Bought to close 100 puts for .55
Sold to close 98 puts for 1.30.
Total profit 1.40.
FIVE closed
#Earnings Bought to close $FIVE 100 puts for .55. The Dec 7th 100/98 put spreads were sold for .65 on Tuesday. Two days in a row we rose to over 106 in the morning, and then collapse to 100 or lower. Didn’t think it would happen twice so I didn’t close earlier. If we get another dump like yesterday, I can sell the 98 longs for fat profit.
SPX 1-dte
#SPX1dte Bought to close 2600/2575 put spreads for .10. Will close call spreads for .05.
November Jobs Report
#Jobs Lower than expected.
+155,000 non-farm payroll jobs, vs. 198K expected
Unemployment at 3.7%, unchanged
U6 unemployment at 7.6%, up by 0.2%
Wages up 0.2%, or 6 cents, 3.1% year over year
Labor force participation 62.9%, unchanged
October revised down from 250k to 237k
September revised up from 119k to 134k
SPX 1-dte
#SPX1dte Sold to Open $SPX Nov 7th 2600/2580 put spread for .75. Legging in since market is moving higher. Trying for 2750/2770 on call side.
ULTA earnings analysis
#Earnings $ULTA reports tonight. Below are details on earnings 1-day moves over the last 12 quarters.
Aug. 30, 2018 AC 6.37%
May 31, 2018 AC -0.71%
March 15, 2018 AC 7.63%
Nov. 30, 2017 AC -4.11%
Aug. 24, 2017 AC -9.13% Biggest DOWN
May 25, 2017 AC 3.19%
March 9, 2017 AC 4.62%
Dec. 1, 2016 AC -1.56%
Aug. 25, 2016 AC -6.11%
May 26, 2016 AC 9.10%
March 10, 2016 AC 17.27% Biggest UP
Dec. 3, 2015 AC 12.80%
Avg (+ or -) 6.88%
Bias 3.28%, positive bias on earnings.
With stock at 290.00 the data suggests these ranges.
Based on current IV (expected move per TOS): 271.98 to 308.02
Based on AVERAGE move over last 12 quarters: 270.04 to 309.96
Based on MAXIMUM move over last 12 Q’s (17.3%): 239.92 to 340.08
Open for requests on other symbols.
LULU earnings analysis
#Earnings $LULU reports tonight. Below are details on earnings 1-day moves over the last 12 quarters.
Aug. 30, 2018 AC 13.08%
May 31, 2018 AC 16.31% Biggest UP
March 27, 2018 AC 9.21%
Dec. 6, 2017 AC 6.42%
Aug. 31, 2017 AC 7.19%
June 1, 2017 AC 11.54%
March 29, 2017 AC -23.43% Biggest DOWN
Dec. 7, 2016 AC 15.04%
Sept. 1, 2016 AC -10.55%
June 8, 2016 BO 4.90%
March 30, 2016 BO 10.71%
Dec. 9, 2015 BO -13.11%
Avg (+ or -) 11.79%
Bias 3.94%, positive bias on earnings.
With stock at 133.50 the data suggests these ranges.
Based on current IV (expected move per TOS): 119.62 to 147.38
Based on AVERAGE move over last 12 quarters: 117.32 to 148.68
Based on MAXIMUM move over last 12 Q’s (23.4%): 101.84 to 164.16
Open for requests on other symbols.
AVGO earnings analysis
#Earnings $AVGO reports tonight. Below are details on earnings 1-day moves over the last 12 quarters.
Sept. 6, 2018 AC 7.69%
June 7, 2018 AC -2.53%
March 15, 2018 AC -4.81% Biggest DOWN
Dec. 6, 2017 AC 0.00%
Aug. 24, 2017 AC -3.70%
June 1, 2017 AC 8.49%
March 1, 2017 AC 0.99%
Dec. 8, 2016 AC 4.90%
Sept. 1, 2016 AC -2.24%
June 2, 2016 AC 4.93%
March 3, 2016 AC 6.35%
Dec. 2, 2015 AC 9.50% Biggest UP
Avg (+ or -) 4.68%
Bias 2.46%, positive bias on earnings.
With stock at 225.00 the data suggests these ranges.
Based on current IV (expected move per TOS): 212.36 to 237.64
Based on AVERAGE move over last 12 quarters: 214.48 to 235.52
Based on MAXIMUM move over last 12 Q’s (9.5%): 203.63 to 246.38
Open for requests on other symbols.
Econ Calendar revised
Revised with today’s holiday and Jerome Powell speaks after market close on Thursday.
https://wp.me/p6Nxuc-dV8
TQQQ calls closed
#LongLEAPs #SyntheticCoveredCalls Since these started the day ITM, taking profits now as this may be a sustained bounce.
BTC $TQQQ Dec 7th 51.5 calls for .55. Sold last week for 1.25.
SPX 1-dte
#SPX1-dte — in trouble again, last week to upside, today on downside. If we get no bounce I’m going to roll into an ATM or ITM put spread a week or two out.
UVXY call spread
#VXXGame Sold to Open $UVXY Dec 21st 50/60 call spreads for 4.35. Max risk 5.65, but also can manage to roll if we stay above this level for 2 more weeks.
Also, Sold UVXY Jan 2020 135 call for 9.50.
SQ calls closed
#LongLEAPs #SyntheticCoveredCalls BTC $SQ Dec 7th 67 calls for 1.00. Sold in a roll for 3.10 last week. Stock now at 65.00 after topping out at 73.00 yesterday.
FIVE earnings analysis
#Earnings $FIVE reports Wednesday afternoon. Below are details on earnings 1-day moves over the last 12 quarters.
Sept. 6, 2018 AC 13.31%
June 6, 2018 AC 21.86% Biggest UP
March 21, 2018 AC 4.20%
Nov. 30, 2017 AC -0.46%
Aug. 30, 2017 AC -3.45% Biggest DOWN
June 1, 2017 AC 0.50%
March 22, 2017 AC 10.80%
Dec. 1, 2016 AC 9.87%
Aug. 31, 2016 AC -1.14%
June 2, 2016 AC 2.07%
March 22, 2016 AC 6.81%
Dec. 3, 2015 AC 5.44%
Avg (+ or -) 6.66%
Bias 5.82%, strong positive bias on earnings.
With stock at 104.00 the data suggests these ranges.
Based on current IV (expected move per TOS): 94.10 to 113.90
Based on AVERAGE move over last 12 quarters: 97.07 to 110.93
Based on MAXIMUM move over last 12 Q’s (17.6%): 81.27 to 126.73
Open for requests on other symbols.
LULU date moved
#Earnings $LULU shifting to Thursday after close:
http://investor.lululemon.com/news-releases/news-release-details/lululemon-athletica-inc-announces-date-change-its-third-quarter
RH earnings
My apologies but they announced last night. Looks like they moved up a day at some point… TOS and others reflect it accurately but optionslam.com failed to move it.
SPX 1-dte
#SPX1dte My spread for today, Dec 3rd 2620/2640-2850/2870 condors, sold Friday for .95, will expire.
Sold $SPX Dec 5th 2715/2735-2830/2850 condors for .85. Expire tomorrow, the 4th, due to market closure on Wednesday.
Went from 210 points wide, down to 85.
Stock Market Closed this Wednesday
I am trying to determine when Wednesday SPX options will now settle. I have heard that it will be tomorrow, Tuesday, but have not confirmed.
https://www.marketwatch.com/story/what-george-hw-bushs-funeral-means-for-stock-market-bond-traders-commodities-2018-12-03/print
DG earnings analysis
#Earnings $DG reports ton tomorrow morning. Below are details on earnings 1-day moves over the last 12 quarters.
Aug. 30, 2018 BO -0.97%
May 31, 2018 BO -9.36%
March 15, 2018 BO 4.75%
Dec. 7, 2017 BO 2.77%
Aug. 31, 2017 BO -5.43%
June 1, 2017 BO 6.54%
March 16, 2017 BO 0.53%
Dec. 1, 2016 BO -4.96%
Aug. 25, 2016 BO -17.62% Biggest DOWN
May 26, 2016 BO 4.61%
March 10, 2016 BO 10.66% Biggest UP
Dec. 3, 2015 BO 4.23%
Avg (+ or -) 6.04%
Bias -0.35%, no significant bias on earnings.
Since it’s only Monday, I checked the 5-day moves… the most down was -15.6%, so less than 1-day, and the most up was 14.1%, more than the 1-day.
With stock at 111.00 the data suggests these ranges.
Based on current IV (expected move per TOS): 103.49 to 118.51
Based on AVERAGE move over last 12 quarters: 104.30 to 117.70
Based on MAXIMUM move over last 12 Q’s (17.6%): 91.44 to 130.56
Open for requests on other symbols.
AZO earnings analysis
#Earnings $AZO reports ton tomorrow morning. Below are details on earnings 1-day moves over the last 12 quarters.
Sept. 18, 2018 BO -1.97%
May 22, 2018 BO -9.48%
Feb. 27, 2018 BO -11.06%
Dec. 5, 2017 BO 0.42%
Sept. 19, 2017 BO -5.00%
May 23, 2017 BO -11.84% Biggest DOWN
Feb. 28, 2017 BO -0.58%
Dec. 6, 2016 BO 0.43%
Sept. 22, 2016 BO -0.42%
May 24, 2016 BO 2.47%
March 1, 2016 BO 2.06%
Dec. 8, 2015 BO 5.83% Biggest UP
Avg (+ or -) 4.30%
Bias -2.43%, negative bias on earnings.
Since it’s only Monday, I checked the 5-day moves… the extremes were LOWER than the 1-day moves, meaning extreme 1-day moves tend to fade over the following few days.
With stock at 815.00 the data suggests these ranges.
Based on current IV (expected move per TOS): 771.48 to 858.52
Based on AVERAGE move over last 12 quarters: 779.98 to 850.02
Based on MAXIMUM move over last 12 Q’s (11.8%): 718.50 to 911.50
Open for requests on other symbols.
SOXL call
#ContangoETF Sold to Open $SOXL Feb 150 call for 4.50. Against Feb 75 short put.
SPLK earnings
#Earnings Expiring: $SPLK Nov 30th 102/107/109 #BrokenWingButterfly, for a 3.00 credit at Exercise. Bought for 1.60 yesterday. I was trying to close for 3.05 or more, but wasn’t possible after stock moved above 110 and didn’t come back. My broker charges little to none for exercising ITM spreads.
SPX 1-dte
#SPXcampaign My condor for today, Nov 30th 2690/2710/2810/2830, is expiring (sold for .90). I wasn’t planning on doing one for Monday due to the chance for a huge gap on the China talks. However, IV is so high, that I was able to sell a very wide condor. My short strikes have been around 100 points apart in this last week. For Monday’s condor, they are 210 apart.
Sold $SPX Dec 3rd 2620/2640-2850/2870 condors for .95.
Short strikes are 115 points away on downside, 95 points on upside. We have exceeded those moves only once this year: to the downside on Feb 5th.
Econ Calendar for week of 12/3/18
Jobs Report is Friday morning

Link to Calendar: https://us.econoday.com/byweek.asp?day=3&month=12&year=2018&cust=us&lid=0
SPX 1-dte
#SPXcampaign Sold to Open $SPX Nov 30th 2690/2710/2810/2830 condors for .90. Expires tomorrow.
SPLK speculative trade
#Earnings Bought to Open $SPLK Nov 30th 102/107/109 #BrokenWingButterfly for 1.60.
This is a bullish trade. Breakeven at 103.60. No upside risk.
Max loss 1.60.
Max gain (if pin at 107) 3.40.
If it explodes above 109 gain will be 1.40.
Trump Xi meeting
From what I can find, it looks like their dinner is Saturday, which means markets may not be affected much tomorrow by the G-20 (unless other big news is generated). But it could mean a gap up or down on Monday. I’m guessing more likely up, as Trump will likely report that the meeting went well. But if his advisors are more bearish, as they usually have been on trade agreements, it could go anywhere.
SPLK earnings analysis
#Earnings I’m considering a bullish trade on SPLK… it has positive bias on earnings. Possible broken-wing BF with no upside risk.
$SPLK reports tonight. Below are details on earnings 1-day moves over the last 12 quarters.
Aug. 23, 2018 AC 14.81%
May 24, 2018 AC -5.20%
March 1, 2018 AC 9.26%
Nov. 16, 2017 AC 17.89% Biggest UP
Aug. 24, 2017 AC 8.47%
May 25, 2017 AC -6.97%
Feb. 23, 2017 AC -3.23%
Nov. 29, 2016 AC 0.41%
Aug. 25, 2016 AC -10.10% Biggest DOWN
May 26, 2016 AC 2.56%
Feb. 25, 2016 AC 7.73%
Nov. 19, 2015 AC -3.53%
Avg (+ or -) 7.51%
Bias 2.68%, positive bias on earnings.
With stock at 100.00 the data suggests these ranges.
Based on current IV (expected move per TOS): 89.71 to 110.29
Based on AVERAGE move over last 12 quarters: 92.49 to 107. 51
Based on MAXIMUM move over last 12 Q’s (17.9%): 82.11 to 117.89
Open for requests on other symbols.
GME earnings analysis
#Earnings $GME reports tonight. Below are details on earnings 1-day moves over the last 12 quarters.
Sept. 6, 2018 AC 0.06%
May 31, 2018 AC 3.93%
March 28, 2018 AC -10.81%
Nov. 21, 2017 AC 3.82%
Aug. 24, 2017 AC -10.92%
May 25, 2017 AC -5.92%
March 23, 2017 AC -13.60% Biggest DOWN
Nov. 22, 2016 AC 8.08% Biggest UP
Aug. 25, 2016 AC -10.63%
May 26, 2016 AC -3.93%
March 24, 2016 AC -0.59%
Nov. 23, 2015 BO -4.20%
Avg (+ or -) 6.37%
Bias -3.73%, significant negative bias on earnings.
With stock at 14.90 the data suggests these ranges.
Based on current IV (expected move per TOS): 13.49 to 16.31
Based on AVERAGE move over last 12 quarters: 13.80 to 15.68
Based on MAXIMUM move over last 12 Q’s (13.6%): 12.74 to 16.74
Open for requests on other symbols.
AMBA earnings analysis
#Earnings $AMBA reports tonight. Below are details on earnings 1-day moves over the last 12 quarters.
Aug. 30, 2018 AC -3.62%
June 5, 2018 AC -12.93%
March 1, 2018 AC 13.46%
Nov. 30, 2017 AC 14.29% Biggest UP
Aug. 31, 2017 AC -22.35% Biggest DOWN
June 6, 2017 AC -10.24%
Feb. 28, 2017 AC -4.42%
Dec. 1, 2016 AC -11.27%
Sept. 1, 2016 AC -6.67%
June 2, 2016 AC 9.39%
March 3, 2016 AC -8.93%
Dec. 3, 2015 AC -1.64%
Avg (+ or -) 9.93%
Bias -3.74%, negative bias on earnings.
With stock at 34.30 the data suggests these ranges.
Based on current IV (expected move per TOS): 29.86 to 38.74
Based on AVERAGE move over last 12 quarters: 31.04 to 37.88
Based on MAXIMUM move over last 12 Q’s (22.4%): 26.76 to 42.16
Open for requests on other symbols.
SQ calls rolled
#LongLEAPs #SyntheticCoveredCalls Rolled $SQ Nov 30th 66 calls to Dec 7th 67 calls for .10 credit
Earnings today
#Earnings A list of Bistro favorites… AMBA, GME, PANW, SPLK, VMW, WDAY. Not sure if I’ll be trading any, but let me know if you’d like analysis on any or all.
ANF partially closed
#Earnings #LongStraddle Sold to close $ANF Nov 30th 17 calls for 4.20. Sold half of my position. Holding the other half to see how the morning shakes out. Bought the straddle yesterday for 2.58.
ANF trade
#Earnings Bought to open $ANF Nov 30th 17 #LongStraddle for 2.58.
DLTR earnings analysis
#Earnings $DLTR reports tomorrow morning. Below are details on earnings 1-day moves over the last 12 quarters.
Aug. 30, 2018 BO -15.54% Biggest DOWN
May 31, 2018 BO -14.28%
March 7, 2018 BO -14.47%
Nov. 21, 2017 BO 2.41%
Aug. 24, 2017 BO 5.62%
May 25, 2017 BO 0.92%
March 1, 2017 BO 0.20%
Nov. 22, 2016 BO 8.15%
Aug. 25, 2016 BO -9.93%
May 26, 2016 BO 12.77% Biggest UP
March 1, 2016 BO 2.21%
Nov. 24, 2015 BO 6.62%
Avg (+ or -) 7.76%
Bias -1.28%, negative bias on earnings.
With stock at 83.30 the data suggests these ranges.
Based on current IV (expected move per TOS): 77.28 to 89.32
Based on AVERAGE move over last 12 quarters: 75.64 to 88.36
Based on MAXIMUM move over last 12 Q’s (15.5%): 69.26 to 94.74
Open for requests on other symbols.
TQQQ calls
#LongLEAPs #SyntheticCoveredCalls Sold $TQQQ Dec 7th 51.5 calls for 1.25.
ANF earnings analysis
#Earnings I’m including this one because of my interest in a long straddle. The cost of an ATM straddle is about 2.60, which would be about a 15% move in the stock, which is its AVERAGE move over recent quarters. I’ll consider whether to sell in the last hour.
$ANF reports tomorrow morning. Below are details on earnings 1-day moves over the last 12 quarters.
Aug. 30, 2018 BO -17.15%
June 1, 2018 BO -8.72%
March 7, 2018 BO 11.90%
Nov. 17, 2017 BO 23.90%
Aug. 24, 2017 BO 17.06%
May 25, 2017 BO 8.99%
March 2, 2017 BO 13.94%
Nov. 18, 2016 BO -13.76%
Aug. 30, 2016 BO -20.30% Biggest DOWN
May 26, 2016 BO -15.66%
March 2, 2016 BO 3.64%
Nov. 20, 2015 BO 25.03% Biggest UP
Avg (+ or -) 15.00%
Bias 2.41%, positive bias on earnings.
With stock at 17.25 the data suggests these ranges.
Based on current IV (expected move per TOS): 14.60 to 19.90
Based on AVERAGE move over last 12 quarters: 14.66 to 19.84
Based on MAXIMUM move over last 12 Q’s (25.0%): 12.93 to 21.57
Open for requests on other symbols.
SPX 1-dte
#SPXcampaign Still working on this new approach… thought I’d share my big error on today’s spread.
I sold the $SPX Nov 28th 2590/2610-2710/2730 for 1.15 yesterday at 1:38p ET, when SPX was at 2672.
After selling, the SPX creeped higher into the close. Even so, my call spread side did NOT increase much. With the threat of a gap up opening, and a slow rise into the close, I could have closed the calls for about .70, and let puts expire today, for an overall profit on the trade, same day. But it didn’t rise enough to hit my stop, so I opted to stay in.
That turned out to be only a minor error: Consider taking profits same day if volatility drops enough in the last hour to exit with decent profit, and erase overnight risk. But, in this case, the gap up this morning wasn’t bad, and I could have closed at the open for a small loss.
Further more, my call side DID hit its stop this morning, when the expected move touched my 2710 short calls. This means I should have exited, and COULD have exited for a profit on the fade back down to 2685 area. But I didn’t. And as it bounced, I was not focused…. I should have realized the volatility risk with Powell’s comments, but I didn’t and was focused on record keeping and other non-trade issues.
Now I’m 10 points ITM. Faced with possibility of a chunky loss if there’s no fade. Don’t know how I’ll roll yet.
1. Take partial profits if they present themselves early.
2. Follow rules even if you believe that waiting for better exits will work.
3. Focus on market events you KNOW are coming. Don’t get distracted or complacent.
CRM closed
#Earnings Closed $CRM 138/143 call spreads for .51. Closed short 118 puts for .04. Leaving long 113 puts as lottery ticket.
Condors sold yesterday for 1.09.
Fed’s Powell, and other market movers
Busy day; market movers with red dot.
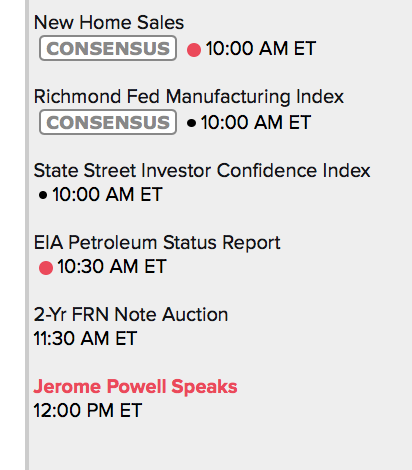
Closed Z door
#Earnings #Assignment Closed remaining $Z stock, selling at 34.90. Cost basis 32.55. Waited for a couple weeks for stock to return to profit zone, and exited all this week.
CRM trade
#Earnings Sold to Open $CRM Nov 30th 113/118/138/143 condors for 1.09. Leans slightly bullish.
SPX 1-dte sold
#SPXcampaign Sold $SPX Nov 28th 2590/2610-2710/2730 condors for 1.15. Expires tomorrow.
Sold more Z
#Earnings #Assignment Sold more $Z stock at 33.50. Assigned with cost basis of 32.55.
WB earnings analysis
#Earnings $WB reports tomorrow morning. Below are details on earnings 1-day moves over the last 12 quarters.
Aug. 8, 2018 BO -4.04%
May 9, 2018 BO -14.19%
Feb. 13, 2018 BO 9.59%
Nov. 7, 2017 BO 0.07%
Aug. 9, 2017 BO 1.12%
May 16, 2017 BO 24.96% Biggest UP
Feb. 22, 2017 AC -16.01% Biggest DOWN
Nov. 21, 2016 AC 7.34%
Aug. 8, 2016 AC 12.48%
May 11, 2016 AC -1.12%
March 2, 2016 AC 9.48%
Nov. 18, 2015 AC 1.98%
Avg (+ or -) 8.53%
Bias 2.64%, positive bias on earnings.
With stock at 59.00 the data suggests these ranges.
Based on current IV (expected move per TOS): 52.46 to 65.54
Based on AVERAGE move over last 12 quarters: 53.97 to 64.03
Based on MAXIMUM move over last 12 Q’s (25.0%): 44.27 to 73.73
Open for requests on other symbols.
CRM earnings analysis
#Earnings $CRM reports tonight. Below are details on earnings 1-day moves over the last 12 quarters.
Aug. 29, 2018 AC -1.71%
May 29, 2018 AC 1.90%
Feb. 28, 2018 AC 2.73%
Nov. 21, 2017 AC -1.81%
Aug. 22, 2017 AC 0.12%
May 18, 2017 AC -0.39%
Feb. 28, 2017 AC 3.02%
Nov. 17, 2016 AC 3.43%
Aug. 31, 2016 AC -4.41% Biggest DOWN
May 18, 2016 AC 4.13%
Feb. 24, 2016 AC 11.03% Biggest UP
Nov. 18, 2015 AC 4.25%
Avg (+ or -) 3.24%
Bias 1.86%, positive bias on earnings.
With stock at 124.50 the data suggests these ranges.
Based on current IV (expected move per TOS): 115.24 to 133.76
Based on AVERAGE move over last 12 quarters: 120.46 to 128.54
Based on MAXIMUM move over last 12 Q’s (11.0%): 110.77 to 138.23
Open for requests on other symbols.
SPX 1-dte expired
#SPXcampaign Expired: $SPX Nov 26th 2560/2580-2690/2710 condors, sold Friday for 1.15.
A few more UVXY
#VXXGame
Closed my other $UVXY March 112 call for 3.25. Sold for 7.00.
Closed UVXY Jan 18th 95 call for 1.87. Sold for 6.90.
Bought (2) Dec 7th 100 calls for .18. Released 4.5K in buying power.
Sold Z stock
#Earnings #Assignment Sold to close $Z stock for 32.80. Was assigned with a cost basis of 32.55. Sold a 4th of my position now. Will look for higher prices near the close or tomorrow to sell more. No desire to be long or sell calls.
UVXY prep
#VXXGame – My current view on the market into year-end: one more shove lower, hopefully with a panic dive toward 2500. Then, higher into year end and January.
I making a couple of $UVXY moves to free up some buying power so I can sell higher-premium calls on that dive.
Bought to Open UVXY Dec 21st 140 calls for .12. I have more long calls than short ones… they are all far OTM but will help manage the chaos should UVXY decide to shoot up to 100 on the panic.
Bought to Close UVXY Jan 18th 112 call for 1.30. Sold for 5.25.
Bought to Close UVXY March 15th 112 call for 3.70. Sold for 7.00, avg price.
SPX call spread
#SPXcampaign Sold $SPX Dec 7th 2720/2745 call spreads for 5.80.
Econ Calendar for week of 11/26/18
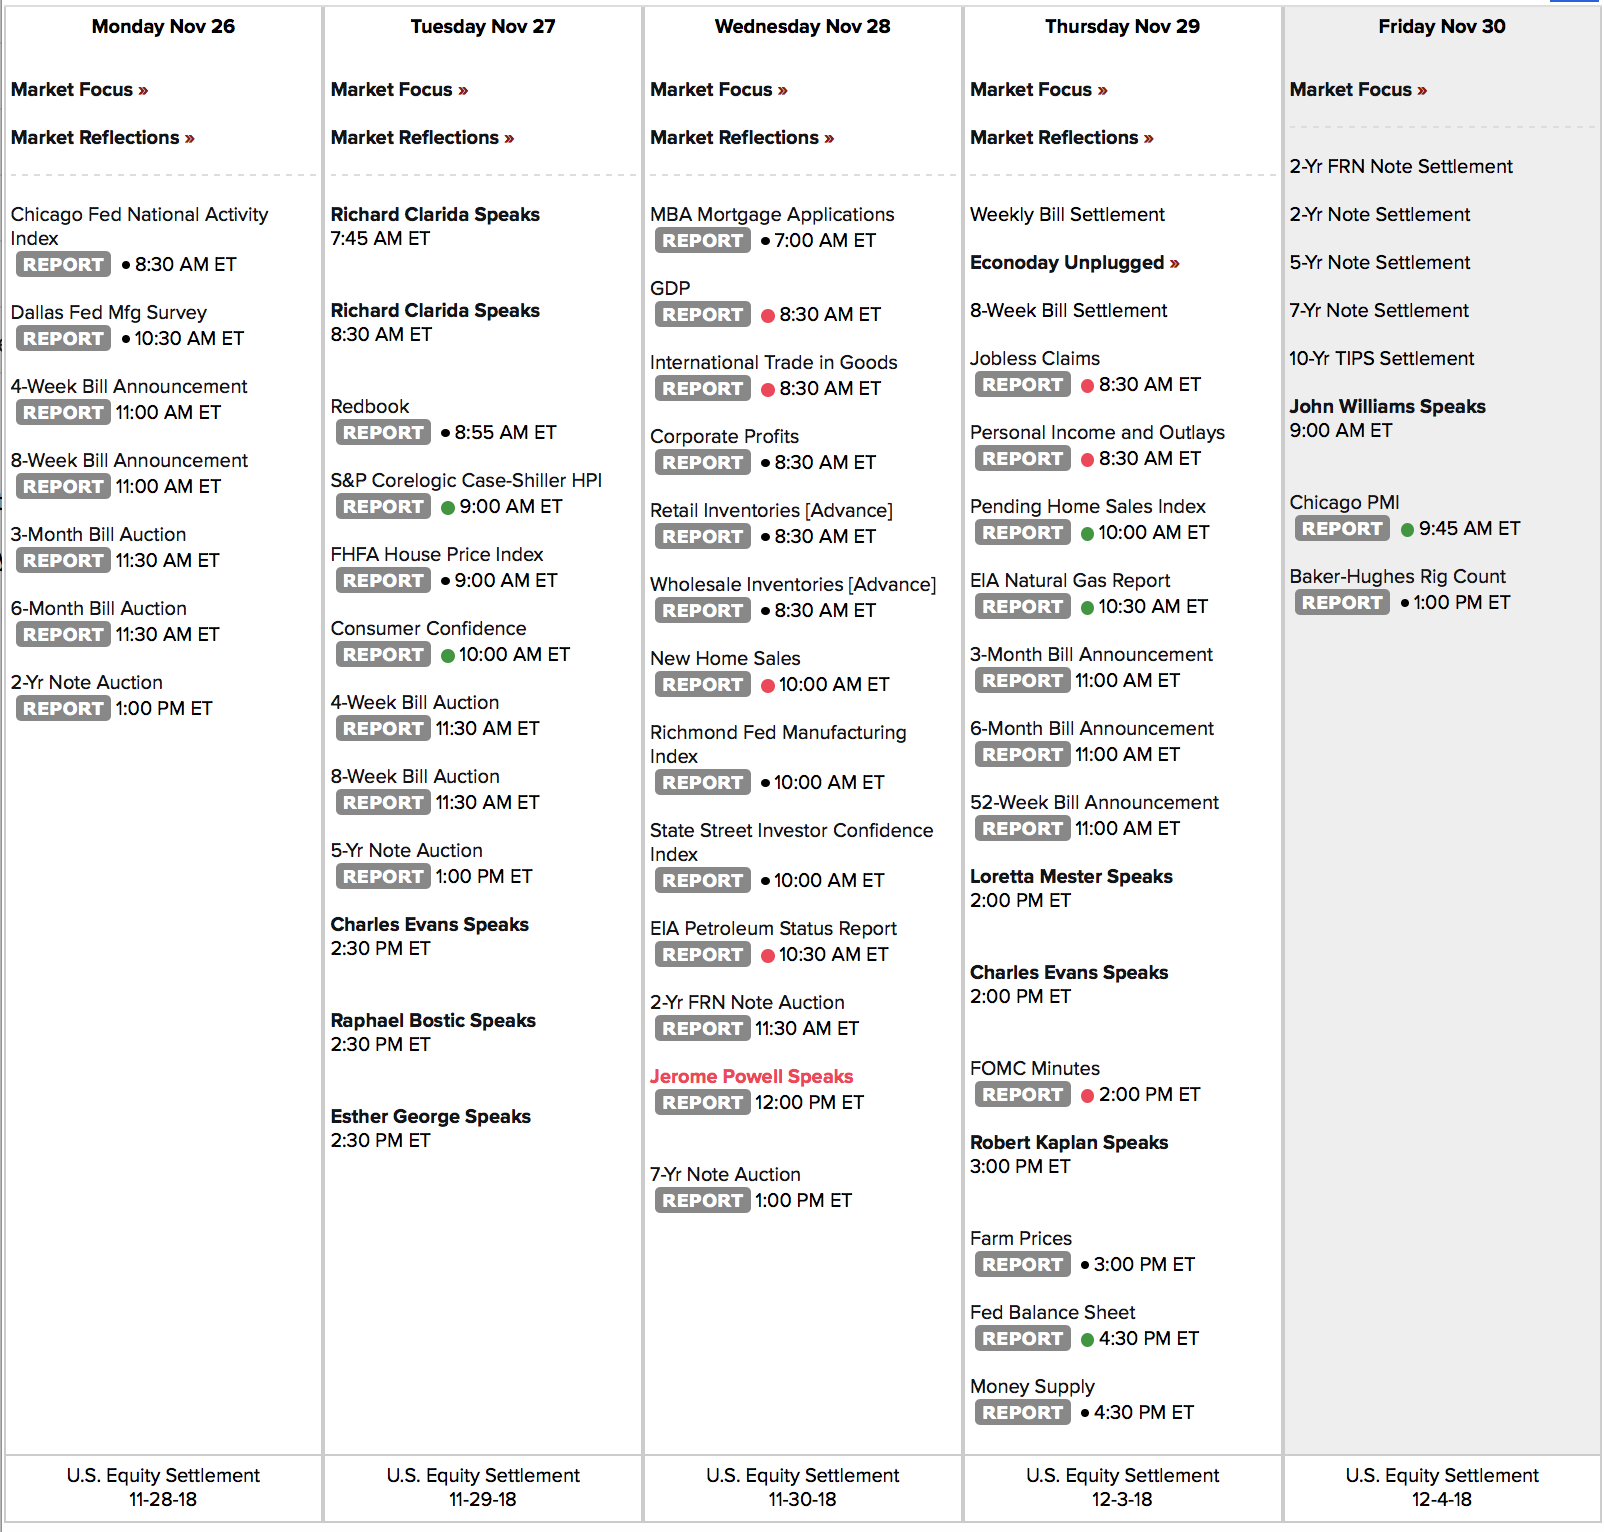
Link to chart: https://us.econoday.com/byweek.asp?day=26&month=11&year=2018&cust=us&lid=0
VXX call closed
#VXXgame BTC $VXX Dec 21st 50 call for .77. Sold for 3.50 on July 11th.
SPX 1-dte sold
#SPXcampaign Sold to Open $SPX Nov 26th 2560/2580-2690/2710 for 1.15. Expires Monday.
SPX 1-dte closed
#SPXcampaign Closed $SPX 2600/2620/2705/2725 condors for .20. Sold for .95 on Wednesday.
Music to watch the ticks by
A classic for a dull trading day…

See you all Friday!
SQ calls
#LongLEAPs #SyntheticCoveredCalls
Sold $SQ Nov 30th 66 calls for 1.15
SPX 1-dte
#SPXcampaign Sold to Open $SPX Nov 23rd 2600/2620 – 2705/2725 condors for .95. Expire Friday.
SPX 1-dte closed
$SPXcampaign Sold the 2550/2470-2740/2760 condors yesterday for .85.
Closed for .10 today; closed the short calls for .05 in the pre-market, then the put spread just closed for .05.
Selling another later today for Friday expiry
ADSK earnings analysis
#Earnings $ADSK reports tonight. Below are details on earnings 1-day moves over the last 12 quarters.
Decent premium available outside the recent maximum moves.
Aug. 23, 2018 AC 15.32% Biggest UP
May 24, 2018 AC -4.44%
March 6, 2018 AC 14.87%
Nov. 28, 2017 AC -15.85% Biggest DOWN
Aug. 24, 2017 AC 3.94%
May 18, 2017 AC 14.69%
March 2, 2017 AC -2.29%
Nov. 29, 2016 AC -3.52%
Aug. 25, 2016 AC 8.11%
May 19, 2016 AC -2.31%
Feb. 25, 2016 AC 3.58%
Nov. 19, 2015 AC -2.94%
Avg (+ or -) 7.66%
Bias 2.43%, positive bias on earnings.
With stock at 122.50 the data suggests these ranges.
Based on current IV (expected move per TOS): 109.95 to 135.05
Based on AVERAGE move over last 12 quarters: 113.25 to 132.03
Based on MAXIMUM move over last 12 Q’s (15.9%): 103.20 to 142.08
Open for requests on other symbols.
BBY earnings were this morning
That’s an error on the side chart… $BBY announced this morning, NOT later today.
SPX 1-dte
#SPXcampaign Sold to Open $SPX Nov 21st 2550/2570-2740/2460 condors for .85. Expires tomorrow.

