

#Earnings #PreEarnings Well, this was my only attempt since early October at long calls leading up to earnings. Aaaaand, face plant.
Author Archives: Jeff
TQQQ calls closed
#LongLEAPs #SyntheticCoveredCalls
BTC $TQQQ Nov 23rd 50 calls for .15. Sold Thursday for 1.15.
SPX 1-dte
#SPXcampaign Stopped out on my 2685/2665 put spread for 3.75. Will roll into a longer term spread.
UVXY trades
#VXXGame Sold to Open $UVXY June 90/140 call spreads for 5.70.
Also, earlier, I bought 2 Dec 7th 110 calls for .26, which relieved over $5K in buying power.
SQ calls closed
#LongLEAPs #SyntheticCoveredCalls
BTC $SQ Nov 23rd 74 calls for .12. Sold Thursday for 1.16.
Since I’m long LEAPs I kind of wish these calls didn’t devalue so quickly.
Sold KOLD
#ContangoETFs Sold $KOLD Dec 21st 12 put for 2.30.
TSLA condor
#IronCondor Sold to open $TSLA Nov 23rd 340/350/380/390 condors for 2.94. Expire Friday. This is a bullish placement… I actually meant to make it dead center but screwed up the put strikes. It does seem headed higher in honey-badger fashion.
Options Expiration 11/16/18
#OptionsExpiration A couple of losers this week:
$NVDA 185/180 put spreads, sold for 1.10 yesterday. Decided not to take stock due to heavy margin cost. I’ll get it back by making bullish plays, but wait for a better sign of QQQ and NVDA recovering.
$SPX long 284 calls. Bought for 1.71 average, back in the early days of this correction, where I was believing it would be a quicker “V” shaped October.
KOLD put
#ContangoETFs Sold $KOLD Dec 13 put for 2.30. A safer bet since KOLD is closer to zero than the BOIL calls are to infinity.
SPX 1-dte
#SPXcampaign STO $SPX Nov 19th 2665/2685-2780/2800 condors for 1.15. Volatility the lowest of the week, so this is a much narrower condor than the previous one. I’m expecting it to be a low volume week, but those can sometimes result in fairly quick rallies.
BOIL call
#ContangoETFs Sold to Open $BOIL March 105 call for 6.80. Building back recent losses slowly.
Econ Calendar for week of 11/19/18
Be sure to periodically click “Home/REFRESH” to keep Bistro features updated.
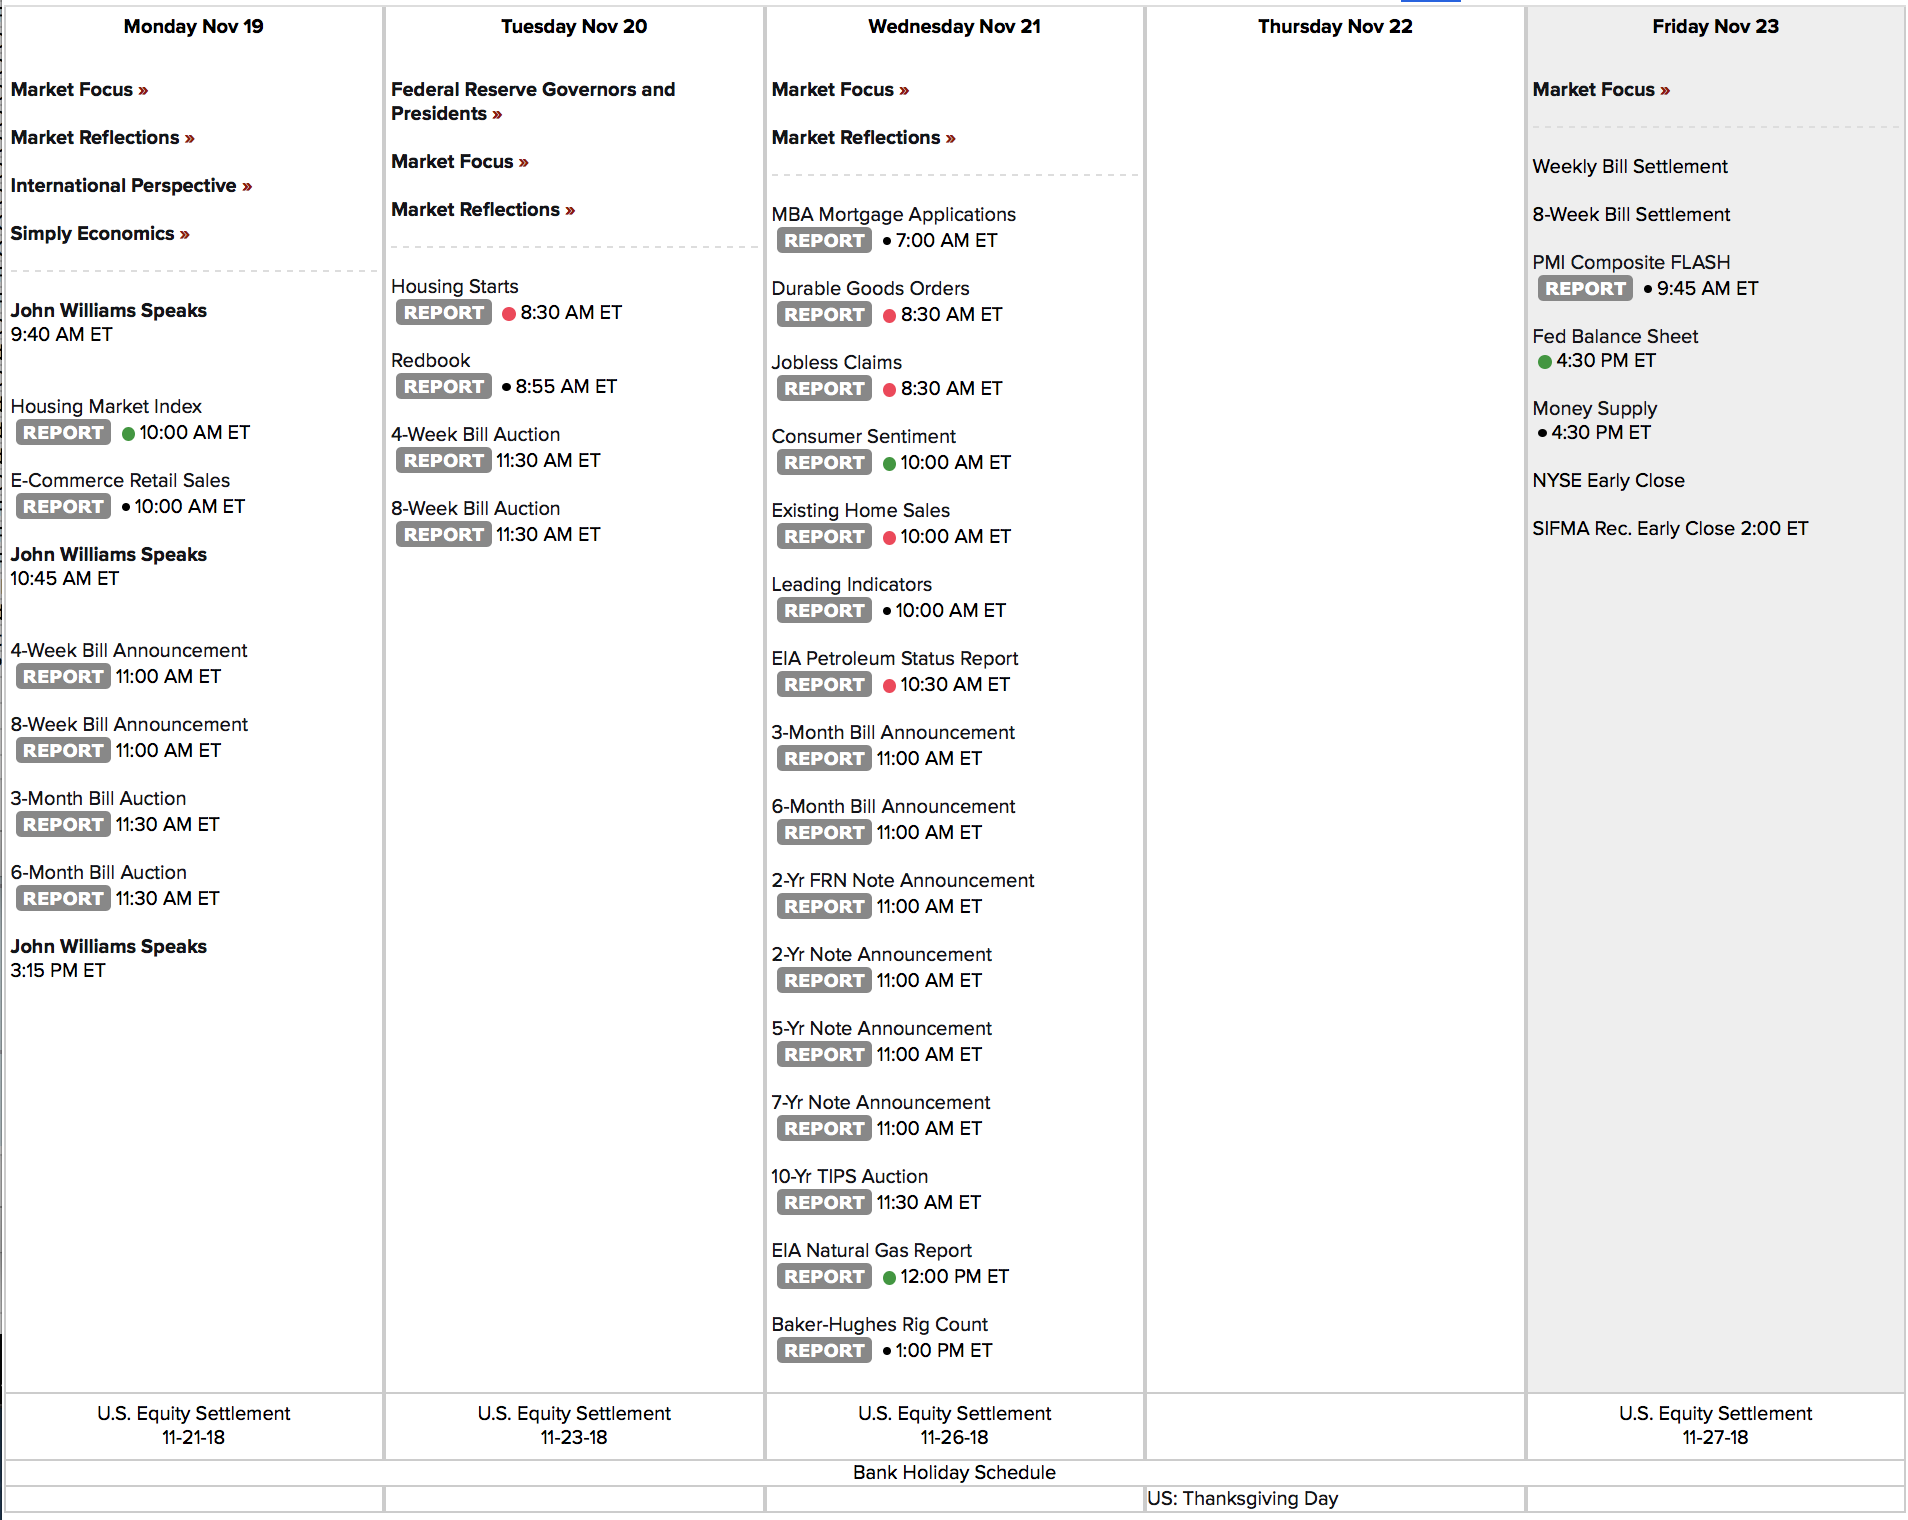

Link to calendar: https://us.econoday.com/byweek.asp?day=19&month=11&year=2018&cust=us&lid=0
SPX 1-dte put closed
#SPXcampaign BTC $SPX Nov 16th 2630/2650 put spreads for .10. Condor sold for 1.15 yesterday. I’ll let the 2790/2810 call side expire. Selling one for Monday later today.
NVDA earnings trade
#Earnings Sold to Open $NVDA Nov 16th 185/180 put spreads for 1.11. Short strike is -7.7% OTM, and NVDA biggest downside move was -5.3% (in last 12 quarters)
SPX 1-dte action
#SPXcampaign Everything just started happening on this spike down. Multiple orders filled:
BTC $SPX Nov 15th (monthlys) 2765/2785 call spreads for .30. Puts closed earlier for .05. Condor sold yesterday for 1.05. Removed overnight gap risk.
Sold to Open $SPX Nov 16th 2630/2650/2790/2810 condors for 1.15. The volatility bump got me filled. Mid-price said only .80 a few minutes ago.
Also: Bought to Open $VIX Jan15th 16 puts for .75. My Nov puts didn’t work, my Dec puts might, and now I have Jan!
#VXXgame
Boiling over, then under
On pace to be the first time natural gas has risen 15%+ on one day and declined 15%+ the day after. $UNG
— Bespoke (@bespokeinvest) November 15, 2018
Covered Calls
#SyntheticCoveredCalls Selling calls against #LongLEAPs
Sold $TQQQ Nov 23rd 50 calls for 1.15
Sold $SQ Nov 23rd 74 calls for 1.16
SPX moves
#SPXcampaign BTC $SPX 1-dte Nov 15th (monthlys) 2580/2560 put spread for .05. Order in to close 2765/2785 call spread for the same. Condor sold yesterday for 1.05. Cannot allow to expire because these monthlys settle tomorrow morning, and a gap could kill you.
I will be selling another one for tomorrow afternoon expiration.
Also, stopped $SPX Nov 23rd 2650/2630 put spreads for 5.25. Condor sold as a roll last week for 2.80. Will look into a new roll. I stopped this out after this morning’s dip… it looks now like that may have been a bottom, at least for short term. At least, I waited to close after the bounce was well underway.
AMAT earnings analysis
#Earnings $AMAT reports tonight. Below are details on earnings 1-day moves over the last 12 quarters.
Aug. 16, 2018 AC -7.71%
May 17, 2018 AC -8.24% Biggest DOWN
Feb. 14, 2018 AC 3.89%
Nov. 16, 2017 AC -2.33%
Aug. 17, 2017 AC 2.73%
May 18, 2017 AC 0.38%
Feb. 15, 2017 AC -0.87%
Nov. 17, 2016 AC 0.03%
Aug. 18, 2016 AC 7.08%
May 19, 2016 AC 13.81% Biggest UP
Feb. 18, 2016 AC 7.04%
Nov. 12, 2015 AC 4.29%
Avg (+ or -) 4.87%
Bias 1.68%, positive bias on earnings.
With stock at 34.20 the data suggests these ranges.
Based on current IV (expected move per TOS): 31.62 to 36.78
Based on AVERAGE move over last 12 quarters: 32.55 to 35.89
Based on MAXIMUM move over last 12 Q’s (13.8%): 29.49 to 38.95
Open for requests on other symbols.
NVDA earnings analysis
#Earnings $NVDA reports tonight. Below are details on earnings 1-day moves over the last 12 quarters.
Aug. 16, 2018 AC -4.90%
May 10, 2018 AC -2.15%
Feb. 8, 2018 AC 6.69%
Nov. 9, 2017 AC 5.26%
Aug. 10, 2017 AC -5.32% Biggest DOWN
May 9, 2017 AC 17.82%
Feb. 9, 2017 AC -2.37%
Nov. 10, 2016 AC 29.80% Biggest UP
Aug. 11, 2016 AC 5.59%
May 12, 2016 AC 15.20%
Feb. 17, 2016 AC 8.60%
Nov. 5, 2015 AC 13.85%
Avg (+ or -) 9.80%
Bias 7.34%, strong positive bias on earnings.
With stock at 200.00 the data suggests these ranges.
Based on current IV (expected move per TOS): 179.14 to 220.86
Based on AVERAGE move over last 12 quarters: 180.41 to 216.59
Based on MAXIMUM move over last 12 Q’s (29.8%): 140.40 to 259.60
NOTE: the max move down (-5.3%) is dwarfed by the max move up (+29.8%).
Open for requests on other symbols.
SPX 1-dte sold
#SPXcampaign Sold to open $SPX Nov 15th (monthlys) 2560/2580-2765/2785 condors for 1.05. Stop trading at tomorrow’s close, but settling Friday morning. So I will be closing the full position tomorrow.
BOIL & DUST closed
#ContangoETFs I’m shedding one a day. I can’t roll these, as the current mania could keep going higher. They will have to be made up with multiple smaller premium trades after things settle down.
BTC $BOIL Jan 18th 45 call for 23.60. Sold for 2.40 (avg price) in Sept/Oct. Closed this morning before the move from 60 to 70. I have 4 ITM contracts remaining.
BTC $DUST Jan 18th 50 call for 1.10. Sold for 4.00 on Aug 16th.
BOIL stats
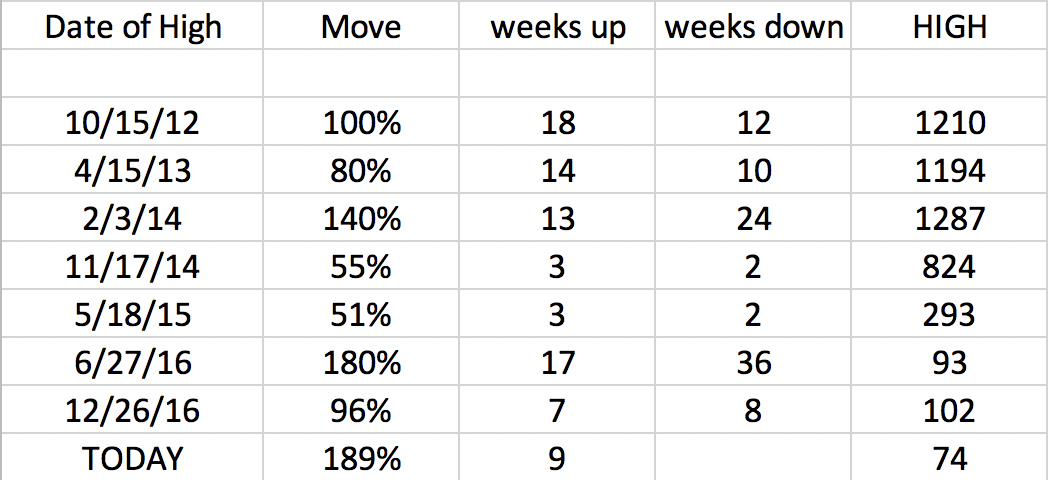
#ContangoETFs I searched back for spikes on BOIL that were over 50%. Below is a chart with:
Date of the High
Percentage up from the recent low
Weeks it took to go UP low to high
Weeks it took to go back DOWN to the low (or at least in the neighborhood)
As you can see, from a percentage basis, this current spike is the highest. We also got here more quickly than other spikes above 100%. I don’t know whether we can say that this means we should be topping. But the freak out of current traders, being long oil and short NatGas, is largely responsible for what we’re seeing now.
We know it will drop again, but cannot say how long that will take or how high it will go first.
CSCO earnings analysis
#Earnings $CSCO reports tonight. Below are details on earnings 1-day moves over the last 12 quarters.
Aug. 15, 2018 AC 2.96%
May 16, 2018 AC -3.76%
Feb. 14, 2018 AC 4.72%
Nov. 15, 2017 AC 5.18%
Aug. 16, 2017 AC -4.01%
May 17, 2017 AC -7.21% Biggest DOWN
Feb. 15, 2017 AC 2.37%
Nov. 16, 2016 AC -4.81%
Aug. 17, 2016 AC -0.78%
May 18, 2016 AC 3.18%
Feb. 10, 2016 AC 9.64% Biggest UP
Nov. 12, 2015 AC -5.82%
Avg (+ or -) 4.54%
Bias 0.14%, no significant bias on earnings.
With stock at 45.00 the data suggests these ranges.
Based on current IV (expected move per TOS): 42.29 to 47.71
Based on AVERAGE move over last 12 quarters: 42.96 to 47.04
Based on MAXIMUM move over last 12 Q’s (9.6%): 40.66 to 49.34
Open for requests on other symbols.
SPX 1-dte closed
#SPXcampaign BTC $SPX Nov 14th 2645/2625 put spread for .15. Condor sold yesterday for 1.15. Leaving calls to expire.
WMT earnings analysis
#Earnings $WMT reports tomorrow morning. Below are details on earnings 1-day moves over the last 12 quarters.
Aug. 16, 2018 BO 9.33%
May 17, 2018 BO -1.90%
Feb. 20, 2018 BO -10.17% Biggest DOWN
Nov. 16, 2017 BO 10.89% Biggest UP
Aug. 17, 2017 BO -1.58%
May 18, 2017 BO 3.22%
Feb. 21, 2017 BO 2.99%
Nov. 17, 2016 BO -3.08%
Aug. 18, 2016 BO 1.87%
May 19, 2016 BO 9.58%
Feb. 18, 2016 BO -3.01%
Nov. 17, 2015 BO 3.54%
Avg (+ or -) 5.10%
Bias 1.81%, positive bias on earnings.
With stock at 102.00 the data suggests these ranges.
Based on current IV (expected move per TOS): 96.98 to 107.02
Based on AVERAGE move over last 12 quarters: 96.80 to 107.20
Based on MAXIMUM move over last 12 Q’s (10.9%): 90.89 to 113.11
Open for requests on other symbols.
NTES earnings analysis
#Earnings $NTES reports tonight. Below are details on earnings 1-day moves over the last 12 quarters.
Aug. 8, 2018 AC -10.96%
May 16, 2018 AC -7.45%
Feb. 7, 2018 AC -6.27%
Nov. 15, 2017 AC 7.85%
Aug. 9, 2017 AC -9.77%
May 10, 2017 AC -0.82%
Feb. 15, 2017 AC 14.08% Biggest UP
Nov. 9, 2016 AC -9.22%
Aug. 17, 2016 AC -2.67%
May 11, 2016 AC 0.43%
Feb. 24, 2016 AC -14.80% Biggest DOWN
Nov. 11, 2015 AC 2.17%
Avg (+ or -) 7.21%
Bias -3.12%, negative bias on earnings.
With stock at 219.00 the data suggests these ranges.
Based on current IV (expected move per TOS): 202.42 to 235.58
Based on AVERAGE move over last 12 quarters: 203.22 to 234.78
Based on MAXIMUM move over last 12 Q’s (14.8%): 186.59 to 251.41
Open for requests on other symbols.
SPX calls closed
#SPXcampaign On this morning’s strength, don’t want to get stuck in this one if we continue higher, so taking a smaller loss now rather than facing a bigger roll decision in a few days.
BTC $SPX Nov 30th 2790/2815 call spreads for 7.35. Sold for 6.25 yesterday.
SPX 1-dte
#SPXcampaign Sold to Open $SPX Nov 14th 2625/2645/2775/2795 condors for 1.15. Expires tomorrow. Stop is 10 points before short strikes.
TGT 3rd batch
#Earnings BTO $TGT Nov 23rd 89 calls for 1.05. Avg price on full position: 1.31.
This market is NOT allowing these trades to work. This is supposed to be closed before earnings, so next Monday (earnings Tues morn). We’ll have to see market strength into the weekend for this to have a shot.
M reports in the morning
#Earnings I missed this on my side chart: $M (Macy’s) reports Wednesday morning.
SPX bearish
#SPXcampaign Sold to Open $SPX Nov 30th 2790/2815 call spreads for 6.25.
BOIL strikes
#ContangoETFs Surge continues. New strikes added up to 66.
SPX condor closed
#SPXcampaign BTC $SPX Nov 30th 2675/2700/2875/2900 condor for 7.95. I legged into this condor for 11.25 total. Had to close it today… all the profit came from the call side.
SPX 1-dte closed
#SPXcampaign Bought to close $SPX Nov 12th 2730/2710 put spread for 1.20, breakeven covering commissions of the condor sold for 1.25 on Friday. I was trying to change my order for a lower price, but it drops so quickly on the tiniest of bounces that it grabbed my bid before I could change it.
I’ve been discussing these trades with some people today and comparing performance. I think one of my weak spots is entering these trades too late in the day, and also after a bounce has already dropped volatility dramatically. I believe if I had entered this condor an hour earlier on Friday, I could have been 20 or 30 points farther out of the money. I’ll be watching this closely for a good entry tomorrow for Wednesday expiration.
Blood bath resumes
#Market Well, so much for the post-election rally. AAPL getting whacked, unlike in October, so it seems all bets are off. We could just remain in this wide range into year end, but things are not pretty with two days in a row like this.
Had to stop out on $TWLO puts with a loss… a painful whipsaw for me on the earnings trade. Staying away for now as it is still dropping.
No TSLA trade this week because margin req are jacked on that ticker by my broker.
BTC $DUST Mar 15th 60 call for 1.15. Sold for 3.65 (avg price) in Aug/Sept)
Stopped $BOIL Mar 15th 45 call for 8.00. Sold for 2.40, avg price. Working on some rolls to the new 60 strikes..
HD earnings analysis
#Earnings $HD reports tomorrow morning. Below are details on earnings 1-day moves over the last 12 quarters. (I checked 5-day moves and the only value higher than those below was a +7% move for Nov 2015)
Aug. 14, 2018 BO -0.53%
May 15, 2018 BO -1.62%
Feb. 20, 2018 BO -0.13%
Nov. 14, 2017 BO 1.63%
Aug. 15, 2017 BO -2.65%
May 16, 2017 BO 0.59%
Feb. 21, 2017 BO 1.41%
Nov. 15, 2016 BO -2.56%
Aug. 16, 2016 BO -0.60%
May 17, 2016 BO -2.46%
Feb. 23, 2016 BO 1.36%
Nov. 17, 2015 BO 4.41%
Avg (+ or -) 1.66%
Bias -0.10%, no significant bias on earnings.
With stock at 185.00 the data suggests these ranges.
Based on current IV (expected move per TOS): 176.22 to 193.78
Based on AVERAGE move over last 12 quarters: 181.92 to 188.08
Based on MAXIMUM move over last 12 Q’s (4.4%): 176.84 to 193.16
Open for requests on other symbols.
TQQQ calls
#SyntheticCoveredCalls #LongLEAPs
BTC $TQQQ Nov 16th 59 calls for .15. Sold for 1.25 last Wednesday
SPX 1-dte
#SPXcampaign Sold to Open $SPX Nov 12th 2710/2730/2815/2835 for 1.25. Expires Monday.
Econ Calendar for week of 11/12/18
Be sure to periodically click Home/REFRESH above to keep Bistro features updated.
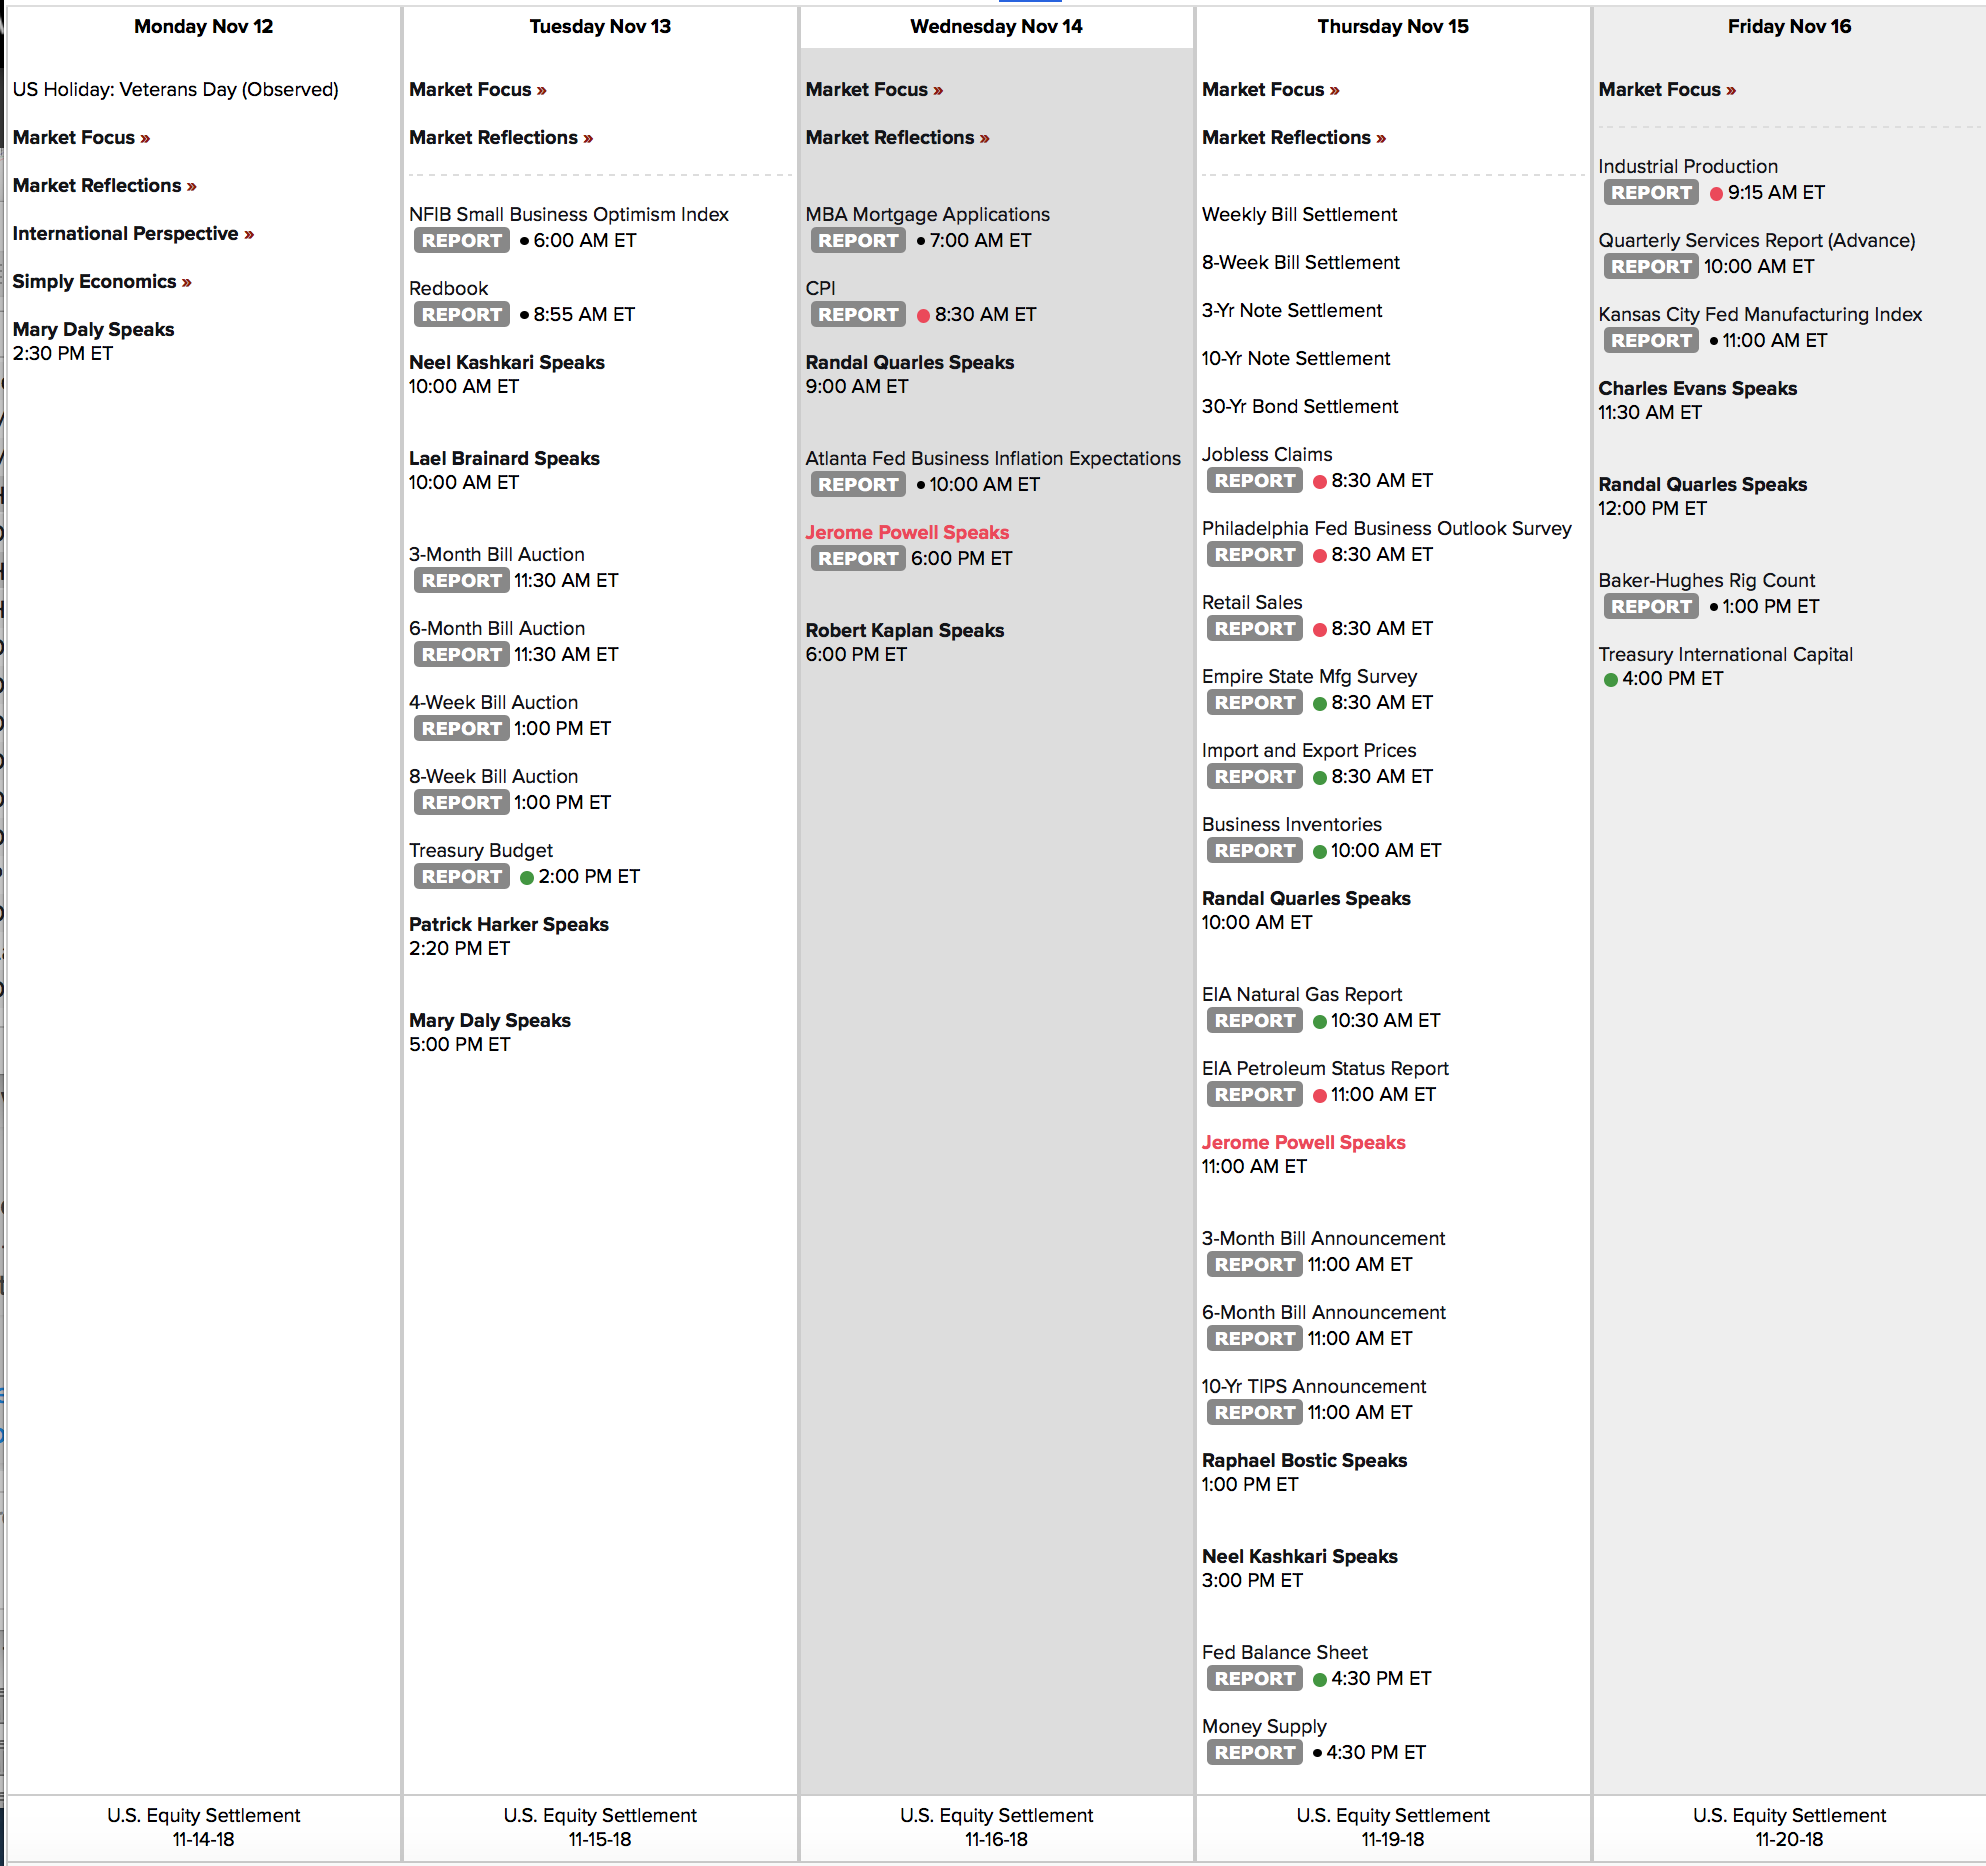
Link to calendar: https://us.econoday.com/byweek.asp?day=12&month=11&year=2018&cust=us&lid=0
Maybe not so long
#LongCallSpread Not a sunny day for bulls. Bought this yesterday but no going to watch it bleed away if this market is in a new downtrend.
Sold to close $AMZN Nov 23rd 1800/1810 long call spreads for 2.00. Bought yesterday for 2.70.
SPX rolled
#SPXcampaign Sold $SPX Nov 23rd 2630/2650/2850/2870 condors for 2.80, as a roll from 1-dte spread stopped earlier. I’ll stop this if premium on either side doubles to 5.60.
DIS closed
#Earnings Sold to close $DIS Nov 9th 116/118/119 #BrokenWingButterfly for 1.39. Bought yesterday for .70. Hovering around my center strike, so closing before it drifts too far away.
BOIL stopped
#ContangoETFs I got a handful of $BOIL Jan 45 calls, so I need to start rolling out.
BTC 2 of them at 7.00 and 7.10. Sold for 2.40, avg price .
Will consider rolls next week. Need to see if this is going to keep pushing higher.
SPX 1-dte stopped
#SPXcampaign BTC $SPX Nov 9th 2765/2745 put spreads for 2.80. Condor sold at the close yesterday for 1.10. Leaving the calls to expire.
Once we breached 2775 I started riding my exit order. Unfortunately yesterday ended the day with such low volatility that the condor was not very wide to get the 1.00 minimum premium.
I’m continuing to do this on-going. I’m 2 and 2 so far, and about breakeven on P/L since losses are about same size as wins on average. Considering a longer term trade to roll this one while the 1-dte trades continue.
Z covered calls sold
#Earnings #Assignment #CoveredCalls Sold to open $Z Nov 30th 30 covered calls for 1.55.
I’ll be assigned the stock via 34 puts this weekend. This sale will put my cost basis at 31.00, so if called away it will be a 1.00 loss on the trade, which is okay, but hopefully I can get one more call sale in to profit.
Adding to TGT
#PreEarnings Added batch 2 out of possible 3. Looks like we may be done going down for the day. If I’m wrong, I’ll add batch 3 for less.
Bought $TGT Nov 23rd 89 calls for 1.75.
BOILing higher
#ContangoETFs New highs today. For those of you without the history, scroll through the daily chart back a few years. You’ll see it can have some strong pushes up, but it always comes back down. Since winter hasn’t started, we could see this uptrend continue for weeks. If you’re forced to roll, you can decide whether to stop out today, and wait to sell replacement calls days or weeks later. Be very careful selling puts. It can work great as we fly higher, but don’t sit in short puts waiting for the last few pennies. Take profits, because when this thing turns around, it’ll drop fast.
Just note, the effective price when this thing started in 2011 is 4,000. It WILL come down eventually.
UVXY added
#VXXGame Sold $UVXY June 100 calls for 6.90
TTD closed
#Earnings BTC $TTD Nov 9th 100 puts for .20. The 100/90 put spreads sold yesterday for 1.75.
SPX 1-dte
#SPXcampaign Almost forgot about this so order placed after the bell. Volatility has dropped quite a lot since Tuesday; this condor in only 75 wide, whereas Tue/Wed 1-dte was 160 wide!
Sold $SPX Nov 9th 2745/2765/2840/2860 condors for 1.10. Expires tomorrow.
TTD earnings
#Earnings Sold to Open $TTD Nov 9th 100/90 put spreads for 1.75. Had this order in and it filled right before the bell. Stock just dropped after the bell, 100.50 the low (so far)!
I was trying for $YELP long straddle but didn’t want to pay over 6.20, so no fill. Now I can see it dropped 12.00 so it would have been a nice winner. Dick for a tick!
Fed
In its first meeting since October's market turmoil and this week's midterm elections, the Federal Reserve voted to maintain the current level of its benchmark interest rate.https://t.co/wz6jxRZHaM
— CNBC (@CNBC) November 8, 2018
YELP earnings analysis
#Earnings $YELP reports tonight. Below are details on earnings 1-day moves over the last 12 quarters.
Aug. 8, 2018 AC 26.65%
May 10, 2018 AC -7.81%
Feb. 7, 2018 AC -14.04%
Nov. 1, 2017 AC -0.10%
Aug. 3, 2017 AC 27.66% Biggest UP
May 9, 2017 AC -18.35% Biggest DOWN
Feb. 9, 2017 AC -13.64%
Nov. 2, 2016 BO 9.94%
Aug. 9, 2016 AC 12.83%
May 5, 2016 AC 23.71%
Feb. 8, 2016 AC -2.30%
Oct. 28, 2015 AC 3.98%
Avg + or – 13.42%
Bias 4.04%, a slight positive bias on earnings.
With stock at 44.00 the data suggests these ranges.
Based on current IV (expected move per TOS): 38.07 to 49.93
Based on AVERAGE move over last 12 quarters: 38.44 to 50.36
Based on MAXIMUM move over last 12 Q’s (27.7%): 32.12 to 56.68
I have more than once bought straddles and profited from this. More than a double on August’s earnings. Even if it opens flat you can get out with a small loss or breakeven. However, I’m seeing today’s straddle is going for about 6.00, which is over a dollar more than I paid in August. I’ll be considering it at day’s end.
Open for requests on other symbols.
TTD earnings analysis
#Earnings This is a fairly new issue (oldest earnings date is Nov 2016). It has had huge moves up but minimal moves down. I’m looking at selling the 100 puts, since that’s farther down than its biggest drop. Unless somebody warns me off it!
$TTD reports tonight. Below are details on earnings 1-day moves over the last 8 quarters (its entire history).
Aug. 9, 2018 AC 37.13%
May 10, 2018 AC 43.39% Biggest UP
Feb. 22, 2018 AC 23.84%
Nov. 9, 2017 AC -13.96% Biggest Down
Aug. 10, 2017 AC 8.76%
May 11, 2017 AC 30.10%
Feb. 16, 2017 AC -2.84%
Nov. 10, 2016 AC 8.62%
Avg + or – 21.08%
Bias 16.88%, huge positive bias on earnings.
With stock at 127.80 the data suggests these ranges.
Based on current IV (expected move per TOS): 105.08 to 150.52
Based on AVERAGE move over last 12 quarters: 100.86 to 154.74
Based on MAXIMUM move over last 12 Q’s (43.4%): 72.35 to 183.25
Open for requests on other symbols.
DIS earnings trade
#Earnings Not a big mover… I’m slightly bullish looking at the chart so doing a low risk #BrokenWingButterfly.
Bought to open $DIS Nov 9th 116/118/119 call butterfly for .70. No upside risk. Breakeven around 116.80. Max profit around 70%.
DIS earnings analysis
#Earnings $DIS reports tonight. Below are details on earnings 1-day moves over the last 12 quarters.
Aug. 7, 2018 AC -2.21%
May 8, 2018 AC -1.78%
Feb. 6, 2018 AC -1.32%
Nov. 9, 2017 AC 2.04%
Aug. 8, 2017 AC -3.87%
May 9, 2017 AC -2.15%
Feb. 7, 2017 AC 0.00%
Nov. 10, 2016 AC 2.86% Biggest UP
Aug. 9, 2016 AC 1.23%
May 10, 2016 AC -4.04% Biggest DOWN
Feb. 9, 2016 AC -3.75%
Nov. 5, 2015 AC 2.36%
Avg + or – 2.30%
Bias -0.89%, slight negative bias on earnings.
With stock at 116.5 the data suggests these ranges.
Based on current IV (expected move per TOS): 113.02 to 119.98
Based on AVERAGE move over last 12 quarters: 113.82 to 119.18
Based on MAXIMUM move over last 12 Q’s (4.0%): 111.79 to 119.83
Open for requests on other symbols.
ATVI earnings analysis
#Earnings $ATVI reports tonight. Below are details on earnings 1-day moves over the last 12 quarters.
Aug. 2, 2018 AC -3.69%
May 3, 2018 AC 4.51%
Feb. 8, 2018 AC 1.90%
Nov. 2, 2017 AC -3.43%
Aug. 3, 2017 AC -3.06%
May 4, 2017 AC 1.37%
Feb. 9, 2017 AC 18.87% Biggest UP
Nov. 3, 2016 AC -3.85%
Aug. 4, 2016 AC -0.66%
May 5, 2016 AC 8.47%
Feb. 11, 2016 AC -7.86% Biggest DOWN
Nov. 3, 2015 AC 3.26%
Avg + or – 5.08%
Bias 1.32%, positive bias on earnings.
With stock at 63.00 the data suggests these ranges.
Based on current IV (expected move per TOS): 58.59 to 67.41
Based on AVERAGE move over last 12 quarters: 59.80 to 66.20
Based on MAXIMUM move over last 12 Q’s (18.9%): 51.11 to 74.89
NOTE: The 18.9% up move is an outlier. It’s the biggest move going all the way back to 2002. So if you remove the outlier, the MAX is 8.5%, which would indicate a range of 57.66 to 68.34.
Open for requests on other symbols.
PVTL calls closed
#CoveredCalls BTC $PVTL Nov 16th 21 covered calls for .05. Sold for .70 .
Assigned at 22.5, cost basis now down to 19.80.
TGT pre-earnings
#PreEarnings Bought to Open $TGT Nov 23rd 89 calls for 1.62.
Got then from Mama’s chart… .40 delta, (close to) 14 days out from Nov 20th earnings date. 1st batch of up to three. Initial target: 2.70. Thanks @kathycon!
AMZN call spread
#LongCallSpread Bought to Open $AMZN Nov 23rd 1800/1810 call spreads for 2.69. Purely speculative, and aggressive with the short time period.
Z assigned
#Earnings #Assignment Assigned at 34.00 on only one of my 13 puts on $Z. Cost basis 32.55. The rest will be assigned tonight unless I get an exit today. No big worry with a low stock price.
SQ trade
#Earnings Since we have two days for this to drift around, I’m shooting for the center, hoping that any gap will be closed by Friday.
Sold to open $SQ Nov 9th 77.5/82.5/87.5 #IronButterfly for 4.00. Max risk 1.00.
SPX call spread
#SPXcampaign Sold to Open $SPX Nov 30th 2875/2900 call spreads for 4.25. This offsets the 2700/2675 put spread sold on Monday.
SPX 1-dte stopped
#SPXcampaign BTC $SPX Nov 7th 2810 calls for 1.70.
Taking a small loss on the 1-day condor, sold yesterday for 1.30. My rule is to stop or roll if we get within 10-points of the short strike. I’m not going to roll because loss is small.
I’ll do this again tomorrow for Friday’s expiration.
TQQQ covered calls
#LongLEAPs #SyntheticCoveredCalls
Sold to Open $TQQQ Nov 16th 59 calls for 1.25.
TWLO closed for now
#Earnings This doesn’t appear that it will stop. Of course, once one decides that, that’s where it will stop.
But I’m looking for this to go higher. I looked at the lifetime chart, and every gap up is NOT filled… stock continues higher and never revisits the opening low on post-earnings day. This, however, is a gigantic move. I’m going to look to sell some OTM puts, and then wait for higher prices to try to sell calls or strangles.
BTC $TWLO Nov 9th 85 calls for 10.55. Strangles sold yesterday for 1.96.
TWLO & Z… in the vice
#Earnings… Should have closed both of these right at the open. Getting killed on both ends.
Short the $Z 34/47 strangles
Short the $TWLO 60/85 strangles
$Z will be manageable at such a low stock price. $TWLO is unpredictable because it could run for a very long time without stopping. Watching for now. Will roll as necessary.
PYPL calls sold
#SyntheticCoveredCalls Sold to Open $PYPL Nov 16th 88 calls for 1.15.
TSLA closed
#ShortStrangles #EarningsTradeRepair
BTC $TSLA Nov 9th 320/365 strangles for 1.50. Sold last Friday for 6.37.
Almost got my money back from the August madness. Will sell another on Friday.
WYNN earnings analysis
#Earnings $WYNN reports tonight. Below are details on earnings 1-day moves over the last 12 quarters.
Aug. 1, 2018 AC -6.53%
April 24, 2018 AC -3.74%
Jan. 22, 2018 BO 8.67%
Oct. 26, 2017 AC -1.50%
July 25, 2017 AC -5.02%
April 25, 2017 AC 5.89%
Jan. 26, 2017 AC 7.93%
Nov. 2, 2016 AC -9.31% Biggest DOWN
July 28, 2016 AC -6.41%
May 5, 2016 AC 1.77%
Feb. 11, 2016 AC 15.83% Biggest UP
Oct. 15, 2015 AC -1.16%
Avg (+ or -) 6.15%
Bias 0.54%, small positive bias on earnings.
With stock at 112.00 the data suggests these ranges.
Based on current IV (expected move per TOS): 103.05 to 120.95
Based on AVERAGE move over last 12 quarters: 105.12 to 118.88
Based on MAXIMUM move over last 12 Q’s (15.8%): 94.27 to 129.73
Open for requests on other symbols.
SQ earnings analysis
#Earnings $SQ reports tonight. Below are details on earnings 1-day moves over the last 11 quarters (its entire history).
Aug. 1, 2018 AC 8.65%
May 2, 2018 AC 1.13%
Feb. 27, 2018 AC 0.30%
Nov. 8, 2017 AC 3.40%
Aug. 2, 2017 AC -4.68%
May 3, 2017 AC 8.86%
Feb. 22, 2017 AC 14.02% Biggest UP
Nov. 1, 2016 AC 6.41%
Aug. 3, 2016 AC 8.42%
May 5, 2016 AC -21.68% Biggest DOWN
March 9, 2016 AC -6.06%
Avg + or – 7.60%
Bias 1.71%, positive bias on earnings.
With stock at 79.00 the data suggests these ranges.
Based on current IV (expected move per TOS): 71.15 to 86.85
Based on AVERAGE move over last 12 quarters: 73.00 to 85.00
Based on MAXIMUM move over last 12 Q’s (21.7%): 61.87 to 96.13
Open for requests on other symbols.
SPX 1-dte
#SPXcampaign Sold to Open $SPX Nov 7th 2630/2650/2810/2830 condors for 1.30. Expires tomorrow.
Excellent premium available at a .05-.06 delta on the short strikes. Won’t be this easy after volatility drops.
Adding to TQQQ
#LongLEAPs Bought $TQQQ Jan 2020 66.67 calls for 8.15. Adding to my position. Avg cost (not including #SyntheticCoveredCalls) now 10.12. Hard to believe I paid 17.60 for the first one.
Also, BTC $TQQQ Nov 9th 56 calls for .35. Sold for 1.30 last Wednesday.
Now that I have a full position the call selling will continue to bring down cost basis. I won’t necessarily be holding this very long… I may close it if we reach new highs at the end of this year. I’m not so optimistic about the bull market lasting through 2019.
TWLO earnings trade
#Earnings Sold to Open $TWLO Nov 9th 60/85 strangles for 1.96. I am -16.7% and +18.1% OTM.

