CAT earnings analysis

#Earnings $CAT reports Monday morning. Below are details on earnings FIVE-day moves over the last 12 quarters.

***NOTE: These are 5-day moves, since options traded for earnings will expire next Friday.

Tue 10/23/2018 BO -10.61% Biggest DOWN
Mon 07/30/2018 BO -2.82%
Tue 04/24/2018 BO -6.02%
Thu 01/25/2018 BO -3.42%
Tue 10/24/2017 BO +4.66%
Tue 07/25/2017 BO +5.47%
Tue 04/25/2017 BO +5.62%
Thu 01/26/2017 BO -1.38%
Tue 10/25/2016 BO -2.45%
Tue 07/26/2016 BO +5.17%
Fri 04/22/2016 BO -1.28%
Thu 01/28/2016 BO +7.51% Biggest UP

Avg (+ or -) 4.70%
Bias 0.04%, no directional bias on earnings.

With stock at 135.75 the data suggests these ranges:
Based on current IV (expected move into Friday per TOS): 127.97 to 143.53
Based on AVERAGE move over last 12 quarters: 129.37 to 142.13
Based on MAXIMUM move over last 12 Q’s (10.6%): 121.35 to 150.15

Open for requests on other symbols.

SQ rip

#LongLEAPs #SyntheticCoveredCalls

I played this one badly this week. I had rolled last week to ITM Feb 1st 67 calls. I had the chance Tuesday to close for a profit with the pull back all the way down below 68. But I foolishly went by sentiment rather than reality: I thought weakness would continue through the week. That’s what I “thought”. In reality, it was simply a must-exit opportunity. Sold the calls for 5.75… could have exited for less than 3.00.

Now, they’re going for 10.50 as SQ resumes its strong rally.

Lesson learned. When ITM on calls, take any opportunity to exit. Don’t wait for a .30 exit.

Double Calendars closing

#Earnings #DoubleCalendar
Sold to Close $ETFC Jan25/Feb01 50 dbl cal for .50. Bought for .52 yesterday, so bitty loss.
Will include other closures in comments.

SPX 1-dte, sold more

#SPX1dte Sold to close another third of $SPX Jan 25th 2765/2695 long call spreads for 2.25. Now profitable in all accounts. Waiting to watch action to sell last batch.

Comments not showing?

#Welcome I usually have all comments show up automatically under Bistro posts. But occasionally they’ll stop showing and it will display “Show Comments”, and I’ll need to click that to reveal comments.

This means you need to remove website data. On a Mac with Safari:

–> navigate to Safari > Preferences >Privacy> Manage Website Data. Search for WordPress.com and then Remove. Next, search for OptionsBistro.com and Remove again.

You then may need to re-log-in to WordPress, but this should fix the issue.

Not sure how to do this on a PC, but basically you are removing cookies and website data for WordPress and OptionsBistro.

SPX long 1-dte, partially closed

#SPX1dte Filled on an order I put in for overnight swings.

Sold partial position, $SPX Jan 25th 2675/2695 call spreads for 1.60. Condors bought for .70 last night.

That covers cost of trade on some accounts (where I closed half) and most of the cost on other accounts (where I closed a third). Will look for a higher move to close the remainder.

SPX 1-dte — BUYING

#SPX1dte First time I’m altering this… SPX IV on tomorrow’s expiration is only 13% (in December, 1-day IV was between 21-33 all month). Historical Vol is running much higher than Implied Vol (daily chart), meaning options are underpriced. Daily ATR(14) is at 44.37, which is far above the 2018 average, even including Febd thru April.

On most days, my strikes will NOT be breached. But intraday swings will produce profitable exit opportunities. And on the days the strikes WILL be breached, profit can be 10x-20x, allowing me plenty of days that can result in losses. Also let’s me sleep easier knowing my losses are capped at the purchase price.

So, I’m developing a system to determine which conditions are best for switching from selling to buying. I believe the volatility levels described above are a sweet spot.

Bought to open $SPX Jan 25th 2570/2590-2675/2695 iron condors for .70.

Exit plan is to sell half (or a third) at first opportunity of swing, then hold the remainder for follow through.

and another

#Earnings #DoubleCalendar $CL average move 2.43%

Bought $CL Jan25/Feb01 62 double calendars for .36 (remarkable fill for such wide bid/ask spread)

Double Calendars

#Earnings #DoubleCalendar

Bought $INTC Jan25/Feb01 50 double calendars for .54
Bought $ETFC Jan25/Feb01 50 double calendars for .52

WDC earnings analysis

#Earnings $WDC reports tonight. Below are details on earnings one-day moves over the last 12 quarters.

Oct. 25, 2018 AC -18.18% Biggest DOWN
July 26, 2018 AC -7.73%
April 26, 2018 AC -7.99%
Jan. 25, 2018 AC +1.82%
Oct. 26, 2017 AC -2.53%
July 27, 2017 AC -7.54%
April 27, 2017 AC +3.92%
Jan. 25, 2017 AC -1.93%
Oct. 26, 2016 AC +5.41% Biggest UP
July 28, 2016 AC -11.52%
April 28, 2016 AC -11.28%
Jan. 28, 2016 AC +5.01%

Avg (+ or -) 7.07%
Bias -4.38%, significant negative bias on earnings.

With stock at 40.00 the data suggests these ranges:
Based on current IV (expected move into Friday per TOS): 36.81 to 43.19
Based on AVERAGE move over last 12 quarters: 37.17 to 42.83
Based on MAXIMUM move over last 12 Q’s (18.2%): 32.73 to 47.27

Open for requests on other symbols.

ISRG earnings analysis

#Earnings $ISRG reports tonight. Below are details on earnings one-day moves over the last 12 quarters.

Oct. 18, 2018 AC -3.45%
July 19, 2018 AC -0.86%
April 17, 2018 AC +8.17% Biggest UP
Jan. 25, 2018 AC -2.12%
Oct. 19, 2017 AC +3.39%
July 20, 2017 AC -4.55%
April 18, 2017 AC +6.36%
Jan. 24, 2017 AC +5.09%
Oct. 18, 2016 AC -5.56% Biggest DOWN
July 19, 2016 AC +4.63%
April 19, 2016 AC +3.34%
Jan. 21, 2016 AC +1.89%

Avg (+ or -) 4.12%
Bias 1.36%, slight positive bias on earnings.

With stock at 530.00 the data suggests these ranges:
Based on current IV (expected move into Friday per TOS): 506.06 to 553.94
Based on AVERAGE move over last 12 quarters: 508.18 to 551.82
Based on MAXIMUM move over last 12 Q’s (8.2%): 486.70 to 573.30

Open for requests on other symbols.

LRCX earnings analysis

#Earnings $LRCX reports tonight. Below are details on earnings one-day moves over the last 12 quarters.

Oct. 16, 2018 AC +1.31%
July 26, 2018 AC +7.19% Biggest UP
April 17, 2018 AC -4.03%
Jan. 24, 2018 AC -4.99% Biggest DOWN
Oct. 17, 2017 AC +3.05%
July 26, 2017 AC -2.12%
April 18, 2017 AC +6.85%
Jan. 25, 2017 AC -2.21%
Oct. 19, 2016 AC -2.78%
July 27, 2016 AC +1.21%
April 20, 2016 AC -2.23%
Jan. 27, 2016 AC +2.88%

Avg (+ or -) 3.40%
Bias 0.34%, slight positive bias on earnings.

With stock at 138.00 the data suggests these ranges:
Based on current IV (expected move into Friday per TOS): 130.44 to 145.56
Based on AVERAGE move over last 12 quarters: 133.30 to 142.70
Based on MAXIMUM move over last 12 Q’s (7.2%): 128.08 to 147.92

Open for requests on other symbols.

XLNX earnings analysis

#Earnings $XLNX reports tonight. Below are details on earnings one-day moves over the last 12 quarters.

Oct. 24, 2018 AC +15.00% Biggest UP
July 25, 2018 AC +9.59%
April 25, 2018 AC +1.69%
Jan. 24, 2018 AC -5.08%
Oct. 25, 2017 AC -0.12%
July 26, 2017 AC -2.26%
April 26, 2017 AC +7.35%
Jan. 25, 2017 AC -3.67%
Oct. 19, 2016 AC +0.96%
July 27, 2016 AC +2.50%
April 27, 2016 AC -8.70% Biggest DOWN
Jan. 20, 2016 AC +8.58%

Avg (+ or -) 5.46%
Bias 2.15%, positive bias on earnings.

With stock at 88.50 the data suggests these ranges:
Based on current IV (expected move into Friday per TOS): 82.47 to 94.53
Based on AVERAGE move over last 12 quarters: 83.67 to 93.33
Based on MAXIMUM move over last 12 Q’s (15.0%): 75.23 to 101.78

Open for requests on other symbols.

SPX 1-dte

#SPX1dte Upside stop level was hit early, but now pulling back sharply.
Closed the short puts for .05. Looking to close short calls for best price I can get.

Trade sold yesterday for .95: $SPX Jan 23rd 2555/2575-2665/2685

FFIV earnings analysis

#Earnings $FFIV reports tonight. Below are details on earnings one-day moves over the last 12 quarters.

Oct. 24, 2018 AC +6.10%
July 25, 2018 AC +1.07%
April 25, 2018 AC +0.89%
Jan. 24, 2018 AC -5.05%
Oct. 25, 2017 AC +3.97%
July 26, 2017 AC -7.16%
April 26, 2017 AC -7.50%
Jan. 25, 2017 AC -8.25% Biggest DOWN
Oct. 26, 2016 AC +9.57% Biggest UP
July 20, 2016 AC +0.32%
April 20, 2016 AC +5.53%
Jan. 20, 2016 AC -0.56%

Avg (+ or -) 4.66%
Bias -0.09%, no significant positive or negative bias.

With stock at 159.00 the data suggests these ranges:
Based on current IV (expected move into Friday per TOS): 149.10 to 168.90
Based on AVERAGE move over last 12 quarters: 151.58 to 166.42
Based on MAXIMUM move over last 12 Q’s (9.6%): 143.78 to 174.22

Open for requests on other symbols.

SPX 1-dte

#SPX1dte Sold to Open $SPX Jan 23rd 2575/2555 put spreads for .55. Looking to add the call spread on any bounce; hopefully before 3pm ET.

WYNN earnings analysis

#Earnings Who knows when $WYNN will report? Estimates range from tonight until the 28th. IV on TOS shows it could be this week or next. As you can see from the past dates, they tend to announce in different weeks every quarter.

Below are details on earnings one-day moves over the last 12 quarters.

Nov. 7, 2018 AC -13.13% Biggest DOWN
Aug. 1, 2018 AC -6.53%
April 24, 2018 AC -3.74%
Jan. 22, 2018 BO +8.67%
Oct. 26, 2017 AC -1.50%
July 25, 2017 AC -5.02%
April 25, 2017 AC +5.89%
Jan. 26, 2017 AC +7.93%
Nov. 2, 2016 AC -9.31%
July 28, 2016 AC -6.41%
May 5, 2016 AC +1.77%
Feb. 11, 2016 AC +15.83% Biggest UP

Avg (+ or -) 7.14%
Bias -0.46%, no significant positive or negative bias, just tends to move.

With stock at 111.00 the data suggests these ranges:
Based on current IV (expected move into Friday per TOS): 105.24 to 116.76
Based on AVERAGE move over last 12 quarters: 103.07 to 118.93
Based on MAXIMUM move over last 12 Q’s (15.8%): 93.43 to 128.57
Open for requests on other symbols.

T time

#PieTrades #ShortPuts Sold to Open $T April 31 puts for 1.60.
Replicating my Oct 24th-Jan 18th successful trade. This time it is Jan 22nd to April 18th.
Assignment would be fine on a high-div tock, becomes a PieTrade with covered calls.

SPX 1-dte stopped

#SPX1dte Bought to close $SPX Jan 22nd 2630/2610 put spreads for 1.20. Condor sold for .95 on Friday. Suffered from poor entry in the last hour on Friday, so my put spread was simply too high to survive this minor (so far) pullback. I’ll be looking to enter these earlier in the day.

Hello VXXB

#VXXGame #LongLEAPs
Bought to open $VXXB Jan 2020 20 puts for 1.75.
A starter position for a 12-month trade. My bigger target will be the 2021 LEAPs, which are still pretty expensive, but should lower in value by late summer, provided we don’t enter a bear market. I may also look at ATM puts and sell puts against them, but this OTM position is meant to be a cheaper play that stands alone without cost reduction.

IBM earnings analysis

#Earnings $IBM reports tonight. Below are details on earnings THREE-DAY moves over the last 12 quarters.

(I used 3-day moves since Friday is 4 days away, and the 3-day range is higher than the 1-day).

Tue 10/16/2018 AC -11.04%
Wed 07/18/2018 AC +1.27%
Tue 04/17/2018 AC -9.95%
Thu 01/18/2018 AC -3.99%
Tue 10/17/2017 AC +10.60%
Tue 07/18/2017 AC -4.49%
Tue 04/18/2017 AC -5.68%
Thu 01/19/2017 AC +2.24%
Mon 10/17/2016 AC -2.09%
Mon 07/18/2016 AC +0.36%
Mon 04/18/2016 AC -2.11%
Tue 01/19/2016 AC -4.37%

Avg (+ or -) 4.85%
Bias -2.44%, negative bias on earnings.

With stock at 123.50 the data suggests these ranges:
Based on current IV (expected move into Friday per TOS): 116.94 to 130.06
Based on AVERAGE move over last 12 quarters: 117.51 to 129.49
Based on MAXIMUM move over last 12 Q’s (11.0%): 109.87 to 137.13

Open for requests on other symbols.

SPX 1-dte, legging in

#SPX1dte Sold $SPX Jan 22nd 2715/2735 call spreads for .45. Legging in as I see us going lower into the close. Will sell puts soon.

#spx1-dte

UVXY hedge

#VXXGame Bought to Open $UVXY Feb 15th 100 calls for .36. I want to have room to sell premium if we get another market pull back. If we don’t, then small loss. (these reached a peak of 13.00 in late December)

MS calendar loses

#Earnings #Double Calendar Sold to close remaining parts of $MS Jan18/Jan25 45 double calendar for .131. Bought for .33 on Wednesday, plus paid .03 to close short calls yesterday.

So one small loss and a breakeven on this strategy so far. Oddly enough, the better play for neutral option strategies this week was NFLX. It’s upside world.

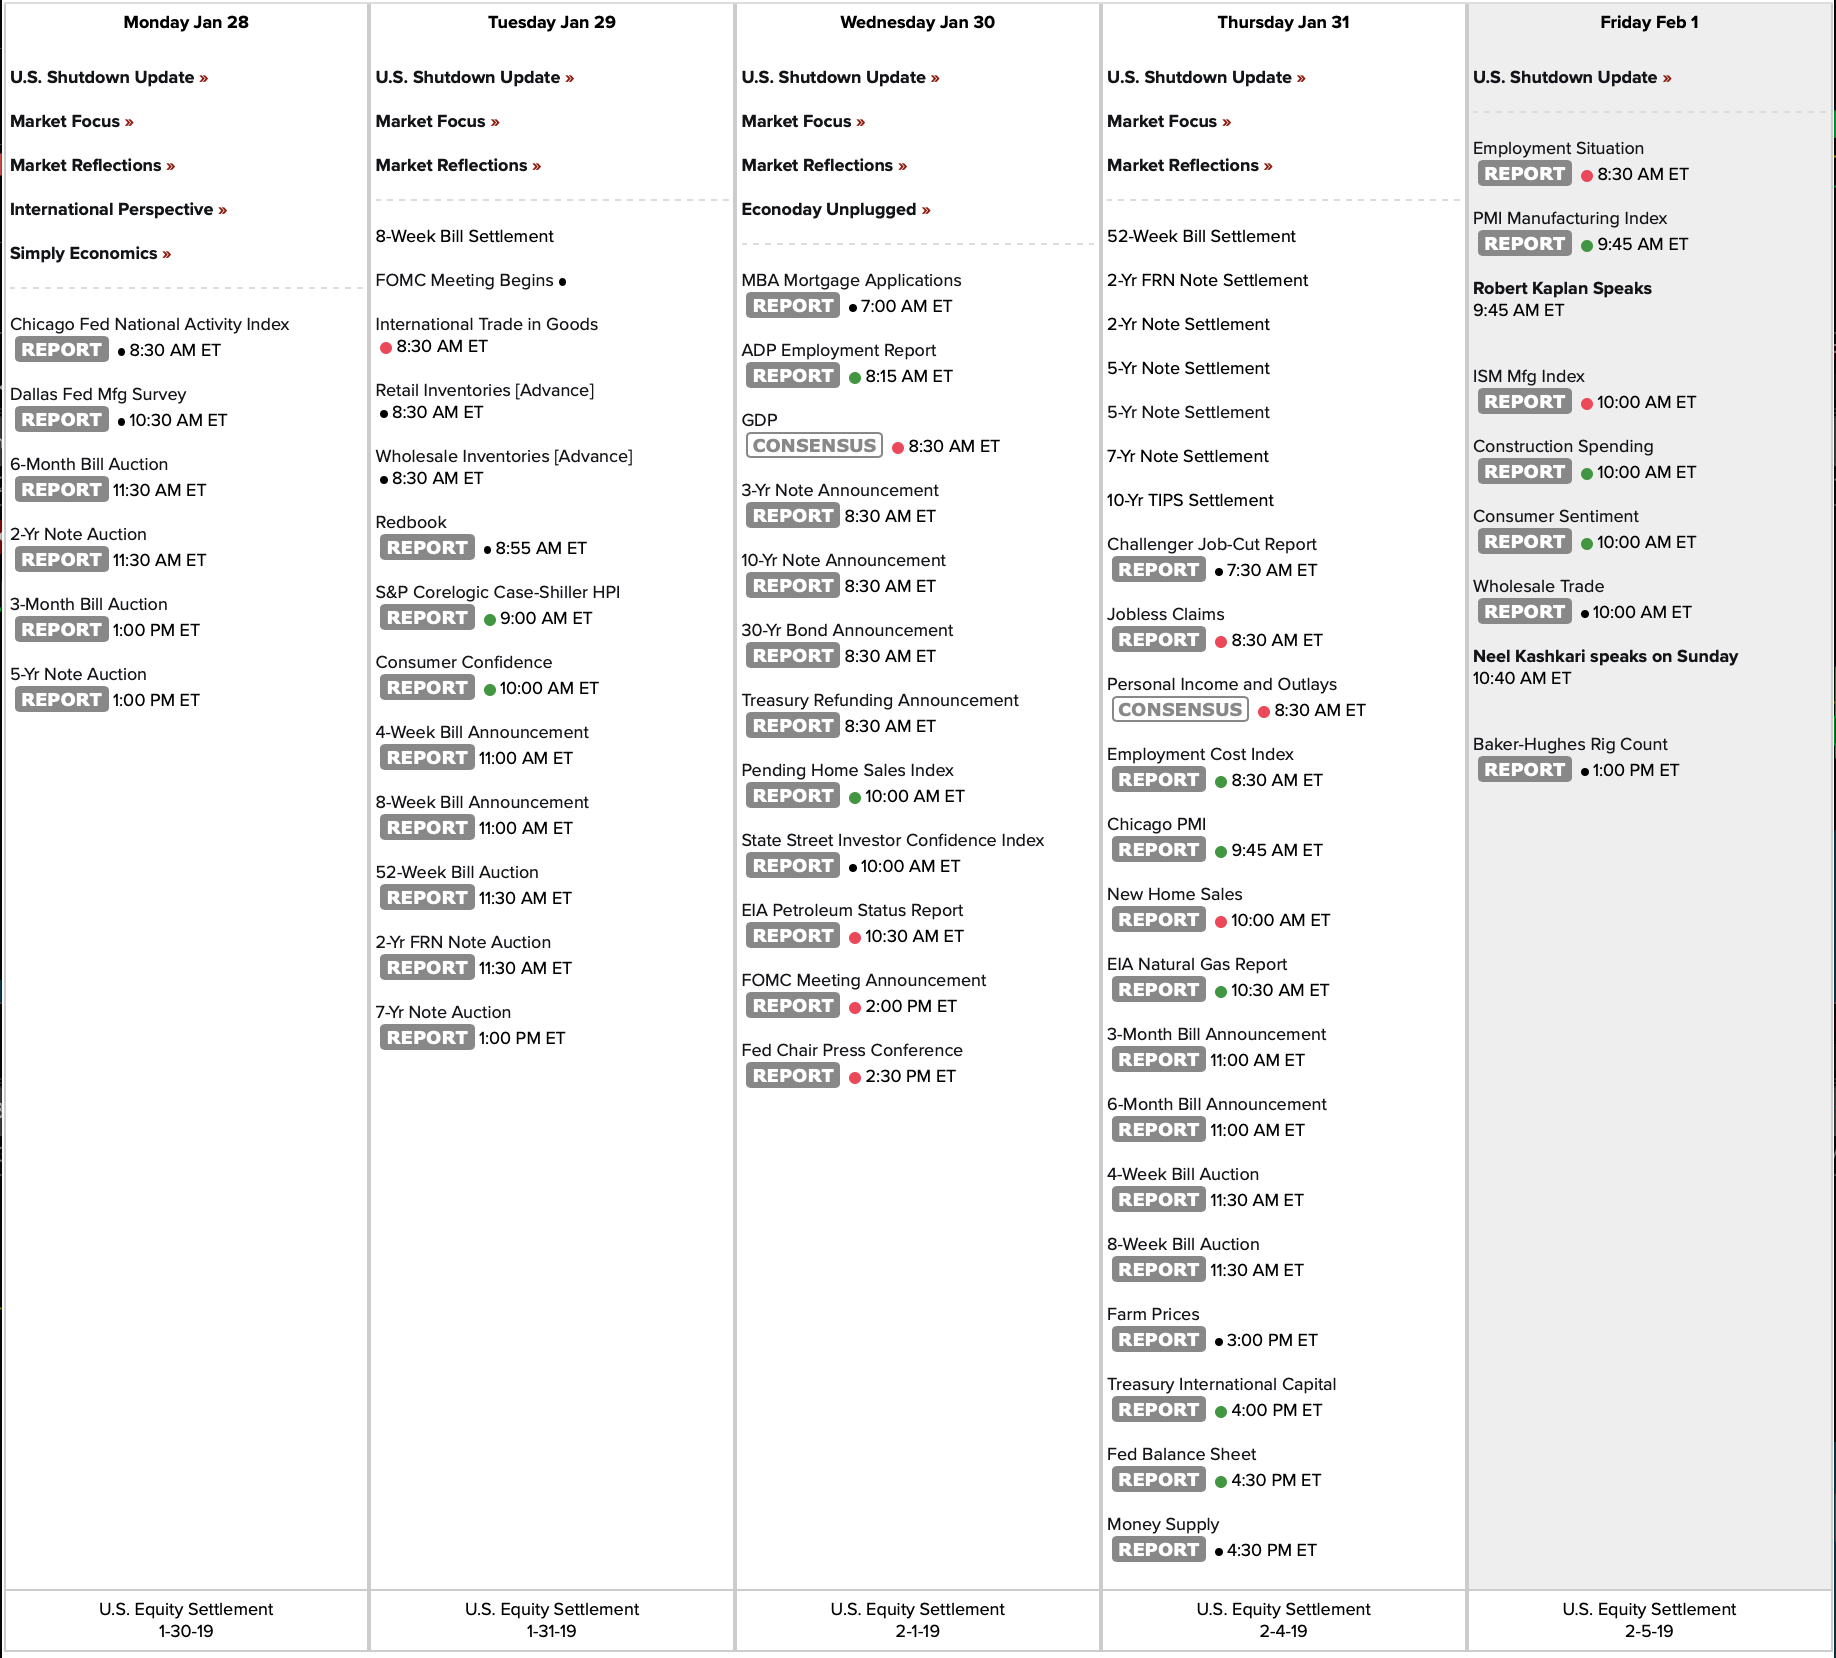
Econ Calendar for week of 1/21/19

Markets closed Monday for Martin Luther King holiday.

screen shot 2019-01-25 at 10.21.08 am

screen shot 2019-01-18 at 10.35.31 am

Link to calendar: https://us.econoday.com/byweek.asp?day=21&month=1&year=2019&cust=us&lid=0

TOS question

When I closed down the application, it says “saving configuration.” How do I save configuration without closing the application?

Call rolls

#LongLEAPs #SyntheticCoveredCalls
Rolled $SQ Jan 18th 66 calls to Feb 1st 67 calls for .25 credit.
Rolled $TQQQ Jan 18th 42.5 calls to Feb 1st 43.5 calls for .25 credit.

SPX 1-dte stopped

#SPX1dte Upside stop was hit, so…

Bought to close $SPX Jan 18th 2680/2700 call spreads for .85. Puts will expire. Iron condors sold yesterday for .80, so I lost .05 and commissions. Will sell another for Tuesday expiration.

Looks like I picked the wrong year to…

#VXXGame #LongLEAPs Over the years I put a lot of research into the idea of buying long $VXX LEAP puts, since the symbol is dragged toward zero over time. I built an extensive spreadsheet showing how this strategy would have worked with every VIX leap expiration since 2006 except Jan 2009, during the financial crisis. (VXX was created in 2009, but there are models available of how it would have performed going back to 2004).

Other than Jan 2009, the 18-month to 24-month decline in $VXX is usually 60-90%; even as much as 97% down over 24 months.

So when I started buying the Jan 2019 VXX 20 puts on September 5th, 2017, the odds looked pretty good for a decent profit. I started scaling in and ended up with a total of 32 puts over multiple accounts, average price 1.603. I also sold some 50/60 call spreads against it, lowering that cost basis down to about 1.20.

But, guess what? Picked the wrong year! This is the first LEAP expiration since 2009 where this strategy did not work. And now $VXX is going away at the end of this month, replaced by $VXXB, which doesn’t have much volume yet. However, they HAVE finally added LEAPs, so I’ll be looking to start buying.

Also, because of the product termination, I closed my final short shares in $VXX today for 37.25. I was assigned 100 shares short for 27.00, and had managed to scale out of 30 of them when we dipped below 27.00 in September. Then, October happened.

Sensitive

#Market is way too reactionary to anything “tariffs.”

https://platform.twitter.com/widgets.js

$T puts closed

#PieTrades #ShortPuts Well, was planning to let this expire or take assignment, but I forgot I had entered a GTC order weeks ago. So it just filled.

Bought to close $T Jan 18th 31 puts for .15. Sold for 1.37 on Oct 24th. Following @fuzzballl on this, but I’ll do the same thing again, sell ATM puts a couple months out, and if assigned take the stock (and dividend) and sell covered calls.

SPX 1-dte sold

#SPX1dte Sold $SPX Jan 18th 2570/2590-2680/2700 iron condors for .80.

SPX 1-dte closing

#SPX1dte Bought to close $SPX Jan 17th (monthly) 2670/2690 call spreads for .30. Order in to close put spreads for .05. Whole shebang sold yesterday for .85.

Selling a new one for tomorrow’s PM expiration

AA dbl cal closed

#Earnings #DoubleCalendar Was trying to get filled on the dip, when the dip exploded into a market rally.

Sold to close $AA Jan18/Jan25 29 double calendar for .51. Bought yesterday for .44. Meager.

Waiting for tomorrow on $MS

Tariffs shmariffs

screen shot 2019-01-17 at 11.53.28 am

KSU earnings analysis

#Earnings I’m looking at this for a double calendar. Decent IV crush with small historic moves. However, bid/ask pretty wide so it will depend on the mid-price I can get. I’ll see what I can do in the last hour of the day.

$KSU reports tomorrow morning. Below are details on earnings one-day moves over the last 12 quarters.

Oct. 19, 2018 BO +3.35%
July 20, 2018 BO +2.39%
April 20, 2018 BO +1.55%
Jan. 19, 2018 BO -1.34%
Oct. 20, 2017 BO +1.35%
July 21, 2017 BO +1.13%
April 21, 2017 BO -2.84% Biggest DOWN
Jan. 20, 2017 BO +4.03%
Oct. 18, 2016 BO -2.24%
July 19, 2016 BO +1.88%
April 19, 2016 BO +4.97% Biggest UP
Jan. 22, 2016 BO +4.44%

Avg (+ or -) 2.63%
Bias 1.56%, positive bias on earnings.

With stock at 103.50 the data suggests these ranges:
Based on current IV (expected move into Friday per TOS): 99.64 to 107.36
Based on AVERAGE move over last 12 quarters: 100.78 to 106.22
Based on MAXIMUM move over last 12 Q’s (5.0%): 98.36 to 108.64

Open for requests on other symbols.

SLB earnings analysis

#Earnings $SLB reports tomorrow morning. Below are details on earnings one-day moves over the last 12 quarters.

Oct. 19, 2018 BO +0.06%
July 20, 2018 BO -1.24%
April 20, 2018 BO -1.49%
Jan. 19, 2018 BO +0.06%
Oct. 20, 2017 BO -2.09%
July 21, 2017 BO -0.73%
April 21, 2017 BO -2.18%
Jan. 20, 2017 BO -0.81%
Oct. 20, 2016 AC -3.03% Biggest DOWN
July 21, 2016 AC +1.98%
April 21, 2016 AC -0.42%
Jan. 21, 2016 AC +6.10% Biggest UP

Avg (+ or -) 1.68%
Bias -0.32%, negative bias on earnings.

With stock at 41.00 the data suggests these ranges:
Based on current IV (expected move into Friday per TOS): 39.55 to 42.45
Based on AVERAGE move over last 12 quarters: 40.31 to 41.69
Based on MAXIMUM move over last 12 Q’s (6.1%): 38.50 to 43.50

Open for requests on other symbols.

Calendars

#Earnings #Double Calendars

$AA gapped down then shot up through my strike. Didn’t get filled on my close order as it went past, now it’s getting too high. Will wait for a drift back down.

$MS gapped down and has stayed down. I bought to close Jan 18th short 29 call for .03, removing upside risk for a possible bounce into tomorrow.

AXP earnings analysis

#Earnings $AXP reports tonight. Below are details on earnings one-day moves over the last 12 quarters.

Oct. 18, 2018 AC +3.78%
July 18, 2018 AC -2.72%
April 18, 2018 AC +7.58%
Jan. 18, 2018 AC -1.83%
Oct. 18, 2017 AC -0.19%
July 19, 2017 AC -0.67%
April 19, 2017 AC +5.91%
Jan. 19, 2017 AC -0.63%
Oct. 19, 2016 AC +9.02% Biggest UP
July 20, 2016 AC -1.62%
April 20, 2016 AC +0.90%
Jan. 21, 2016 AC -12.10% Biggest DOWN

Avg (+ or -) 3.91%
Bias 0.62%, positive bias on earnings.

With stock at 99.50 the data suggests these ranges:
Based on current IV (expected move into Friday per TOS): 95.21 to 103.79
Based on AVERAGE move over last 12 quarters: 95.51 to 103.29
Based on MAXIMUM move over last 12 Q’s (12.1%): 87.37 to 111.43

Open for requests on other symbols.
NFLX earnings analysis

#Earnings $NFLX reports tonight. Below are details on earnings one-day moves over the last 12 quarters.

Oct. 16, 2018 AC +5.28%
July 16, 2018 AC -5.24%
April 16, 2018 AC +9.18%
Jan. 22, 2018 AC +9.97%
Oct. 16, 2017 AC -1.57%
July 17, 2017 AC +13.54%
April 17, 2017 AC -2.64%
Jan. 18, 2017 AC +3.86%
Oct. 17, 2016 AC +19.02% Biggest UP
July 18, 2016 AC -13.12% Biggest DOWN
April 18, 2016 AC -12.97%
Jan. 19, 2016 AC -0.13%

Avg (+ or -) 8.04%
Bias 2.10%, positive bias on earnings.

With stock at 350.00 the data suggests these ranges:
Based on current IV (expected move into Friday per TOS): 321.39 to 378.61
Based on AVERAGE move over last 12 quarters: 321.85 to 378.15
Based on MAXIMUM move over last 12 Q’s (19.0%): 283.43 to 416.57

Open for requests on other symbols.

MS and AA earnings calendars

#DoubleCalendar #Earnings Forgot about these earlier… just threw them on now.
Bought to Open $MS 18Jan/25Jan 45 double calendar for .334.
Bought to Open $AA 18Jan/25Jan 29 double calendar for .44

SPX 1-dte sold

#SPX1dte Sold to Open $SPX Jan 17th (monthlys) 2545/2565-2670/2690 iron condors for .85. These stop trading at tomorrow’s close but settle on Friday morning, so I will close during market hours tomorrow.

Expiring today: Jan 16th 2535/2555-2650/2670 condors, sold yesterday for .95.

AA earnings analysis

#Earnings $AA reports tonight. Below are details on earnings one-day moves over the last 12 quarters.

Oct. 17, 2018 AC +5.85%
July 18, 2018 AC -13.34% Biggest DOWN
April 18, 2018 AC +1.39%
Jan. 17, 2018 AC -7.00%
Nov. 17, 2017 AC -2.74%
Oct. 18, 2017 AC -2.53%
July 19, 2017 AC +0.60%
April 24, 2017 AC +9.54% Biggest UP
Jan. 24, 2017 AC -2.58%
Oct. 10, 2016 AC -11.42%
July 11, 2016 AC +5.42%
April 11, 2016 AC -2.66%

Avg (+ or -) 5.42%
Bias -1.62%, negative bias on earnings.

With stock at 28.20 the data suggests these ranges:
Based on current IV (expected move into Friday per TOS): 26.23 to 30.17
Based on AVERAGE move over last 12 quarters: 26.67 to 29.73
Based on MAXIMUM move over last 12 Q’s (13.3%): 24.44 to 31.96

Open for requests on other symbols.

Market Tide

#Tide I now have the Market Tide indicators on all my charts. Looks pretty solid. Also noticed that SPY 1-hour chart just printed a purple arrow, signaling a possible top for at least a few days.

SPX 1-dte sold

#SPX1dte Sold to Open $SPX Jan 16th 2535/2555-2650/2670 iron condors for .95. Legged in, put spread first for .55 after the Brexit dip, then call spread on the bounce for .40

UAL earnings analysis

#Earnings $UAL reports tonight. Below are details on earnings one-day moves over the last 12 quarters.

Oct. 16, 2018 AC +5.95%
July 17, 2018 AC +8.78% Biggest UP
April 17, 2018 AC +4.81%
Jan. 23, 2018 AC -11.44%
Oct. 18, 2017 AC -12.07% Biggest DOWN
July 18, 2017 AC -5.90%
April 17, 2017 AC -4.26%
Jan. 17, 2017 AC +0.35%
Oct. 17, 2016 BO -0.31%
July 19, 2016 BO +0.29%
April 20, 2016 BO +0.94%
Jan. 21, 2016 BO +0.46%

Avg (+ or -) 4.63%
Bias -1.03%, negative bias on earnings.

With stock at 81.20 the data suggests these ranges:
Based on current IV (expected move into Friday per TOS): 77.15 to 85.25
Based on AVERAGE move over last 12 quarters: 77.44 to 84.96
Based on MAXIMUM move over last 12 Q’s (12.1%): 71.40 to 91.00

Open for requests on other symbols.

PNC earnings analysis

#Earnings $PNC reports tomorrow morning. Below are details on earnings one-day moves over the last 12 quarters.

Oct. 12, 2018 BO -5.58% Biggest DOWN
July 13, 2018 BO +0.23%
April 13, 2018 BO -4.11%
Jan. 12, 2018 BO +0.23%
Oct. 13, 2017 BO -1.12%
July 14, 2017 BO -0.11%
April 13, 2017 BO -0.17%
Jan. 13, 2017 BO +0.72% Biggest UP
Oct. 14, 2016 BO +0.10%
July 15, 2016 BO -0.96%
April 14, 2016 BO -0.56%
Jan. 15, 2016 BO -0.62%

Avg (+ or -) 1.21%
Bias -1.00%, negative bias on earnings.

With stock at 119.00 the data suggests these ranges:
Based on current IV (expected move into Friday per TOS): 115.40 to 122.60
Based on AVERAGE move over last 12 quarters: 117.56 to 120.44
Based on MAXIMUM move over last 12 Q’s (5.6%): 112.36 to `25.64

Open for requests on other symbols.

SPX Feb condor

#SPX1dte On Jan 4th I sold the $SPX Feb 15th 2250/2270-2730/2750 iron condors for 3.00, as a roll from a 1-dte spread that was a .50 loser. The idea is to make back the premium over a longer period while continuing to sell the 1-dte spreads every week.

Today, I closed the put spread side for .50. Order is in to close the call side for .70.

GS earnings analysis

#Earnings $GS reports tomorrow morning. Below are details on earnings one-day moves over the last 12 quarters.

Oct. 16, 2018 BO +3.01% Biggest UP
July 17, 2018 BO -0.18%
April 17, 2018 BO -1.64%
Jan. 17, 2018 BO -1.86%
Oct. 17, 2017 BO -2.60%
July 18, 2017 BO -2.59%
April 18, 2017 BO -4.71% Biggest DOWN
Jan. 18, 2017 BO -0.61%
Oct. 18, 2016 BO +2.14%
July 19, 2016 BO -1.17%
April 19, 2016 BO +2.28%
Jan. 20, 2016 BO -1.95%

Avg (+ or -) 2.06%
Bias -0.82%, slight negative bias on earnings.

NOTE: Another minor mover on earnings; 3-day maxes show no significant differences.

With stock at 178.00 the data suggests these ranges:
Based on current IV (expected move into Friday per TOS): 170.85 to 185.15
Based on AVERAGE move over last 12 quarters: 174.33 to 181.67
Based on MAXIMUM move over last 12 Q’s (4.7%): 169.62 to 186.38

Open for requests on other symbols.

SPX 1-dte expires

#SPX1dte Expiring today: $SPX Jan 14th 2520/2540-2630/2650 condors, sold for .90 on Friday.

JPM earnings analysis

#Earnings $JPM reports tomorrow morning. Below are details on earnings one-day moves over the last 12 quarters.

Oct. 12, 2018 BO -1.09%
July 13, 2018 BO -0.45%
April 13, 2018 BO -2.70% Biggest DOWN
Jan. 12, 2018 BO +1.65%
Oct. 12, 2017 BO -0.28%
July 14, 2017 BO -0.91%
April 13, 2017 BO -1.17%
Jan. 13, 2017 BO +0.53%
Oct. 14, 2016 BO -0.32%
July 14, 2016 BO +1.51%
April 13, 2016 BO +4.23% Biggest UP
Jan. 14, 2016 BO +1.49%

Avg (+ or -) 1.36%
Bias 0.21%, slight positive bias on earnings.

NOTE: JPM is a very small mover on earnings. The above are the 1-day moves; I checked 5-day moves, but the +4.23% move above was still the highest.

With stock at 100.00 the data suggests these ranges:
Based on current IV (expected move into Friday per TOS): 96.58 to 103.42
Based on AVERAGE move over last 12 quarters: 98.64 to 101.36
Based on MAXIMUM move over last 12 Q’s (4.2%): 95.77 to 104.23

Open for requests on other symbols.

#ironbutterfly

SPX 1-dte sold

#SPX1dte Sold $SPX Jan 14th 2520/2540-2630/2650 iron condors for .90.

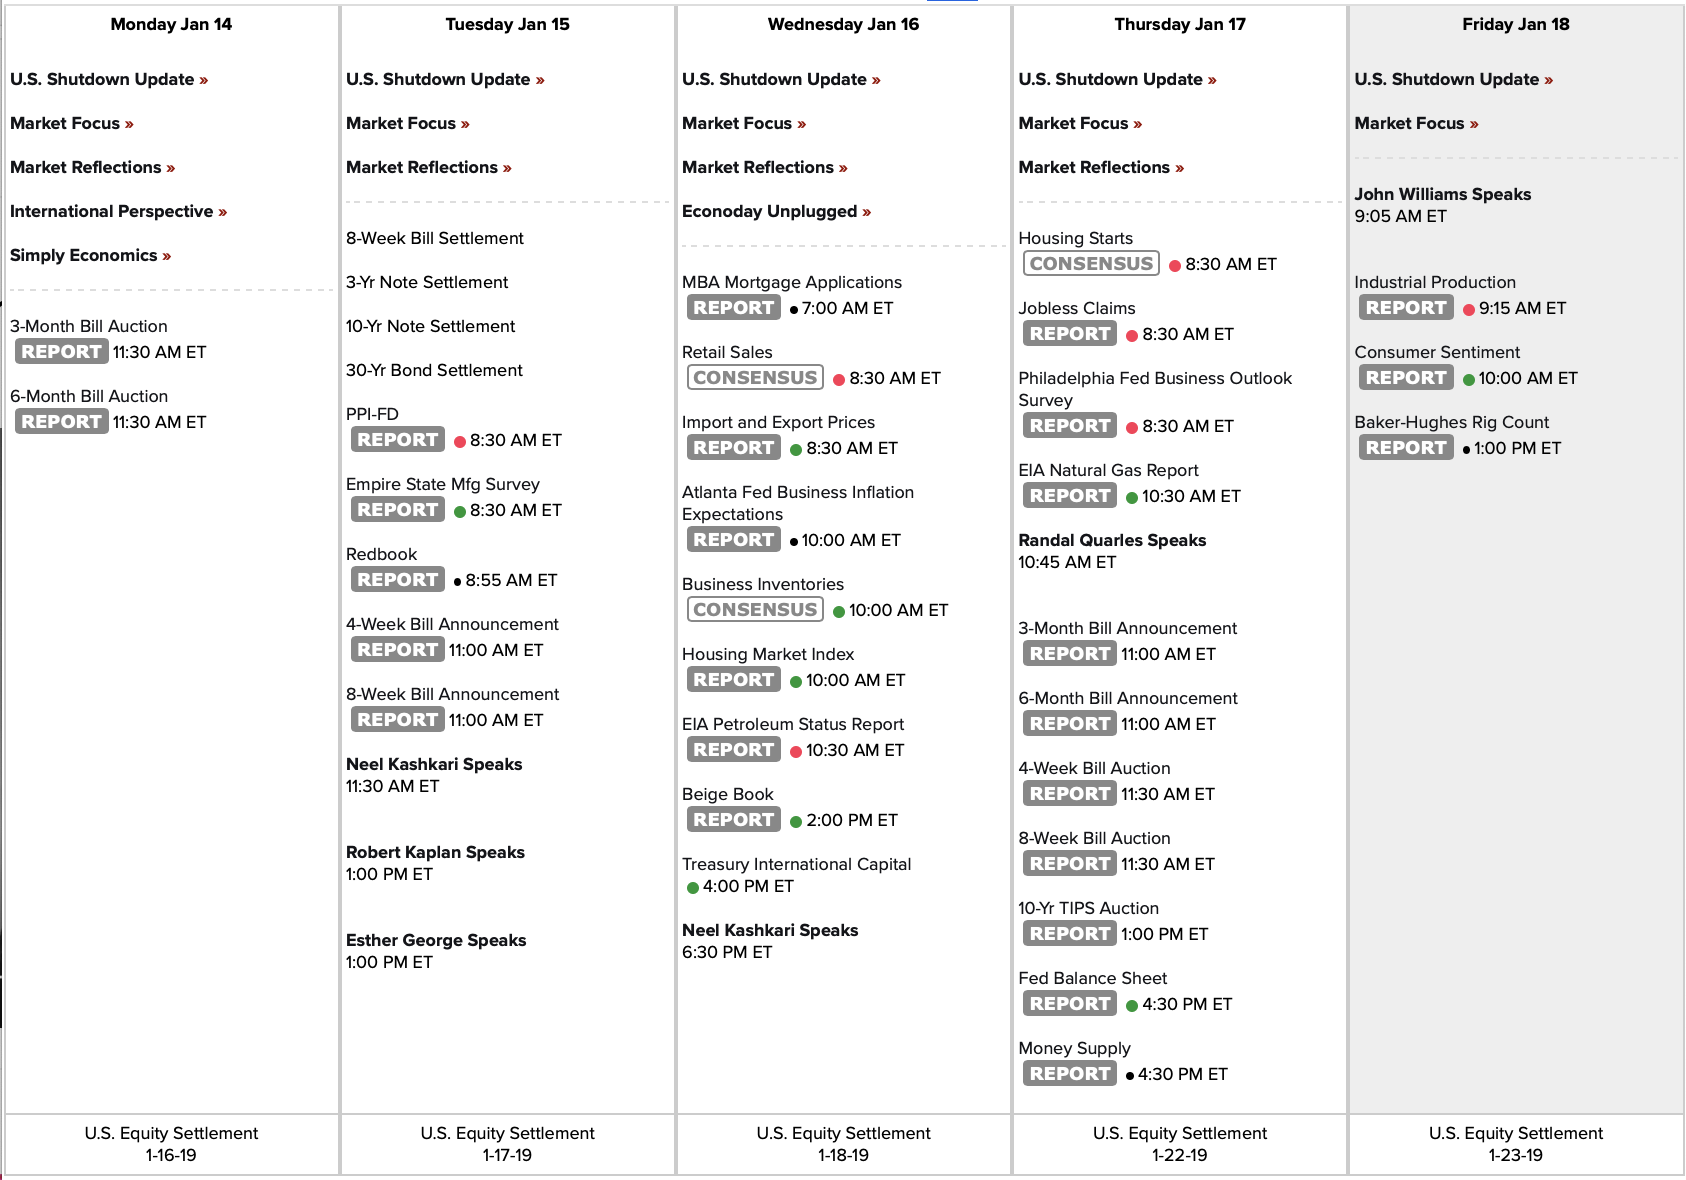
Econ Calendar for week of 1/14/19

screen shot 2019-01-18 at 10.35.16 am

screen shot 2019-01-11 at 10.59.10 am

Link to calendar: https://us.econoday.com/byweek.asp?day=14&month=1&year=2019&cust=us&lid=0

SPX 1-dte closed

#SPX1dte Closed short calls for .10 and short puts for .05. Condor sold yesterday for .90.

Will sell one for Monday at the end of the day.

C (Citigroup) earnings analysis

#Earnings $C reports Monday morning. Below are details on earnings one-day moves over the last 12 quarters.

Oct. 12, 2018 BO +2.13%
July 13, 2018 BO -2.20%
April 13, 2018 BO -1.55%
Jan. 16, 2018 BO +2.27%
Oct. 12, 2017 BO -7.63%
July 14, 2017 BO -2.58%
April 13, 2017 BO -5.07%
Jan. 18, 2017 BO -5.02%
Oct. 14, 2016 BO +5.66%
July 15, 2016 BO +5.93% Biggest UP
April 15, 2016 BO +5.61%
Jan. 15, 2016 BO -13.59% Biggest DOWN

Avg (+ or -) 4.94%
Bias -1.34%, slight negative bias on earnings.

NOTE: above are the 1-day moves; I checked 5-day moves and the ranges are actually LOWER, meaning that any extreme one-day moves were faded to be less severe after a few days.

With stock at 57.00 the data suggests these ranges:
Based on current IV (expected move into next Friday per TOS): 53.98 to 60.02
Based on AVERAGE move over last 12 quarters: 54.19 to 59.81
Based on MAXIMUM move over last 12 Q’s (13.6%): 49.25 to 64.75

Open for requests on other symbols.

It’s brutal out there…

https://platform.twitter.com/widgets.js

SPX 1-dte

#SPX1dte Sold $SPX Jan 11th 2520/2540-2635/2655 iron condors for .85

Jerome can’t stay quiet

Not originally scheduled, but added to the calendar:

Federal Reserve Chairman Jerome Powell to participate in discussion at the Economic Club of Washington in Washington, DC.

Today, 12:45 ET

https://wp.me/p6Nxuc-eeY

SPX 1-dte closed

#SPX1dte Exited short puts for .05, but had to pay .55 to exit call side. Condors sold for 1.20 yesterday.

BBBY earnings analysis

#Earnings $BBBY reports tonight. Below are details on earnings one-day moves over the last 12 quarters.

Sept. 26, 2018 AC -20.99% Biggest DOWN
June 27, 2018 AC -3.81%
April 11, 2018 AC -19.95%
Dec. 20, 2017 AC -12.49%
Sept. 19, 2017 AC -15.87%
June 22, 2017 AC -12.12%
April 5, 2017 AC 3.38% Biggest UP
Dec. 21, 2016 AC -9.17%
Sept. 21, 2016 AC 0.74%
June 22, 2016 AC 1.50%
April 6, 2016 AC 0.32%
Jan. 7, 2016 AC 0.27%

Avg (+ or -) 8.38%
Bias -7.35%, strong negative bias on earnings.

With stock at 12.00 the data suggests these ranges:
Based on current IV (expected move per TOS): 10.12 to 13.88
Based on AVERAGE move over last 12 quarters: 10.99 to 13.01
Based on MAXIMUM move over last 12 Q’s (21.0%%): 9.48 to 14.52

Open for requests on other symbols.

TQQQ calls sold

#LongLEAPs #SyntheticCoveredCalls

Sold $TQQQ Jan 11th 42.5 calls for 1.45. A roll from this week’s calls that were stopped out.

Fed minutes

Heads up… Fed minutes released today at 2pm ET. Potential market mover.

SPX 1-dte

#SPX1dte Sold $SPX Jan 9th 2485/2505/2620/2640 condors for 1.20.

SQ calls sold

#LongLEAPs #SyntheticCoveredCalls

Sold to Open $SQ Jan 18th 66 calls for 1.35. Replace the Jan 4th calls I stopped out of yesterday.

Calls stopped

#LongLEAPs #SyntheticCoveredCalls First time I’ve had to do this in weeks. Both strikes breached so I exited on pull back and will wait for spikes higher to roll.

BTC $SQ Jan 11th 61 calls for 1.65. Sold for 1.20 on Friday.
BTC $TQQQ Jan 11th 40 calls for 1.30. Sold for .85 on Friday.

SPX 1-dte closed

#SPX1dte Earlier, closed $SPX Jan 7th shorts, puts for .05 and calls for .15. Condors sold Friday for 1.10

SPX 1-dte

#SPX1dte Sold to Open $SPX Jan 7th 2440/2460-2590/2610 condors for 1.10.

Calling again

#LongLEAPs #SyntheticCoveredCalls
Sold $TQQQ Jan 11th 40 calls for .85
Sold $SQ Jan 11th 61 calls for 1.20.

SPX Feb condor

#SPX1dte Sold $SPX Feb 2250/2270-2730/2750 condors for 3.00. Will close at or near 50%, or 1.50.

#spycraft

Econ calendar for week of 1/7/19

Fed minutes, Wednesday at 2pm ET.

screen shot 2019-01-10 at 6.12.04 am

screen shot 2019-01-04 at 10.43.27 am

Link to calendar: https://us.econoday.com/byweek.asp?day=7&month=1&year=2019&cust=us&lid=0

SPX 1-dte closed

#SPX1dte SPX hit my upside stop (expected move breached the 2520 short calls), so I exited on the pull back.

BTC $SPX Jan 4th 2520/2540 call spreads for 1.70. Condors sold yesterday for 1.25. Puts will expire, or close for .05.

I’ll be selling another 1-dte for Monday expiration. I’m looking for longer term roll options to replace today’s stop.

December Jobs Report

#Jobs Much higher than expected.

+312,000 non-farm payroll jobs, vs. 176K expected
Unemployment at 3.9%, up 0.2%
U6 unemployment at 7.6%, unchanged
Wages up 0.4%, 3.2% year over year
Labor force participation 63.1%, up by 0.2

November revised up from 155k to 176k
October revised up from 237K to 274k

SPX 1-dte

#SPX1dte Sold $SPX Jan 4th 2345/2365-2520/2540 for 1.25.

PVTL covered calls

#CoveredCalls Sold $PVTL Jan 18th 17 calls for .50.

Calls closed (again)

If I was only selling calls and didn’t have #LongLEAPs, this would be a brilliant strategy!

BTC $TQQQ Jan 4th 39.5 calls for .05. Sold for .74 on Friday.
BTC $SQ Jan 4th 59 calls for .05. Sold for .79 on Friday.