
#Earnings Sold to close partial $UAA Feb 15th 21 calls for 1.25.
Sold to close partial $SHOP dbl cals for 2.55
Author Archives: Jeff
SPX 1-dte
#SPX1dte Sold $SPX Feb 13th 2690/2710-2775/2795 condors for 1.00. Slightly more aggressive, with a .07 delta, because .06 or below was not enough premium. (IV: 11.0%, SPX 2747)
ATVI earnings analysis
#Earnings — $ATVI reports tonight. Below are details on earnings one-day moves over the last 12 quarters.
Nov. 8, 2018 AC -12.39% Biggest DOWN
Aug. 2, 2018 AC -3.69%
May 3, 2018 AC +4.51%
Feb. 8, 2018 AC +1.90%
Nov. 2, 2017 AC -3.43%
Aug. 3, 2017 AC -3.06%
May 4, 2017 AC +1.37%
Feb. 9, 2017 AC +18.87% Biggest UP
Nov. 3, 2016 AC -3.85%
Aug. 4, 2016 AC -0.66%
May 5, 2016 AC +8.47%
Feb. 11, 2016 AC -7.86%
Avg (+ or -) 5.84%
Bias 0.02%, no bias on earnings.
With stock at 41.20 the data suggests these ranges:
Based on current IV (expected move into Friday per TOS): 37.23 to 45.17
Based on AVERAGE move over last 12 quarters: 38.79 to 43.61
Based on MAXIMUM move over last 12 Q’s (18.9%): 33.43 to 48.97
TRIP earnings analysis
#Earnings — $TAP reports tonight. Below are details on earnings one-day moves over the last 12 quarters.
Nov. 7, 2018 AC +15.25%
Aug. 1, 2018 AC -11.22%
May 8, 2018 AC +22.79% Biggest UP
Feb. 14, 2018 AC +4.12%
Nov. 6, 2017 AC -23.22% Biggest DOWN
Aug. 8, 2017 AC +2.50%
May 9, 2017 AC +2.28%
Feb. 15, 2017 AC -10.96%
Nov. 8, 2016 AC -16.59%
Aug. 3, 2016 AC -8.49%
May 4, 2016 AC -1.72%
Feb. 11, 2016 BO +12.36%
Avg (+ or -) 10.96%
Bias -1.08%, slight negative bias on earnings.
With stock at 60.30 the data suggests these ranges:
Based on current IV (expected move into Friday per TOS): 53.58 to 67.02
Based on AVERAGE move over last 12 quarters: 53.69 to 66.91
Based on MAXIMUM move over last 12 Q’s (23.2%): 46.30 to 74.30
Earnings chart update
#Earnings All of the tentative symbols on the list for today are now being estimated for morning of 2/20: CRON, ICPT, SINA, and WB.
Closing SHOP
#Earnings Sold to close partial $SHOP Feb15/Feb22 175 #DoubleCalendar for 2.10. Bought yesterday for 1.60. Price moving toward strike so trying to close the rest for higher credit.
$TAP Dbl Cal is tapping out. Will need to see if a bounce comes into Friday. This was cheap (.34), so no biggie.
$UAA no gap but drifting higher so this may turn out well. #LongStraddle bought for 2.50.
Earnings trades today
Bought $UAA Feb 15th 21 #LongStraddle for 2.50. Need a 11.9% move. Average has been 16.1%.
Bought $TAP Feb15/Feb22 65 #DoubleCalendar for .34. Super cheap!
Looking at a calendar for $SHOP, also cheap.
UAA earnings analysis
#Earnings — $UAA reports tomorrow morning. Below are details on earnings FIVE-day moves over the last 12 quarters. NOTE: symbol UAA only lists history starting 1/31/17. The data before that date is for symbol $UA (below the line).
Tue 10/30/2018 BO +30.29% Biggest UP
Thu 07/26/2018 BO -4.60%
Tue 05/01/2018 BO -2.25%
Tue 02/13/2018 BO +22.00%
Tue 10/31/2017 BO -29.25% Biggest DOWN
Tue 08/01/2017 BO -8.14%
Thu 04/27/2017 BO +7.40%
Tue 01/31/2017 BO -28.47%
——————————
Tue 10/25/2016 BO -21.24%
Tue 07/26/2016 BO -9.47%
Thu 04/21/2016 BO +6.00%
Thu 01/28/2016 BO +24.13%
Avg (+ or -) 16.10%
Bias -1.13%, slight negative bias on earnings.
With stock at 21.00 the data suggests these ranges:
Based on current IV (expected move into Friday per TOS): 18.26 to 23.74
Based on AVERAGE move over last 12 quarters: 17.62 to 24.38
Based on MAXIMUM move over last 12 Q’s (30.3%): 14.64 to 27.36
SPX 1-dte
#SPX1dte Closed $SPX Feb 11th 2730 calls for .20. Stop level breached earlier.
TAP earnings analysis
#Earnings — $TAP reports tomorrow morning. Below are details on earnings one-day moves over the last 12 quarters. (5-day range was roughly the same)
Oct. 31, 2018 BO +9.94% Biggest UP
Aug. 1, 2018 BO +3.47%
May 2, 2018 BO -15.40% Biggest DOWN
Feb. 14, 2018 BO +6.26%
Nov. 1, 2017 BO +0.21%
Aug. 2, 2017 BO +2.95%
May 4, 2017 BO +0.92%
Feb. 14, 2017 BO +3.41%
Nov. 1, 2016 BO +1.44%
Aug. 2, 2016 BO -0.05%
May 3, 2016 BO +1.59%
Feb. 11, 2016 BO -0.65%
Avg (+ or -) 3.86%
Bias 1.17%, positive bias on earnings.
With stock at 65.00 the data suggests these ranges:
Based on current IV (expected move into Friday per TOS): 60.77 to 69.23
Based on AVERAGE move over last 12 quarters: 62.49 to 67.51
Based on MAXIMUM move over last 12 Q’s (15.4%): 54.99 to 75.01
SHOP earnings analysis
#Earnings — $SHOP reports tomorrow morning. Below are details on earnings one-day moves over the last 12 quarters. (5-day moves were similar, with a smaller range, meaning extreme 1-day moves are typically faded over the following days)
Oct. 25, 2018 BO +12.03% Biggest UP
July 31, 2018 BO -6.66%
May 1, 2018 BO -4.45%
Feb. 15, 2018 BO +0.28%
Oct. 31, 2017 BO -9.02% Biggest DOWN
Aug. 1, 2017 BO +5.77%
May 2, 2017 BO +7.40%
Feb. 15, 2017 BO +8.13%
Nov. 2, 2016 BO +6.84%
Aug. 3, 2016 BO +9.72%
May 4, 2016 BO -3.67%
Feb. 17, 2016 BO +9.12%
Avg (+ or -) 6.92%
Bias 2.96%, strong positive bias on earnings.
With stock at 177.00 the data suggests these ranges:
Based on current IV (expected move into Friday per TOS): 159.33 to 194.67
Based on AVERAGE move over last 12 quarters: 164.74 to 189.26
Based on MAXIMUM move over last 12 Q’s (12.0%): 155.71 to 198.29
Econ Calendar for week of 2/11/19


Link to calendar: https://us.econoday.com/byweek.asp?cust=us
Upside Warning pullbacks
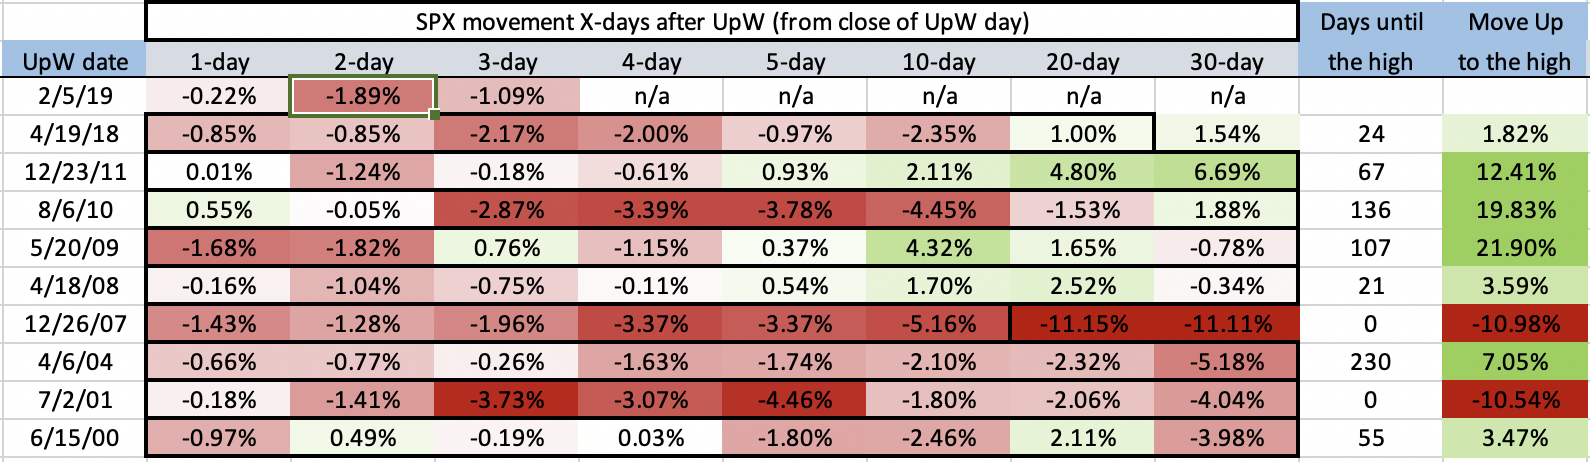
#VIXIndicator Since we’re in this pullback I looked back at other times we had a signficant pullback (more than 1%) after an Upside Warning fires. The chart below shows all of the instances since 1999.
Two of them resulted in no new highs, and we dropped significantly before the Upside Warning was technically canceled (the two rows with red in the right-most column). The other times all eventually went higher after the dip.
The center columns show the move 1-day, 2-days, etc, after the UpW. The right-hand columns show the number of days from the UpW to the new SPX high, and the percentage move to get there.
Also note that other than one time last April, this hasn’t happened any other time since 2011.
For me, the $VIX seems pretty unmoved by this week’s volatility and I still think we have higher to go before any major pullback.
SPX 1 die
#SPX1dte Expiring today : $SPX Feb 8th 2630/2655-2730/2755 condors, sold yesterday for .90
Sold to Open $SPX Feb 11th 2635/2655-2730/2745 condors for .80. Yes, this is broken-wing as I had to make the call side narrower because the 2750 spike has insufficient volume. (IV: 8.33%, SPX: 2700)
SPX 1 die
#SPX1dte Sold to Open $SPX Feb 8th 2630/2655-2730/2755 condors for .90 (IV: 12.8%, SPX 2697)
MAT earnings analysis
#Earnings $MAT reports tonight. Below are details on earnings one-day moves over its entire history.
Oct. 25, 2018 AC -2.81%
July 25, 2018 AC -4.17%
April 26, 2018 AC +1.35%
Feb. 1, 2018 AC +7.89%
Oct. 26, 2017 AC -8.91%
July 27, 2017 AC -7.79%
April 20, 2017 AC -13.56%
Jan. 25, 2017 AC -17.64% Biggest DOWN
Oct. 19, 2016 AC +6.00%
July 20, 2016 AC -0.30%
April 20, 2016 AC -5.78%
Feb. 1, 2016 AC +13.82% Biggest UP
Avg (+ or -) 7.50%
Bias -2.66%, negative bias on earnings.
With stock at 12.30 the data suggests these ranges:
Based on current IV (expected move into Friday per TOS): 11.04 to 13.56
Based on AVERAGE move over last 12 quarters: 11.38 to 13.22
Based on MAXIMUM move over last 12 Q’s (17.6%): 10.13 to 14.47
Open for requests on other symbols.
SKX earnings analysis
#Earnings $SKX reports tonight. Below are details on earnings one-day moves over its entire history.
Oct. 18, 2018 AC +13.78%
July 19, 2018 AC -20.99%
April 19, 2018 AC -27.04% Biggest DOWN
Feb. 8, 2018 AC +7.54%
Oct. 19, 2017 AC +41.44% Biggest UP
July 20, 2017 AC +0.67%
April 20, 2017 AC -2.56%
Feb. 9, 2017 AC +19.32%
Oct. 20, 2016 AC -17.26%
July 21, 2016 AC -22.34%
April 21, 2016 AC +6.26%
Feb. 10, 2016 AC +3.93%
Avg (+ or -) 15.26%
Bias 0.23%, no significant bias on earnings.
With stock at 27.50 the data suggests these ranges:
Based on current IV (expected move into Friday per TOS): 23.69 to 31.31
Based on AVERAGE move over last 12 quarters: 23.30 to 31.70
Based on MAXIMUM move over last 12 Q’s (41.4%): 16.10 to 38.90
Open for requests on other symbols.
FEYE and MPC closed
#Earnings Sold to close final $FEYE puts for 2.27.
Sold to close $MPC Feb08/Feb15 #DoubleCalendar for .85. Bought yesterday for .65
EXPE earnings analysis
#Earnings $EXPE reports tonight. Below are details on earnings one-day moves over its entire history.
Oct. 25, 2018 AC +2.49%
July 26, 2018 AC +9.53%
April 26, 2018 AC +8.19%
Feb. 8, 2018 AC -15.46%
Oct. 26, 2017 AC -15.98% Biggest DOWN
July 27, 2017 AC +3.40%
April 27, 2017 AC -1.82%
Feb. 9, 2017 AC -0.48%
Oct. 27, 2016 AC +4.12%
July 28, 2016 AC -2.19%
April 28, 2016 AC +8.20%
Feb. 10, 2016 AC +9.56% Biggest UP
Avg (+ or -) 6.79%
Bias 0.80%, slight positive bias on earnings.
With stock at 127.50 the data suggests these ranges:
Based on current IV (expected move into Friday per TOS): 118.87 to 136.13
Based on AVERAGE move over last 12 quarters: 118.85 to 135.15
Based on MAXIMUM move over last 12 Q’s (16.0%): 107.13 to 147.87
Open for requests on other symbols.
Adding to SPY
Bought some more $SPY March 8th 277.5 calls for 1.44, adding to what started yesterday. This pullback makes me worry about Upside Warning coming through, but not throwing in the towel unless it is sustained. Pullbacks have been known to happen after the Warning fires… threw me off in Sept 2017, and then got my face ripped off to the upside.
FEYE earnings
#Earnings #LongStraddle Sold to close $FEYE Feb 8th 18.5 puts for 2.05 and 2.40. Still holding a few more. Straddles bought yesterday for 1.81. Smaller return that usual, but I’ll take it.
Working on $MPC exit. Also will not be as good as CMI was yesterday, but still a winner.
SPX 1-dte expiring
#SPX1dte $SPX Feb 6th 2710/2690 put spreads expiring worthless. Sold yesterday for 1.10.
Earnings trades
#Earnings Bought to Open $FEYE Feb 8th 18.5 #LongStraddle for 1.81. Need a 9.7% move, which is the 12-quarter average.
Bought to Open $MPC Feb08/Feb15 67.5 #DoubleCalendar for .65.
FEYE earnings analysis
#Earnings $FEYE reports tonight. Below are details on earnings one-day moves over its entire history.
Oct. 30, 2018 AC +9.73%
Aug. 1, 2018 AC -1.91%
May 2, 2018 AC -9.70%
Feb. 8, 2018 AC +9.34%
Nov. 1, 2017 AC -10.32%
Aug. 1, 2017 AC +0.74%
May 2, 2017 AC +12.85% Biggest UP
Feb. 2, 2017 AC -15.72%
Nov. 3, 2016 AC +12.07%
Aug. 4, 2016 AC -12.05%
May 5, 2016 AC -19.02% Biggest DOWN
Feb. 11, 2016 AC -3.30%
Avg (+ or -) 9.73%
Bias -2.27%, negative bias on earnings.
With stock at 18.25 the data suggests these ranges:
Based on current IV (expected move into Friday per TOS): 16.45 to 20.05
Based on AVERAGE move over last 12 quarters: 16.47 to 20.03
Based on MAXIMUM move over last 12 Q’s (19.0%): 14.78 to 21.72
Open for requests on other symbols.
CMG earnings analysis
#Earnings $CMG reports tonight. Below are details on earnings one-day moves over its entire history.
Oct. 25, 2018 AC +3.42%
July 26, 2018 AC +5.71%
April 25, 2018 AC +24.44% Biggest UP
Feb. 6, 2018 AC -10.55%
Oct. 24, 2017 AC -14.58% Biggest DOWN
July 25, 2017 AC -2.30%
April 25, 2017 AC +2.38%
Feb. 2, 2017 AC -4.54%
Oct. 25, 2016 AC -9.28%
July 21, 2016 AC +5.83%
April 26, 2016 AC -6.43%
Feb. 2, 2016 AC -2.92%
Avg (+ or -) 7.70%
Bias -0.74%, slight negative bias on earnings.
With stock at 521.00 the data suggests these ranges:
Based on current IV (expected move into Friday per TOS): 484.07 to 557.93
Based on AVERAGE move over last 12 quarters: 480.89 to 561.11
Based on MAXIMUM move over last 12 Q’s (24.4%): 393.67 to 648.33
Open for requests on other symbols.
Upside Warning performance metrics
#VIXIndicator Because I’m becoming an Excel geek, I made a new chart measuring a performance metric for the Upside Warning. This shows the rise we have gotten from past Upside Warnings in relation to how much the SPX had already recovered before the Warning hit. For instance, the upper-left-most dot represents a 32.2% rise in SPX AFTER the UpW; the UpW hit after SPX had recovered only 26% of its drop (horizontal axis).
I drew the sloppy red line showing the general trend: the less we have recovered from the correction when the UpW hit, the higher we can expect the rise to be after the UpW. Although the red line shows a trend, you can see that most are clustered in the same general area.
And for comparison today, we had recovered 65.5% at the close yesterday, when the UpW hit. (high 2940, low 2351, 20% drop. Close yesterday was 2737, which means we regained 65.5% of the drop).

Earnings trades, CMI, SNAP, DECK partially closed
#Earnings #DoubleCalendar Sold to close partial $CMI Feb08/Feb15 149 dbl cal for 1.20. Waiting for price to move closer to my strike to close more. Bought yesterday for .65
#LongStraddle Sold to close partial $SNAP Feb 8th 7 calls for 1.75. Watching for a move higher. Straddles bought yesterday for 1.03.
#IronCondor Bought to close partial $DECK Feb 15th 105/110/145/150 condors for .50. Sold Thursday for .86.
SPX 1-dte
#SPX1dte Sold to Open $SPX Feb 6th 2710/2690 put spreads for 1.10. Selling only a .12 delta put spread. no call spread for tomorrow. This is based on upside warning going into effect. It still carries higher risk, because while an Upside Warning is a pretty sure shot for a move higher, we could always take a dip or a drop first. But I think this is sufficiently OTM to withstand a pullback, if one comes tomorrow.
SNAP straddle
#Earnings Bought to Open $SNAP Feb 8th 7 #LongStraddle for 1.03 (partial fill so far, may need to go to 1.04).
Upside Warning coming
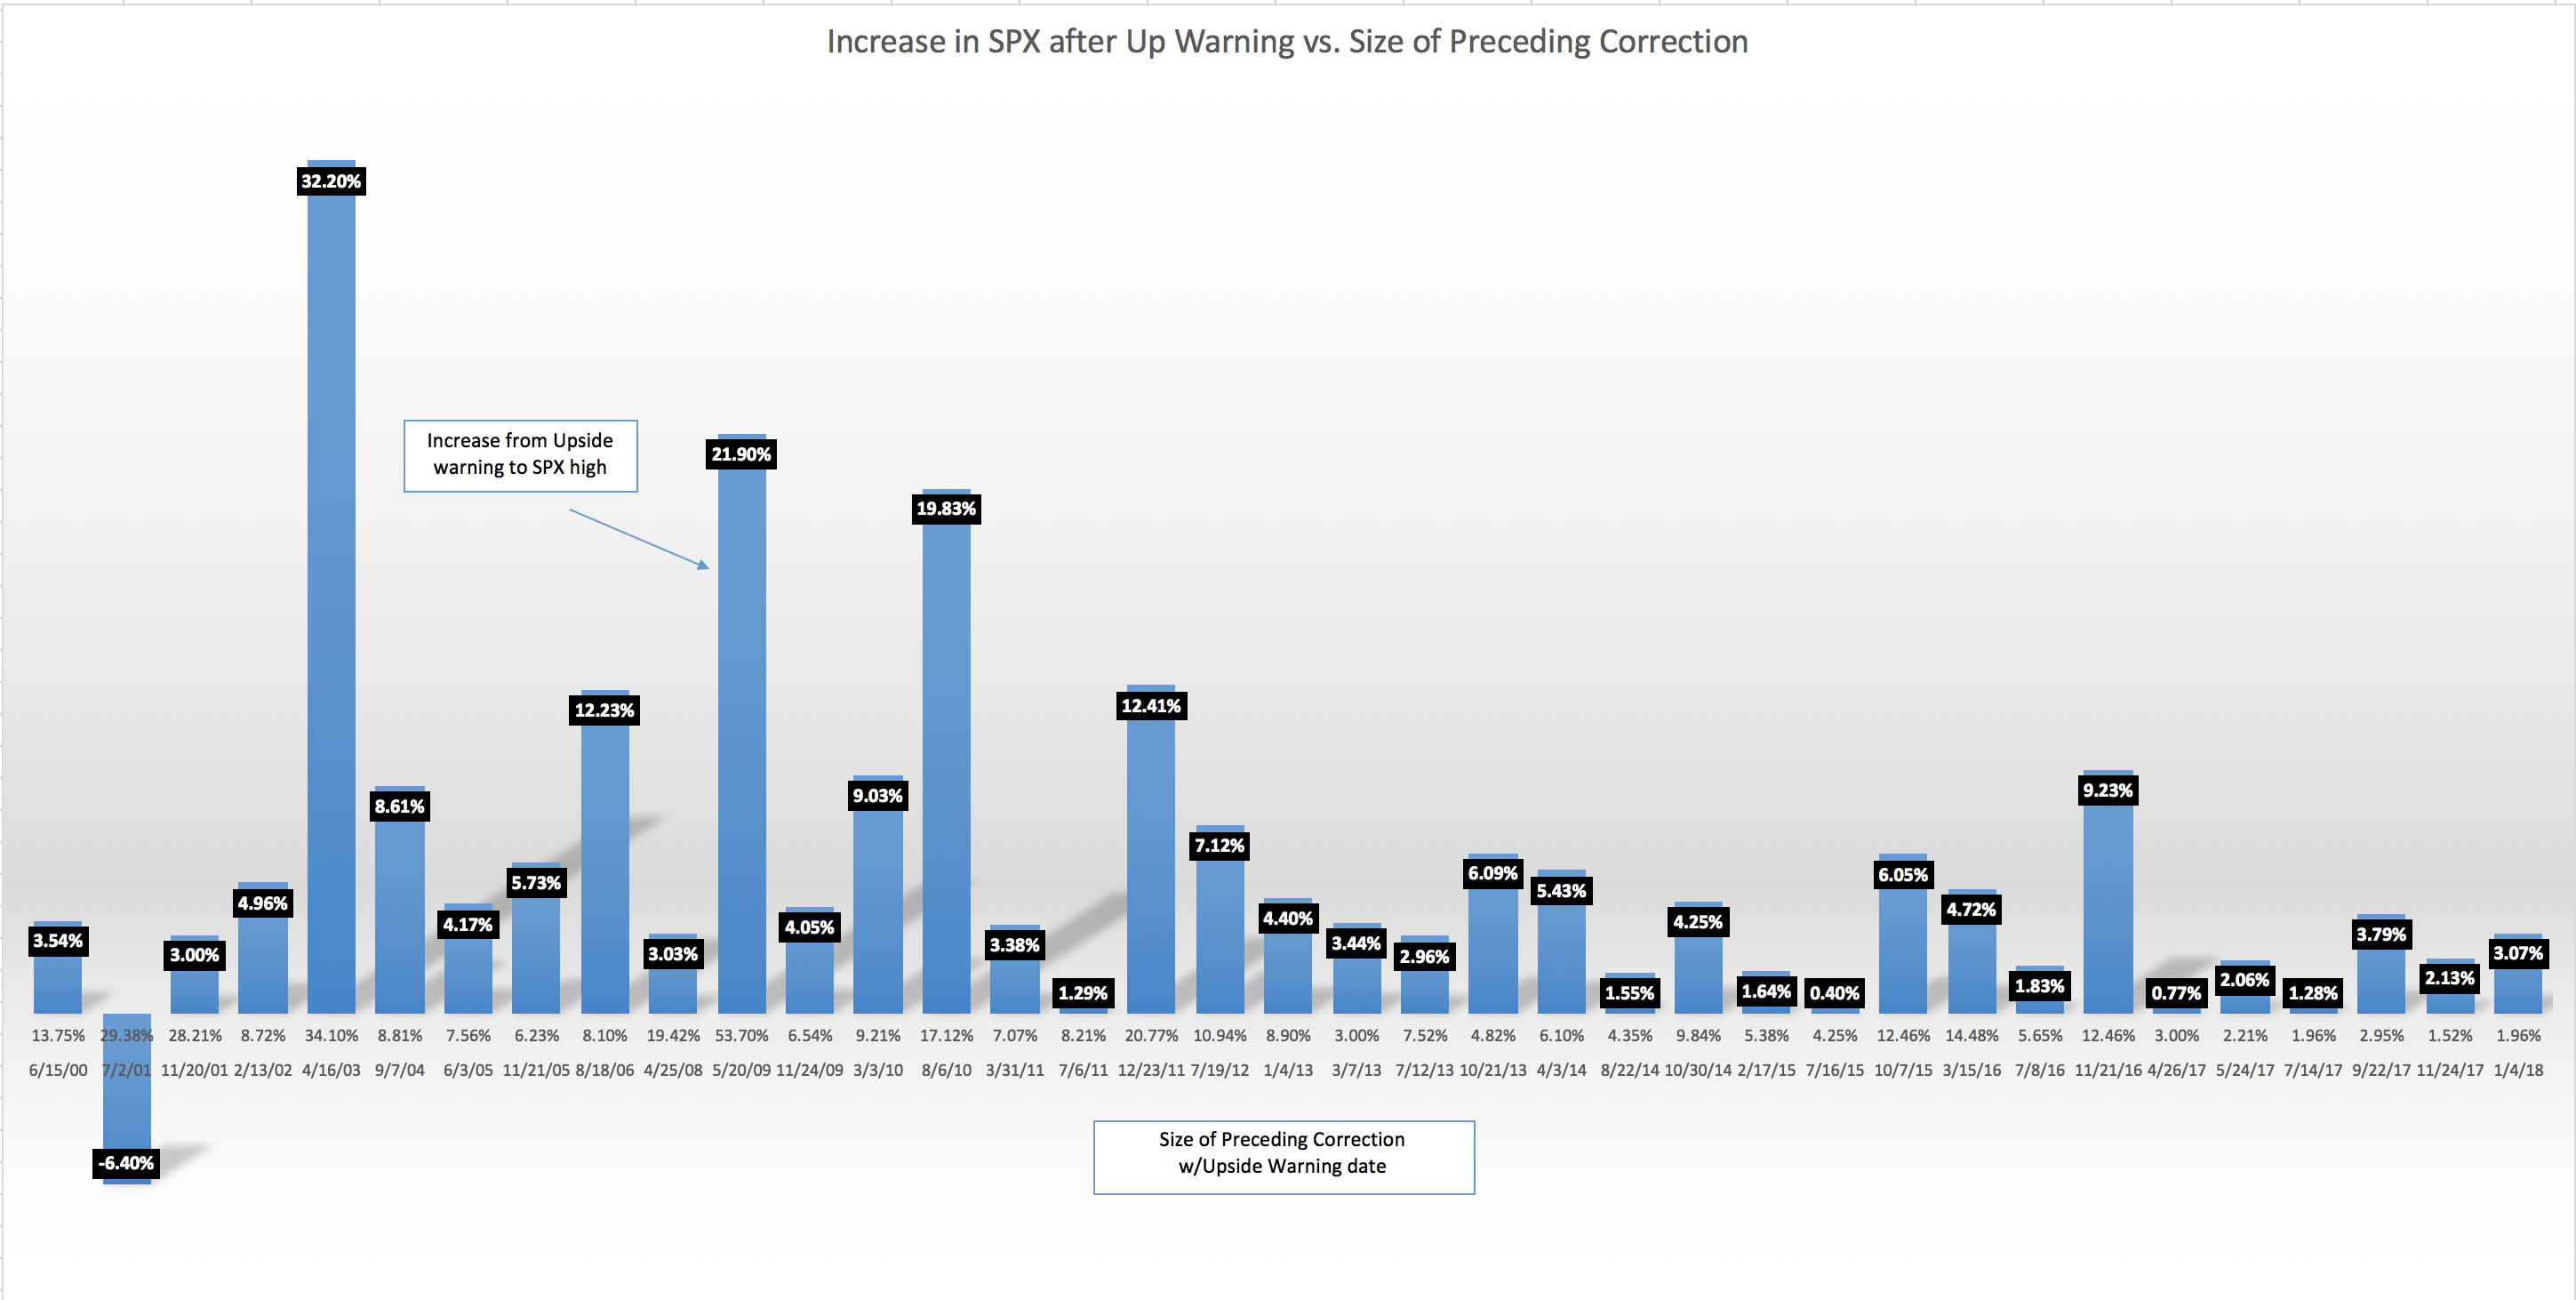
#VIXIndicator Here’s the version of the past results I posted back in May. The blue bars with numbers on top represent the percentage move UP from the close of an Upside Warning day to the eventual SPX high before another pullback. The numbers at the bottom of each bar are the percentage move DOWN of the preceding correction, and the date of the Upside Warning. Please ask any questions you have! (you can click on the chart to see it full screen).
As you can see, the Upside Warning is pretty reliable for at least a couple percentage points higher.
CMI dbl cal
#Earnings Bought to Open $CMI Feb08/Feb15 149 #DoubleCalendar for .65. (filled at .63 on TOS)
CMI earnings analysis – dbl calendar candidate
#Earnings — This one is a good double calendar candidate because it is cheap to buy. Premium for this Friday is not much lower than premium for next Friday. That gives us a pretty good range of profit; a range almost as wide as the max moves.
$CMI reports tomorrow morning. Below are details on earnings one-day moves over the last 12 quarters.
Oct. 30, 2018 BO +2.29%
July 31, 2018 BO +4.08%
May 1, 2018 BO -4.11%
Feb. 6, 2018 BO -2.33%
Oct. 31, 2017 BO -1.92%
Aug. 1, 2017 BO -5.64% Biggest DOWN
May 2, 2017 BO +6.09%
Feb. 9, 2017 BO +3.06%
Nov. 1, 2016 BO -4.32%
Aug. 2, 2016 BO -0.62%
May 3, 2016 BO +1.77%
Feb. 4, 2016 BO +7.62% Biggest UP
Avg (+ or -) 3.65%
Bias 0.50%, slight positive bias on earnings.
With stock at 148.80 the data suggests these ranges:
Based on current IV (expected move into Friday per TOS): 142.54 to 155.06
Based on AVERAGE move over last 12 quarters: 143.36 to 154.24
Based on MAXIMUM move over last 12 Q’s (7.6%): 137.46 to 160.14
SPX put spread
#SPXcampaign This is based solely on the Upside Warning we will get at today’s close, barring a disaster.
Sold $SPX Feb 20th 2725/2700 put spreads for 8.40.
I’m not selling any call spreads, and I’ll probably buy one. I’m not yet sure about tomorrow’s #SPX1dte. Not seeing much premium.
SNAP earnings analysis – straddle candidate
#Earnings $SNAP reports tonight. Below are details on earnings one-day moves over its entire history.
Oct. 25, 2018 AC -10.15%
Aug. 7, 2018 AC -6.78%
May 1, 2018 AC -21.93%
Feb. 6, 2018 AC +47.58% Biggest UP (the only UP)
Nov. 7, 2017 AC -14.61%
Aug. 10, 2017 AC -14.08%
May 10, 2017 AC -21.45% Biggest DOWN
Avg (+ or -) 19.51%
Bias -5.92%, negative bias on earnings.
With stock at 6.82 the data suggests these ranges:
Based on current IV (expected move into Friday per TOS): 5.75 to 7.89
Based on AVERAGE move over last 12 quarters: 5.49 to 8.15
Based on MAXIMUM move over last 12 Q’s (47.6%): 3.58 to 10.06
Cost of a straddle is about 1.10. The AVG move has been 1.38. Nice low risk straddle candidate.
Open for requests on other symbols.
REGN earnings analysis
#Earnings $REGN reports tomorrow morning. Below are details on earnings one-day moves over the last 12 quarters.
Nov. 6, 2018 BO +0.75%
Aug. 2, 2018 BO +6.99% Biggest UP
May 3, 2018 BO -1.25%
Feb. 8, 2018 BO -3.58%
Nov. 8, 2017 BO +2.66%
Aug. 3, 2017 BO -2.03%
May 4, 2017 BO +6.70%
Feb. 9, 2017 BO +1.91%
Nov. 4, 2016 BO +1.60%
Aug. 4, 2016 BO -1.80%
May 5, 2016 BO +4.73%
Feb. 9, 2016 BO -6.28% Biggest DOWN
Avg (+ or -) 3.36%
Bias 0.87%, slight positive bias on earnings.
With stock at 425.00 the data suggests these ranges:
Based on current IV (expected move into Friday per TOS): 403.84 to 446.16
Based on AVERAGE move over last 12 quarters: 410.73 to 439.27
Based on MAXIMUM move over last 12 Q’s (7.0%): 395.29 to 454.71
Open for requests on other symbols.
DATA earnings analysis
#Earnings $DATA reports tonight. Below are details on earnings one-day moves over the last 12 quarters.
Nov. 6, 2018 AC +15.35% Biggest UP
Aug. 2, 2018 AC -6.64%
May 2, 2018 AC +6.58%
Feb. 1, 2018 AC +8.97%
Nov. 2, 2017 AC -9.21%
Aug. 2, 2017 AC +9.02%
May 3, 2017 AC +6.12%
Feb. 2, 2017 AC +14.66%
Nov. 1, 2016 AC -12.11%
Aug. 2, 2016 AC -5.67%
May 5, 2016 AC -11.31%
Feb. 4, 2016 AC -49.44% Biggest DOWN
Avg (+ or -) 12.92%
Bias -2.81%, negative bias on earnings.
With stock at 132.00 the data suggests these ranges:
Based on current IV (expected move into Friday per TOS): 119.66 to 144.34
Based on AVERAGE move over last 12 quarters: 114.94 to 149.06
Based on MAXIMUM move over last 12 Q’s (49.4%): 66.74 to 197.26
Open for requests on other symbols.
One more…
#VIXIndicator one more day with a $VIX close below 16.47 and we have an Upside Warning. I think today’s action foretells we are headed that way.
SPX roll
SPX 1-dte
#SPX1dte My third attempt at a long condor is the first losing one. Looks like the Feb 4th one will expire worthless. We’ll see how things play out through tomorrow if an Upside Warning hits, and proceed accordingly for the Feb 6th expiry.
I also backed out of this roll trade with a profit, as it could get steamrolled on the call side. I’ll look to sell a put spread to replace it.
BTC $SPX Feb 14th (monthly) 2600/2620/2760/2780 #CondorRoll for 3.95. Sold for 6.05 last Wednesday.
GOOGL earnings analysis
#Earnings $GOOGL reports tonight. Below are details on earnings FIVE-day moves over the last 12 quarters.
Thu 10/25/2018 AC -4.90%
Mon 07/23/2018 AC +3.46%
Mon 04/23/2018 AC -3.94%
Thu 02/01/2018 AC -8.22%
Thu 10/26/2017 AC +4.20%
Mon 07/24/2017 AC -4.00%
Thu 04/27/2017 AC +5.12% Biggest UP
Thu 01/26/2017 AC -4.29%
Thu 10/27/2016 AC -1.45%
Thu 07/28/2016 AC +4.47%
Thu 04/21/2016 AC -7.00%
Mon 02/01/2016 AC -8.69% Biggest DOWN
Avg (+ or -) 4.98%
Bias -2.10%, negative bias on earnings.
With stock at 1135.00 the data suggests these ranges:
Based on current IV (expected move into Friday per TOS): 1082.60 to 1187.40
Based on AVERAGE move over last 12 quarters: 1078.50 to 1191.50
Based on MAXIMUM move over last 12 Q’s (8.7%): 1036.37 to 1233.63
Open for requests on other symbols.
Downside Warning canceled!
#VIXIndicator Today’s $VIX close ends the 4-month Downside Warning. If we get two more closes at or below 16.47, it will trigger an Upside Warning, which usually means a strong rally for a few days or weeks.
SPX 1-dte long
#SPX1dte Bought to open $SPX Feb 4th 2645/2660-2740/2755 condors for .55. (IV 7.94%: SPX 2704)
I reduced to 15-wide to make it cheaper, and also went to the strike below .06 on each side. This lowers probability, but short strikes are only 80 apart, which is the lowest I have had on any condor in this strategy, long or short.
SPX 1-dte switch
#SPX1dte My short condor from yesterday will expire worthless (sold for 1.00)
I am going to BUY the condor for Monday, since volatility on the options chain plummeted to below 9%, after being above 15% all week. (today would have been a good day to sell a condor in the morning, and close it by day’s end)
AMZN closed
#Earnings BTC $AMZN Feb 1st 1600/1590 put spreads for .25. Not going to mess with this one if it decides to get cute. Condors sold yesterday for 2.00.
Econ Calendar for week of 2/4/18
**Jerome Powell speaks Wednesday at 7pm ET

Link to calendar: https://us.econoday.com/byweek.asp?day=4&month=2&year=2019&cust=us&lid=0
EW closed, and remaining earnings trades
#Earnings #DoubleCalendar
Sold to close $EW Feb01/Feb08 170 dbl cals for 3.25 (avg price). Bought yesterday for 1.57.
#IronButterfly $NOW expiring at max loss of .65.
#IronCondor $AMZN expiring at full profit, sold yesterday for 2.00.
#LongStraddle $EBAY straddle bought for 2.23 on Tuesday. It had a subtle move, so I played the swings and managed to sell for 1.168. Even when long straddles miss, they aren’t too bad provided you have a few days and some swings.
INTC trades
#Earnings #DoubleCalendar #LongStock #CoveredCalls #Dividends
Lat week’s double cal didn’t work but I stuck with the trade, selling the long put and taking assignment, cost basis of 47.34.
Today I lightened the load, selling slightly less than half of the stock for 49.00.
I’m converting the rest into a #PieTrade, so I sold to Open $INTC March 15th 50 covered calls for 1.01.
Double Cals
#Earnings #DoubleCalendar For 2nd quarter in a row, $EW is killing it on this strategy. The long options (Feb 8th) retain a lot of value, but because stock price is so close to my 170 strike, I was able to exit partial for 4.30 near the open. Now waiting for even a better price as the Feb 1st short options decay.
$MRK was the loser…. Sold to close $MRK Feb01/Feb08 74.5 dbl cals for .30. bought yesterday for .47
Working on the $HON exit. Looks like I’ll be able to get a slight profit.
BA earnings closed
#Earnings #Iron Condor This one is close to full loss, but I closed the call side for 4.50, a discount from what is likely to be an expiration of 5.00. Sold the condors for 1.75. Closed the $BA Feb 1st 380/385 call spreads for 4.50. Fortunately, earnings wins from this week will easily exceed this loss!
NUGT calls
#ContangoETFs Yesterday, Sold $NUGT Sept 35 calls for 2.06. First time back in NUGT in a long time, and currently my only ContangoETF position.
January Jobs Report
#Jobs Much higher than expected, again. December revised lower.
+304,000 non-farm payroll jobs, vs. 170K expected
Unemployment at 4.0%, up 0.1%
U6 unemployment at 8.1%, up 0.5%
Wages up 0.1%, 3.2% year over year
Labor force participation 63.2%, up by 0.1
December revised down from 312K to 222K
November revised up from 176K to 196K
Almost canceled
#VIXIndicator We closed with $VIX only 0.10 above the cancelation level of the Downside Warning, which has been in effect since October 5th. If bears are going to show up, they better do it soon.
Double Calendar trades
Bought $HON Feb01/Feb08 144 for .85
Bought $MRK Feb01/Feb08 74.5 for .47
Bought $EW Feb01/Feb08 170 for 1.57
DECK condor
#Earnoings #IronCondor Sold to Open $DECK Feb 1st 105/110/145/150 iron condors for .85
AMZN condor
#Earnings #IronCondor Sold to Open $AMZN Feb 1st 1590/1600-1870/1880 iron condors for 2.00.
SPX 1-dte
#SPX1dte Sold $SPX Feb 1st 2630/2650-2745/2765 iron condors for 1.00. (IV 15.35%; SPX 2703)
DECK earnings analysis
#Earnings $DECK reports tonight. Below are details on earnings one-day moves over the last 12 quarters.
Oct. 25, 2018 AC +6.18%
July 26, 2018 AC -6.87%
May 24, 2018 AC +3.54%
Feb. 1, 2018 AC +7.30%
Oct. 26, 2017 AC +3.32%
July 27, 2017 AC +1.59%
May 25, 2017 AC +18.80% Biggest UP
Feb. 2, 2017 AC -16.06% Biggest DOWN
Oct. 27, 2016 AC +7.11%
July 28, 2016 AC +4.06%
May 26, 2016 AC +7.99%
Feb. 4, 2016 AC -1.96%
Avg (+ or -) 7.07%
Bias 2.92%, positive bias on earnings.
With stock at 125.50 the data suggests these ranges:
Based on current IV (expected move into Friday per TOS): 112.87 to 138.13
Based on AVERAGE move over last 12 quarters: 116.63 to 134.37
Based on MAXIMUM move over last 12 Q’s (18.8%): 101.91 to 149.09
Open for requests on other symbols.
Double Calendar Candidates
#Earnings #DoubleCalendar These stocks all have fairly muted historical moves but decent IV elevation for earnings: $CI, $CVX, $HON, $MRK. Also, $EW was my biggest winner in this strategy last quarter. It opened nearly flat and allowed for perfect exit. Then the stock dropped 5%. So its moves are a bit large for a calendar but it worked out, so I may try again.
EW earnings analysis
#Earnings $EW reports tonight. Below are details on earnings one-day moves over the last 12 quarters.
Oct. 23, 2018 AC -5.35%
July 26, 2018 AC -8.50%
April 24, 2018 AC -3.82%
Feb. 1, 2018 AC +3.81%
Oct. 24, 2017 AC -9.55%
July 26, 2017 AC +0.64%
April 25, 2017 AC +10.49% Biggest UP
Feb. 1, 2017 AC -8.45%
Oct. 25, 2016 AC -17.09% Biggest DOWN
July 26, 2016 AC +5.62%
April 26, 2016 AC +0.08%
Feb. 2, 2016 AC +8.33%
Avg (+ or -) 6.81%
Bias -1.98%, negative bias on earnings.
With stock at 170.00 the data suggests these ranges:
Based on current IV (expected move into Friday per TOS): 161.14 to 178.86
Based on AVERAGE move over last 12 quarters: 158.42 to 181.58
Based on MAXIMUM move over last 12 Q’s (17.1%): 140.95 to 199.05
Open for requests on other symbols.
AMZN earnings analysis
#Earnings $AMZN reports tonight. Below are details on earnings one-day moves over the last 12 quarters.
Oct. 25, 2018 AC -7.81% Biggest DOWN
July 26, 2018 AC +0.51%
April 26, 2018 AC +3.60%
Feb. 1, 2018 AC +2.87%
Oct. 26, 2017 AC +13.21% Biggest UP
July 27, 2017 AC -2.48%
April 27, 2017 AC +0.71%
Feb. 2, 2017 AC -3.54%
Oct. 27, 2016 AC -5.13%
July 28, 2016 AC +0.82%
April 28, 2016 AC +9.56%
Jan. 28, 2016 AC -7.60%
Avg (+ or -) 4.82%
Bias 0.39%, small positive bias on earnings.
With stock at 1732.00 the data suggests these ranges:
Based on current IV (expected move into Friday per TOS): 1639.50 to 1824.50
Based on AVERAGE move over last 12 quarters: 1648.52 to 1815.48
Based on MAXIMUM move over last 12 Q’s (13.2%): 1503.20 to 1960.80
Open for requests on other symbols.
SPX 1-dte closed
#SPX1dte Closed both shorts for .05 each. Looks good to expire but this clears needed margin from smaller accounts. $SPX Jan 31st 2615/2635/2735/2755 condors sold yesterday for 1.00
SPX 1-dte trades
#SPX1dte Sold $SPX Jan 31st 2615/2635-2735/2755 iron condors for 1.00. (IV 16%)
I hated doing this because I feel the rally today is a headfake, but I cannot fight the tape any higher than this.
Bought to close $SPX Feb 14th 2730/2750 call spreads for 5.75. Sold in a #CondorRoll on Jan 4th.
#CondorRoll Sold to Open Feb 14th 2600/2620/2760/2780 condors for 6.05.
TQQQ calls
#LongLEAPs #SyntheticCoveredCalls
Filled on the Fed spike: Sold $TQQQ Feb 15th 44 calls for 2.45
SPX 1-dte closing
#SPX1dte bought to close $SPX Jan 30th 2685 calls for .85. Condors sold for 1.00 yesterday. Could not hold through the FOMC release that comes out in 40 minutes. I don’t expect a move like last time, when we exploded higher, but can’t risk it. Also sold a couple the long 2705 calls for .05, and will try to sell them all to reduce cost of the exit. Allowing puts to expire.
Don’t know whether I’ll buy or sell the condor for Jan 31st expiration yet!
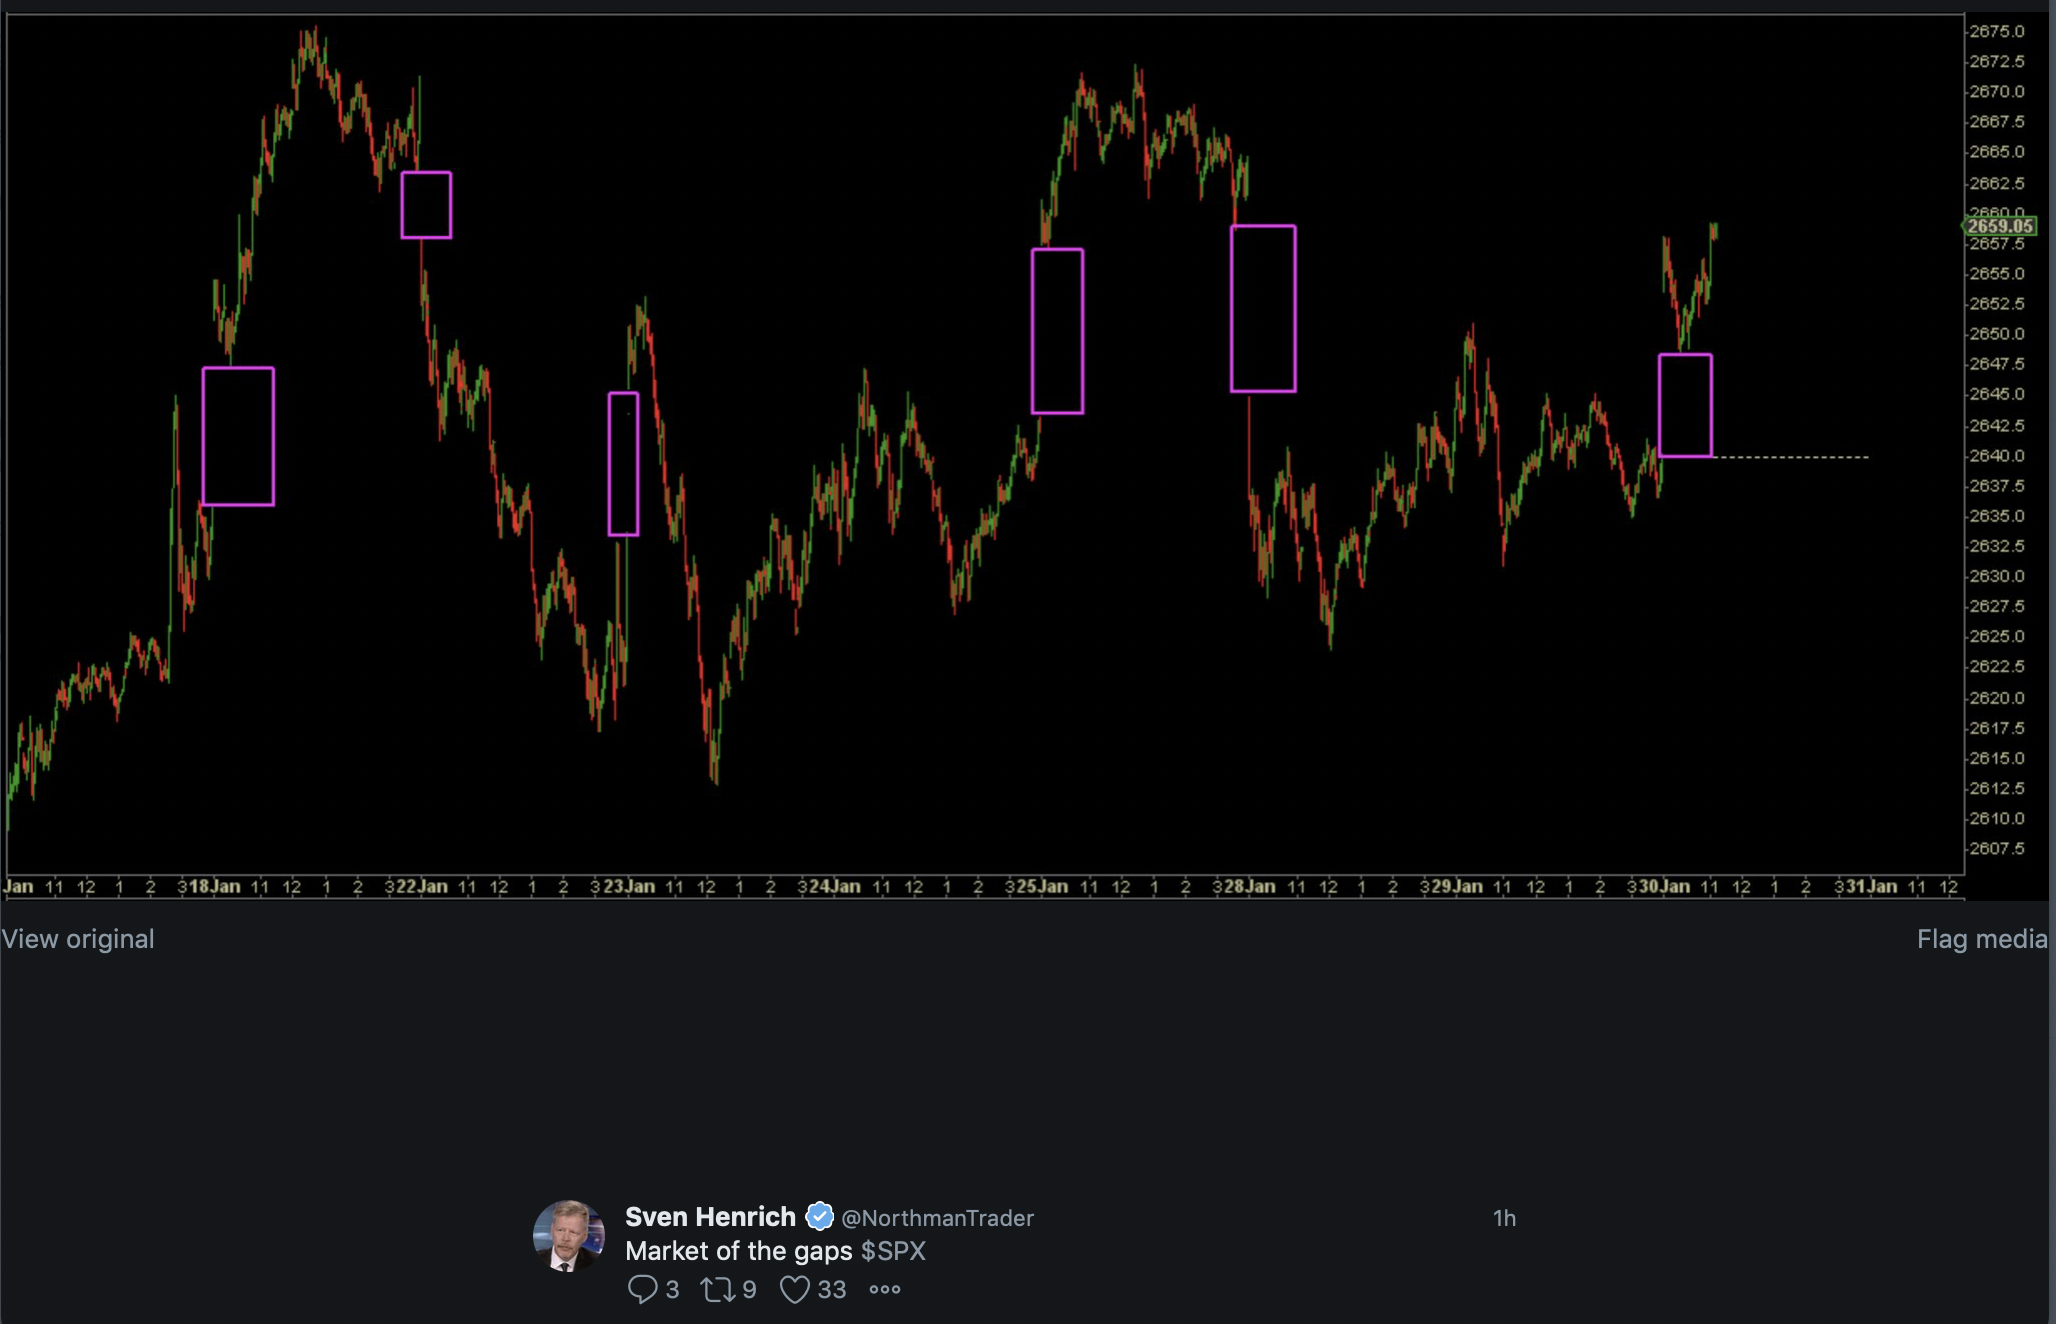
SPX — Market of the Gaps
MSFT earnings analysis
#Earnings $MSFT reports tonight. Below are details on earnings one-day moves over the last 12 quarters.
Oct. 24, 2018 AC +5.84%
July 19, 2018 AC +1.79%
April 26, 2018 AC +1.65%
Jan. 31, 2018 AC -0.78%
Oct. 26, 2017 AC +6.41% Biggest UP
July 20, 2017 AC -0.57%
April 27, 2017 AC +0.27%
Jan. 26, 2017 AC +2.34%
Oct. 20, 2016 AC +4.20%
July 19, 2016 AC +5.31%
April 21, 2016 AC -7.17% Biggest DOWN
Jan. 28, 2016 AC +5.82%
Avg (+ or -) 3.51%
Bias 2.09%, strong positive bias on earnings.
With stock at 105.90 the data suggests these ranges:
Based on current IV (expected move into Friday per TOS): 101.22 to 110.58
Based on AVERAGE move over last 12 quarters: 102.18 to 109.62
Based on MAXIMUM move over last 12 Q’s (7.2%): 98.31 to 113.49
Open for requests on other symbols.
NOW iron butterfly
Sold to open $NOW Feb 1st 185/190/195 iron butterflys for 4.35. Max risk .65. As I reported below, this one has been more of a minor mover in recent years, so seeing if it can maintain its calm. If not, max loss is tolerable.
Long Straddles
#LongStraddle #Earnings
Sold to Close final batch of $GLW Feb 1st 30 calls for 3.27. Netted about 60% profit (bought for 1.92 on Monday).
Sold to close some of the $EBAY Feb 1st 33.5 puts for .61. Straddles bought yesterday for 2.23. This one will be tough to breakeven, unless we get a rally over next couple days.
CRUS earnings analysis
#Earnings $CRUS reports tomorrow morning. Below are details on earnings one-day moves over the last 12 quarters.
Nov. 1, 2018 AC +3.10%
Aug. 1, 2018 AC -7.01%
May 2, 2018 AC -1.53%
Feb. 5, 2018 AC -3.31%
Nov. 2, 2017 AC -0.42%
Aug. 2, 2017 AC -6.89%
May 3, 2017 AC +0.10%
Feb. 1, 2017 AC -14.00% Biggest DOWN
Oct. 27, 2016 AC +6.85%
July 27, 2016 AC +19.27% Biggest UP
April 26, 2016 AC +12.38%
Jan. 27, 2016 AC +16.38%
Avg (+ or -) 7.60%
Bias 2.08%, positive bias on earnings.
With stock at 38.00 the data suggests these ranges:
Based on current IV (expected move into Friday per TOS): 35.03 to 40.97
Based on AVERAGE move over last 12 quarters: 35.11 to 40.89
Based on MAXIMUM move over last 12 Q’s (19.3%): 30.68 to 45.32
Open for requests on other symbols.
Covered Calls
#CoveredCalls #LongStock Sold to Open $PVTL Feb 15th 18 calls for .75
NOW earnings analysis
#Earnings $NOW reports tonight. Below are details on earnings one-day moves over the last 12 quarters.
Oct. 24, 2018 AC +1.42%
July 25, 2018 AC +4.60%
April 25, 2018 AC +4.53%
Jan. 31, 2018 AC +2.64%
Oct. 25, 2017 AC +1.21%
July 26, 2017 AC +0.74%
April 26, 2017 AC +3.75%
Jan. 25, 2017 AC +3.61%
Oct. 26, 2016 AC +7.68%
July 27, 2016 AC +4.65%
April 20, 2016 AC +14.06% Biggest UP
Jan. 27, 2016 AC -15.65% Biggest DOWN (the only DOWN)
Avg (+ or -) 5.38%
Bias 2.77%, strong positive bias on earnings.
With stock at 189.90 the data suggests these ranges:
Based on current IV (expected move into Friday per TOS): 117.65 to 202.15
Based on AVERAGE move over last 12 quarters: 179.69 to 200.11
Based on MAXIMUM move over last 12 Q’s (15.7%): 160.18 to 219.62
Open for requests on other symbols.
WYNN earnings analysis
#Earnings $WYNN reports tonight. Below are details on earnings one-day moves over the last 12 quarters.
Nov. 7, 2018 AC -13.13% Biggest DOWN
Aug. 1, 2018 AC -6.53%
April 24, 2018 AC -3.74%
Jan. 22, 2018 BO +8.67%
Oct. 26, 2017 AC -1.50%
July 25, 2017 AC -5.02%
April 25, 2017 AC +5.89%
Jan. 26, 2017 AC +7.93%
Nov. 2, 2016 AC -9.31%
July 28, 2016 AC -6.41%
May 5, 2016 AC +1.77%
Feb. 11, 2016 AC +15.83% Biggest UP
Avg (+ or -) 7.14%
Bias -0.46%, slight negative bias on earnings.
With stock at 117.50 the data suggests these ranges:
Based on current IV (expected move into Friday per TOS): 109.04 to 125.96
Based on AVERAGE move over last 12 quarters: 109.11 to 125.89
Based on MAXIMUM move over last 12 Q’s (15.8%): 98.90 to 136.10
Open for requests on other symbols.
FB earnings analysis
#Earnings $FB reports tonight. Below are details on earnings one-day moves over the last 12 quarters.
Oct. 30, 2018 AC +3.80%
July 25, 2018 AC -18.96% Biggest DOWN
April 25, 2018 AC +9.06%
Jan. 31, 2018 AC +3.31%
Nov. 1, 2017 AC -2.04%
July 26, 2017 AC +2.91%
May 3, 2017 AC -0.62%
Feb. 1, 2017 AC -1.79%
Nov. 2, 2016 AC -5.63%
July 27, 2016 AC +1.34%
April 27, 2016 AC +7.19%
Jan. 27, 2016 AC +15.52% Biggest UP
Avg (+ or -) 6.01%
Bias 1.17%, positive bias on earnings.
With stock at 146.00 the data suggests these ranges:
Based on current IV (expected move into Friday per TOS): 136.11 to 155.89
Based on AVERAGE move over last 12 quarters: 137.22 to 154.78
Based on MAXIMUM move over last 12 Q’s (19.0%): 118.32 to 173.68
Open for requests on other symbols.
Events Wednesday
#Market Reminders for tomorrow:
GDP numbers at 8:30am ET
FOMC Meeting Announcement at 2pm ET
SPX 1-dte, short
#SPX1dte Sold to Open $SPX Jan 30th 2565/2585/2685/2705 iron condors for 1.00
I switched back to selling because IV on this chain is over 16% and HV dipped below IV.

