

#Earnings #DoubleCalendar Closed first batch of $VMX Mar01/Mar08 dbl cals for 2.90. Bought yesterday for 1.30. These higher priced stocks always produce the bigger profits. This winner will easily overtake the small losses in MNST and BUD for the week.
Author Archives: Jeff
Earnings trades
#Earnings Sold to close $BUD 75 call calendar for .07. This one moved farther up today, so profit’s not possible. Closed the call side to avoid assignment.
$MNST I’ll get a small profit out of the 62 calendar, but not moving down enough to make the ATM 58 #DoubleCalendar work. Will be closing the call side to avoid assignment, but will wait until later in case we get a drop.
$VMW This one moved up, but should still turn a small profit.
$SPLK #BrokenWingButterfly Looking for this to rise into the close so I can take profit. It passed through my center strike in the morning but volatility was too wild to close with enough profit.
SPY sales
#LongCalls Sold to close $SPY March 8th 277.5 long calls for 4.00. Bought for 1.72. Still holding one last batch.
VMW earnings analysis
#Earnings — $VMW reports tonight. Below are details on earnings one-day moves over the last 12 quarters.
Nov. 29, 2018 AC +3.62%
Aug. 23, 2018 AC -2.19%
May 31, 2018 AC +6.14%
March 1, 2018 AC -5.91%
Nov. 30, 2017 AC +3.60%
Aug. 24, 2017 AC +1.89%
June 1, 2017 AC -2.09%
Jan. 26, 2017 AC +3.49%
Oct. 26, 2016 AC +3.35%
July 18, 2016 AC +9.04%
April 19, 2016 AC +13.73% Biggest UP
Jan. 26, 2016 AC -9.82% Biggest DOWN
Avg (+ or -) 5.41%
Bias 2.07%, strong positive bias on earnings.
With stock at 173.00 the data suggests these ranges:
Based on current IV (expected move into Friday per TOS): 163.23 to 182.77
Based on AVERAGE move over last 12 quarters: 163.65 to 182.35
Based on MAXIMUM move over last 12 Q’s (13.7%): 149.25 to 196.75
Open to requests for other symbols.
SPX 1-dte
#SPX1dte Sold to Open $SPX March 1st 2740/2760-2810/2830 condors for 1.10. Going a bit aggressive with .08 deltas on the shorts… Fridays have been mellow lately. (IV: 9.5%, SPX 2787)
Expiring: Feb 28th condors, sold yesterday for .80.
SPLK trade
#Earnings #BrokenWingButterfly This trade worked last quarter, and with positive bias in $SPLK I like it. Still, the stock is a bit extended so I see it as riskier than last quarter.
Bought $SPLK March 1st 137/142/145 Broken wing CALL butterfly for 1.20. buy (1) 137, sell (2) 142, buy (1) 145
(stock at 137.00 at time of trade)
Trade has no upside risk. Max loss, debit paid (1.20). Max gain: 3.80 (if pin at 142). Capped gain: .80 if above 145. Goal will be to close for profit during the day when price passes through the 142 area. If it explodes higher or gaps lower, trade can be ignored for exercise to cancel out (or, if above 145, close all to avoid exercise fees). BUT if price ends day between 137 and 145, you WILL BE ASSIGNED if you don’t close the necessary options. I can help if you follow this trade.
FL earnings analysis
#Earnings — $FL reports tonight. Below are details on earnings one-day moves over the last 12 quarters.
Nov. 20, 2018 AC +14.90%
Aug. 24, 2018 BO -9.17%
May 25, 2018 BO +20.15%
March 2, 2018 BO -12.72%
Nov. 17, 2017 BO +28.16% Biggest UP
Aug. 18, 2017 BO -27.92% Biggest DOWN
May 19, 2017 BO -16.65%
Feb. 24, 2017 BO +9.37%
Nov. 18, 2016 BO +0.60%
Aug. 19, 2016 BO +11.04%
May 20, 2016 BO -6.45%
Feb. 26, 2016 BO -4.31%
Avg (+ or -) 13.45%
Bias 0.58%, small positive bias on earnings.
With stock at 58.50 the data suggests these ranges:
Based on current IV (expected move into Friday per TOS): 52.30 to 64.70
Based on AVERAGE move over last 12 quarters: 50.63 to 66.37
Based on MAXIMUM move over last 12 Q’s (17.9%): 42.03 to 74.97
Open to requests for other symbols.
SPLK earnings analysis
#Earnings — $SPLK reports tonight. Below are details on earnings one-day moves over the last 12 quarters.
Nov. 29, 2018 AC +9.93%
Aug. 23, 2018 AC +14.81%
May 24, 2018 AC -5.20%
March 1, 2018 AC +9.26%
Nov. 16, 2017 AC +17.89% Biggest UP
Aug. 24, 2017 AC +8.47%
May 25, 2017 AC -6.97%
Feb. 23, 2017 AC -3.23%
Nov. 29, 2016 AC +0.41%
Aug. 25, 2016 AC -10.10% Biggest DOWN
May 26, 2016 AC +2.56%
Feb. 25, 2016 AC +7.73%
Avg (+ or -) 8.05%
Bias 3.80%, strong positive bias on earnings.
With stock at 138.00 the data suggests these ranges:
Based on current IV (expected move into Friday per TOS): 126.42 to 149.58
Based on AVERAGE move over last 12 quarters: 126.90 to 149.10
Based on MAXIMUM move over last 12 Q’s (17.9%): 113.31 to 162.69
Open to requests for other symbols.
SQ calls, earnings
#Earnings #LongLEAPs #SyntheticCoveredCalls
Sold $SQ March 1st 85 calls for 1.08. Against my 2020 110 long call LEAPs.
SPX 1-dte
#SPX1dte Sold to Open $SPX Feb 28th 2735/2755-2820/2835 condors for .80. (IV 10.1%, SPX 2794)
BUD trade and earnings analysis
#Earnings — Bought to open $BUD Mar01/Mar08 75 #DoubleCalendar for .48. Looking at the daily chart, BUD is not the king of big moves. I’ve said it all.
$BUD reports tomorrow morning. Below are details on earnings one-day moves over the last 12 quarters.
Oct. 25, 2018 BO -9.37% Biggest DOWN
July 26, 2018 BO -5.02%
May 9, 2018 BO -0.31%
March 1, 2018 BO +3.07%
Oct. 26, 2017 BO -0.94%
July 27, 2017 BO +6.16% Biggest UP
May 4, 2017 BO +5.68%
March 2, 2017 BO -3.72%
Oct. 28, 2016 BO -3.80%
July 29, 2016 BO +2.79%
May 4, 2016 BO -2.98%
Feb. 25, 2016 BO -2.38%
Avg (+ or -) 3.85%
Bias -0.90%, negative bias on earnings.
With stock at 75.00 the data suggests these ranges:
Based on current IV (expected move into Friday per TOS): 71.07 to 78.93
Based on AVERAGE move over last 12 quarters: 72.11 to 77.89
Based on MAXIMUM move over last 12 Q’s (9.4%): 67.97 to 82.03
Open to requests for other symbols.
MNST trade and earnings analysis
#Earnings — Bought to open $MNST Mar01/Mar08 58 #DoubleCalendar for .23, .246, and .25.
$MNST reports tonight. Below are details on earnings one-day moves over the last 12 quarters.
Nov. 7, 2018 AC -3.16%
Aug. 8, 2018 AC +2.65%
May 8, 2018 AC -7.47%
Feb. 28, 2018 AC -14.43% Biggest DOWN
Nov. 8, 2017 AC +1.17%
Aug. 8, 2017 AC -1.14%
May 4, 2017 AC +3.30%
March 1, 2017 AC +12.75% Biggest UP
Nov. 3, 2016 AC -3.55%
Aug. 4, 2016 AC +2.47%
April 29, 2016 BO +12.81%
Feb. 25, 2016 AC -1.74%
Avg (+ or -) 5.55%
Bias 0.31%, small positive bias on earnings.
With stock at 58.00 the data suggests these ranges:
Based on current IV (expected move into Friday per TOS): 54.07 to 61.93
Based on AVERAGE move over last 12 quarters: 54.78 to 61.22
Based on MAXIMUM move over last 12 Q’s (14.1%): 49.63 to 66.37
Open to requests for other symbols.
SPX 1-dte
#SPX1dte Closed $SPX Feb 27th 2755/2735 put spreads for .20. Would have allowed to expire but I have to be away from my desk for a time today. Order in to close the 2820 short calls for .05. Condors sold yesterday for 1.10.
SQ earnings analysis
#Earnings — $SQ reports tonight. Below are details on earnings one-day moves over the last 12 quarters.
Nov. 7, 2018 AC +8.48%
Aug. 8, 2018 AC -11.38%
May 7, 2018 AC +7.84%
Feb. 21, 2018 AC -27.23% Biggest DOWN
Nov. 1, 2017 AC -20.10%
Aug. 2, 2017 AC -1.08%
May 10, 2017 AC +5.58%
Feb. 22, 2017 AC -18.13%
Nov. 4, 2015 AC +9.99%
Aug. 5, 2015 AC +10.00% Biggest UP
May 6, 2015 AC -7.90%
Feb. 26, 2015 AC -6.34%
Avg (+ or -) 11.17%
Bias -4.19%, negative bias on earnings.
With stock at 78.50 the data suggests these ranges:
Based on current IV (expected move into Friday per TOS): 72.38 to 84.62
Based on AVERAGE move over last 12 quarters: 69.73 to 87.27
Based on MAXIMUM move over last 12 Q’s (27.2%): 57.12 to 99.88
Open to requests for other symbols.
AZO closed
#Earnings #IronCondor Bougtht to close $AZO March 1st 940/945 call spreads for .35. Leaving put spread to expire or shorts to close for .05. Condor sold for 2.30 on Monday.
SPX 1-dte
#SPX1dte Sold to Open $SPX 2735/2755-2820/2835 condors for 1.10. (IV: 10.67%, SPX 2796)
PANW earnings analysis
#Earnings — $PANW reports tonight. Below are details on earnings one-day moves over the last 12 quarters.
Nov. 29, 2018 AC -1.76%
Sept. 6, 2018 AC +3.28%
June 4, 2018 BO -0.52%
Feb. 26, 2018 AC +2.31%
Nov. 20, 2017 AC +4.82%
Aug. 31, 2017 AC +10.53%
May 31, 2017 AC +17.20% Biggest UP
Feb. 28, 2017 AC -24.15% Biggest DOWN
Nov. 21, 2016 AC -13.24%
Aug. 30, 2016 AC -7.16%
May 26, 2016 AC -12.36%
Feb. 25, 2016 AC +5.20%
Avg (+ or -) 8.54%
Bias -1.32%, negative bias on earnings.
With stock at 233.00 the data suggests these ranges:
Based on current IV (expected move into Friday per TOS): 217.69 to 248.31
Based on AVERAGE move over last 12 quarters: 213.09 to 252.91
Based on MAXIMUM move over last 12 Q’s (24.2%): 176.73 to 289.27
Open to requests for other symbols.
EOG earnings analysis
#Earnings — $EOG reports tomorrow morning. Below are details on earnings one-day moves over the last 12 quarters.
Nov. 2, 2018 BO -4.24%
Aug. 3, 2018 BO -2.79%
May 3, 2018 AC -1.16%
Feb. 28, 2018 BO -5.16% Biggest DOWN
Nov. 3, 2017 BO +1.50%
Aug. 2, 2017 BO -2.26%
May 8, 2017 AC -0.05%
Feb. 27, 2017 AC -0.93%
Nov. 3, 2016 AC -0.30%
Aug. 4, 2016 AC +7.02% Biggest UP
May 5, 2016 AC -3.17%
Feb. 25, 2016 AC -1.45%
Avg (+ or -) 2.50%
Bias -1.08%, negative bias on earnings.
With stock at 94.50 the data suggests these ranges:
Based on current IV (expected move into Friday per TOS): 90.14 to 98.86
Based on AVERAGE move over last 12 quarters: 92.14 to 96.86
Based on MAXIMUM move over last 12 Q’s (7.0%): 87.87 to 101.13
Open to requests for other symbols.
SPX 4-dte
#SPX1dte As a roll from the stopped spread today: Sold $SPX March 1st 2715/2740/2845/2870 condors for 2.40. If possible I will close with 60% of profit a day or two early. (.10 delta, 12.5% IV, SpX 2801)
SPX 1-dte stopped
#SPX1dte Bought to close $SPX Feb 25th 2815 calls for 2.75. Holding the longs to sell if we go higher.
This is my first loss on a short 1-dte since Jan 22nd. And again, losses are about 1x-3x the wins, so not difficult to make up.
More SPY sold
#LongCalls Sold $SPY Mar 8th 277.5 calls for 4.95. Bought for 1.72, avg price. Still holding more.
SHAK earnings analysis
#Earnings — $SHAK reports tonight. Below are details on earnings one-day moves over the last 12 quarters. (5-day results had HIGHER extremes, meaning stock often continues in same direction after first day).
Nov. 1, 2018 AC -13.88% Biggest DOWN
Aug. 2, 2018 AC -11.88%
May 3, 2018 AC +18.01% Biggest UP
Feb. 15, 2018 AC -7.71%
Nov. 1, 2017 AC -3.36%
Aug. 3, 2017 AC -5.45%
May 4, 2017 AC +9.20%
March 1, 2017 AC -2.63%
Nov. 9, 2016 AC +10.67%
Aug. 10, 2016 AC -6.19%
May 12, 2016 AC +9.74%
March 7, 2016 AC -11.83%
Avg (+ or -) 9.21%
Bias -1.28%, negative bias on earnings.
With stock at 53.00 the data suggests these ranges:
Based on current IV (expected move into Friday per TOS): 47.81 to 58.19
Based on AVERAGE move over last 12 quarters: 48.12 to 57.88
Based on MAXIMUM move over last 12 Q’s (18.0%): 43.45 to 62.55
Open to requests for other symbols.
M earnings analysis
#Earnings — $M reports tomorrow morning. Below are details on earnings one-day moves over the last 12 quarters. (5-day results had roughly the same extremes).
Nov. 14, 2018 BO -7.18%
Aug. 15, 2018 BO -15.94%
May 16, 2018 BO +10.82%
Feb. 27, 2018 BO +3.46%
Nov. 9, 2017 BO +10.98%
Aug. 10, 2017 BO -10.24%
May 11, 2017 BO -17.00% Biggest DOWN
Feb. 21, 2017 BO -0.03%
Nov. 10, 2016 BO +5.60%
Aug. 11, 2016 BO +17.08% Biggest UP
May 11, 2016 BO -15.16%
Feb. 23, 2016 BO +3.04%
Avg (+ or -) 9.71%
Bias -1.21%, negative bias on earnings.
With stock at 24.70 the data suggests these ranges:
Based on current IV (expected move into Friday per TOS): 22.22 to 27.18
Based on AVERAGE move over last 12 quarters: 22.30 to 27.10
Based on MAXIMUM move over last 12 Q’s (17.1%): 20.48 to 28.92
Open to requests for other symbols.
AZO trade
#Earnings Sold $AZO March 1st 855/860-940/945 condors for 2.30. Fairly close to 1:1 R/R, but only at the average historical move, so definitely risky.
AZO earnings analysis
#Earnings — $AZO reports tomorrow morning. Below are details on earnings one-day moves over the last 12 quarters. (5-day results were actually less extreme, meaning extreme moves were faded after first day).
Dec. 4, 2018 BO +6.74% Biggest UP
Sept. 18, 2018 BO -1.97%
May 22, 2018 BO -9.48%
Feb. 27, 2018 BO -11.06%
Dec. 5, 2017 BO +0.42%
Sept. 19, 2017 BO -5.00%
May 23, 2017 BO -11.84% Biggest DOWN
Feb. 28, 2017 BO -0.58%
Dec. 6, 2016 BO +0.43%
Sept. 22, 2016 BO -0.42%
May 24, 2016 BO +2.47%
March 1, 2016 BO +2.06%
Avg (+ or -) 4.37%
Bias -2.35%, negative bias on earnings (1-day), but 5-day results show no bias… extreme negative moves were faded over the following days.
With stock at 900.00 the data suggests these ranges:
Based on current IV (expected move into Friday per TOS): 853.07 to 946.93
Based on AVERAGE move over last 12 quarters: 860.65 to 939.35
Based on MAXIMUM move over last 12 Q’s (11.8%): 793.44 to 1,006.56
Open to requests for other symbols.
SPX 1-dte
#SPX1dte Sold to Open $SPX Feb 25th 2735/2755-2815/2830 condors for 1.05. (IV: 7.3%, SPX 2788)
Expiring today: Feb 22nd condor, sold yesterday for .90
Econ Calendar for week of 2/25/18
Jerome Powell speaks Tuesday and Wednesday
GDP report Thursday
#Jobs report will be released the following week, on Friday, March 8th


Link to calendar: https://us.econoday.com/byweek.asp?day=1&month=3&year=2019&cust=us&lid=0
HLF closed
#Earnings Sold to close $HLF Feb22/Mar01 57.5 #DoubleCalendar for .78. Bought for .45 on Tuesday. Price started fading from its highs so I don’t think we’re making it up to 57.50 today.
I’m waiting on $AAOI until the bitter end. Looks like we may get a 14.50 pin.
TQQQ calls
#LongLEAPs #SyntheticCoveredCalls
Sold to Open $TQQQ March 8th 50 calls for 2.15. Replacing the ones I closed yesterday.
SPY calls
#LongCalls Starting to sell $SPY March 8th 277.5 calls, bought for 1.73 avg price. Sold some for 3.30 today.
FLR closed
#Earnings Sold to close $FLR #DoubleCalendar for .77. Bought for .44 yesterday. Stock is starting to rally so closed before it got away from me.
STMPed out
Stamps .com @STMP gapped down 54% on earnings at the open this AM. Since 2001, just 11 other stocks have gapped down 50%+ on earnings out of ~150,000 reports. A 0.007% event. Here's the list from our Earnings Screener: https://t.co/vFFMKBVnKu pic.twitter.com/u8ZXsv9G3C
— Bespoke (@bespokeinvest) February 22, 2019
TQQQ calls
#LongLEAPs #SyntheticCoveredCalls
Bought to close $TQQQ Feb 22nd 48 calls for 1.70. Sold for 2.20 on Feb 12th. Will sell more tomorrow.
Dub Cals
Bought $AAOI Feb22/Mar01 14.5 dbl cals for .27
Bought $FLR Feb22/Mar01 38 dbl cals for .45
SPX 1-dte
#SPX1dte Sold to Open $SPX Feb 22nd 2725/2745-2805/2825 condors for .90. (IV: 10.17%, SPX 2774)
Z earnings analysis
#Earnings — $Z reports tonight. Below are details on earnings one-day moves over the last 12 quarters.
Nov. 6, 2018 AC -26.92% Biggest DOWN
Aug. 6, 2018 AC -14.77%
May 7, 2018 AC -1.44%
Feb. 8, 2018 AC -2.67%
Nov. 7, 2017 AC +2.67%
Aug. 8, 2017 AC -9.05%
May 4, 2017 AC +9.29%
Feb. 7, 2017 AC -6.37%
Nov. 1, 2016 AC +6.32%
Aug. 4, 2016 AC -4.73%
May 3, 2016 AC +12.05% Biggest UP
Feb. 11, 2016 AC -0.89%
Avg (+ or -) 8.10%
Bias -3.04%, negative bias on earnings.
With stock at 34.20 the data suggests these ranges:
Based on current IV (expected move into Friday per TOS): 30.28 to 38.12
Based on AVERAGE move over last 12 quarters: 31.43 to 36.97
Based on MAXIMUM move over last 12 Q’s (26.9%): 24.99 to 43.41
Open to requests for other symbols.
ROKU earnings analysis
#Earnings — $ROKU reports tonight. Below are details on earnings one-day moves over its entire history.
Nov. 7, 2018 AC -22.29% Biggest DOWN
Aug. 8, 2018 AC +21.31%
May 9, 2018 AC -1.71%
Feb. 21, 2018 AC -17.71%
Nov. 8, 2017 AC +54.93% Biggest UP
Avg (+ or -) 23.59%
Bias 6.91%, positive bias on earnings.
With stock at 52.00 the data suggests these ranges:
Based on current IV (expected move into Friday per TOS): 44.88 to 59.12
Based on AVERAGE move over last 12 quarters: 39.73 to 64.27
Based on MAXIMUM move over last 12 Q’s (54.9%): 23.44 to 80.56
Open to requests for other symbols.
BIDU earnings analysis
#Earnings — $BIDU reports tonight. Below are details on earnings one-day moves over the last 12 quarters.
Oct. 30, 2018 AC +3.64%
July 31, 2018 AC -7.73%
April 26, 2018 AC +5.54%
Feb. 13, 2018 AC +4.56%
Oct. 26, 2017 AC -8.15% Biggest DOWN
July 27, 2017 AC +9.45%
April 27, 2017 AC -4.06%
Feb. 23, 2017 AC -5.12%
Oct. 27, 2016 AC +2.56%
July 28, 2016 AC -3.64%
April 28, 2016 AC +4.45%
Feb. 25, 2016 AC +9.84% Biggest UP
Avg (+ or -) 5.73%
Bias 0.95%, positive bias on earnings.
With stock at 171.00 the data suggests these ranges:
Based on current IV (expected move into Friday per TOS): 161.90 to 180.10
Based on AVERAGE move over last 12 quarters: 161.20 to 180.80
Based on MAXIMUM move over last 12 Q’s (9.8%): 154.17 to 187.83
Open to requests for other symbols.
OLED earnings analysis
#Earnings — $OLED reports tonight. Below are details on earnings one-day moves over the last 12 quarters.
Nov. 1, 2018 AC -20.50% Biggest DOWN
Aug. 9, 2018 AC +13.54%
May 3, 2018 AC +12.43%
Feb. 22, 2018 AC -15.81%
Nov. 2, 2017 AC +9.52%
Aug. 3, 2017 AC -1.30%
May 4, 2017 AC +23.87% Biggest UP
Feb. 23, 2017 AC +20.08%
Nov. 3, 2016 AC +2.98%
Aug. 4, 2016 AC -8.01%
May 5, 2016 AC -0.76%
Feb. 25, 2016 AC -11.45%
Avg (+ or -) 11.69%
Bias 2.05%, positive bias on earnings.
With stock at 117.50 the data suggests these ranges:
Based on current IV (expected move into Friday per TOS): 105.41 to 129.59
Based on AVERAGE move over last 12 quarters: 103.77 to 131.23
Based on MAXIMUM move over last 12 Q’s (23.9%): 89.45 to 145.55
Open to requests for other symbols.
SPX 44-dte
#SPX1dte Selling a longer-term to make up for today’s loss and also for the helluvit.
Sold to Open $SPX April 5th 2525/2550/2925/2950 condors for 2.60. (IV 14.54%, SPX 2785)
SQ calls closed
#LongLEAPs #SyntheticCoveredCalls Bougt to close $SQ Feb 22nd 77 calls for .50. Sold for 2.05 last Wednesday
Exiting NTAP
#Earnings #LongStock #Assignment #DoubleCalendar
Sold half of my stock for 65.00 and 65.45. Assigned via 68 puts last week… cost basis 64.79. Looking to unload all of it; no interest in making this a longer term holding.
NTES earnings analysis
#Earnings — $NTES reports tonight. Below are details on earnings one-day moves over the last 12 quarters.
Nov. 14, 2018 AC +5.31%
Aug. 8, 2018 AC -10.96%
May 16, 2018 AC -7.45%
Feb. 7, 2018 AC -6.27%
Nov. 15, 2017 AC +7.85%
Aug. 9, 2017 AC -9.77%
May 10, 2017 AC -0.82%
Feb. 15, 2017 AC +14.08% Biggest UP
Nov. 9, 2016 AC -9.22%
Aug. 17, 2016 AC -2.67%
May 11, 2016 AC +0.43%
Feb. 24, 2016 AC -14.80% Biggest DOWN
Avg (+ or -) 7.47%
Bias -2.86%, negative bias on earnings.
With stock at 234.00 the data suggests these ranges:
Based on current IV (expected move into Friday per TOS): 216.53 to 251.47
Based on AVERAGE move over last 12 quarters: 216.52 to 251.48
Based on MAXIMUM move over last 12 Q’s (14.8%): 199.37 to 268.63
Open to requests for other symbols.
FOMC minutes today
2pm ET
HLF dub cal
#Earnings Bought to Open $HLF Feb22/Mar01 57.5 #DoubleCalendar for .45. (Got it for .42 in a TOS account)
SPX 1-dte LONG
#SPX1dte Premium just too low to sell, so I chose long today.
Bought to Open $SPX Feb 20th 2735/2750-2815/2820 condors for .50. (IV 9.56%, SPX 2786)
15-wide on put side and only 5-wide on call side. Not too far OTM so any reasonable move toward these should give me at least a small profit… but not expecting much!
HLF earnings analysis
#Earnings — $HLF reports tonight. Below are details on earnings one-day moves over the last 12 quarters.
Tue 10/30/2018 AC -2.61%
Wed 08/01/2018 AC +13.03%
Thu 05/03/2018 AC +4.47%
Thu 02/22/2018 AC +3.00%
Thu 11/02/2017 AC -2.92%
Tue 08/01/2017 AC -1.95%
Thu 05/04/2017 AC +11.57%
Thu 02/23/2017 AC -4.51%
Tue 11/01/2016 AC -6.19% Biggest DOWN
Wed 08/03/2016 AC +0.74%
Thu 05/05/2016 AC +9.08%
Thu 02/25/2016 AC +20.52% Biggest UP
Avg (+ or -) 6.72%
Bias 3.69%, strong positive bias on earnings.
With stock at 99.30 the data suggests these ranges:
Based on current IV (expected move into Friday per TOS): 53.81 to 61.19
Based on AVERAGE move over last 12 quarters: 53.64 to 61.36
Based on MAXIMUM move over last 12 Q’s (20.5%): 45.70 to 69.30
Open to requests for other symbols.
NUGT calls
#ContangoETFs $NUGT peeking above its recent highs. Sold June 30 calls for 1.35.
Final Trades and Expirations
#Earnings Sold to close $UAA Feb 15th 21 calls for .16. This was a sad one; bought the #LongStraddle for 2.50… the swings this week afforded opportunities to cut the loss to less than half, but my orders barely missed getting filled again and again. So although I did sell a few for 1.60, the stock ended the week right at my strike… not good for a long straddle!
#CoveredCalls #Assignment $PVTL stock called away via 18 and 19 calls. This was a September earnings trade, was assigned at 22.50 and through multiple rounds of covered calls I’m exiting at about break-even.
#DoubleCalendar Taking assignment of $NTAP stock, cost basis 64.79.
#IronCondor Closed $DECK short 145 calls for 1.30. Was able to exit some at .50 and .20, so overall this trade will be a small winner or a small loser across my accounts. Condor sold for .86 on Jan 31st.
Double Calendar performance
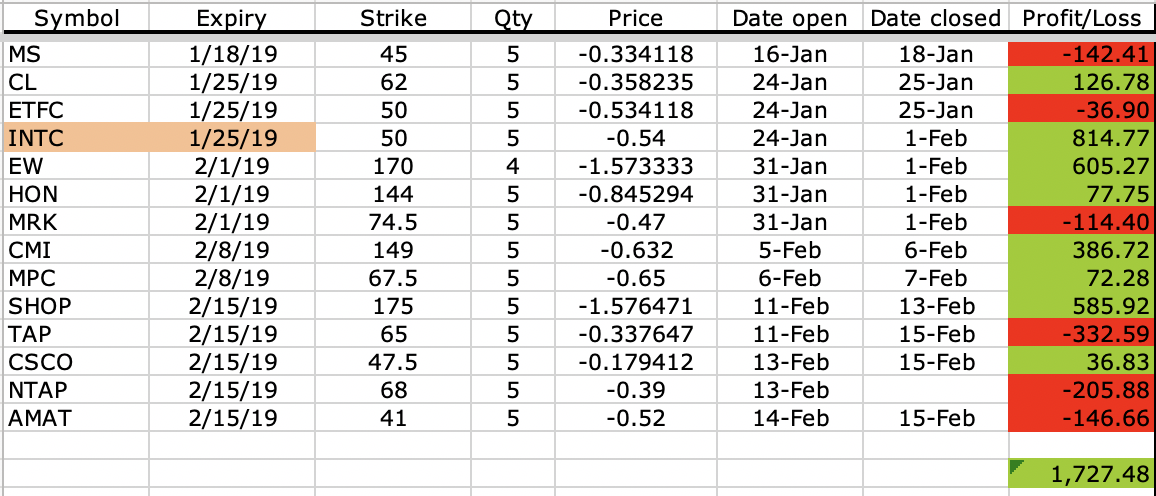
#Earnings #DoubleCalendar Here’s the performance this quarter of double calendars. It is performing better than last quarter, with over $1,700 in profit, using 5-lots.
NOTE: NTAP here is accounted as full loss, even though I will probably hold stock in to next week.
NOTE ALSO: INTC here is accounted as taking stock assignment and then closing all a week later. What I actually did was close only half, and converted the other half of stock into a #PieTrade.
AMAT closed
#Earnings Sold to close $AMAT Feb15/Feb22 #DoubleCalendar for .28. Bought yesterday for .52. Couldn’t get off its ass enough to make it a winner.
SPX 1-dte
#SPX1dte Expiring: $SPX Feb 15th condor, sold yesterday for .85
Sold to Open $SPX Feb 19th 2705/2725-2800/2820 condors for 1.05 (IV: 7.7%, SPX 2768)
SPX ATM put spread closed
#SPX1dte Bought to close $SPX Feb 20th 2725/2700 put spread for 1.30. Sold for 8.40 on Feb 5th. Sold this as Upside Warning was firing, and sat through an uncomfortable dip before it came through. I don’t know how much more steam this rally has, so I’m taking it off to avoid weekend risk.
Econ Calendar for week of 2/18/19
FOMC minutes at 2pm ET on Wednesday
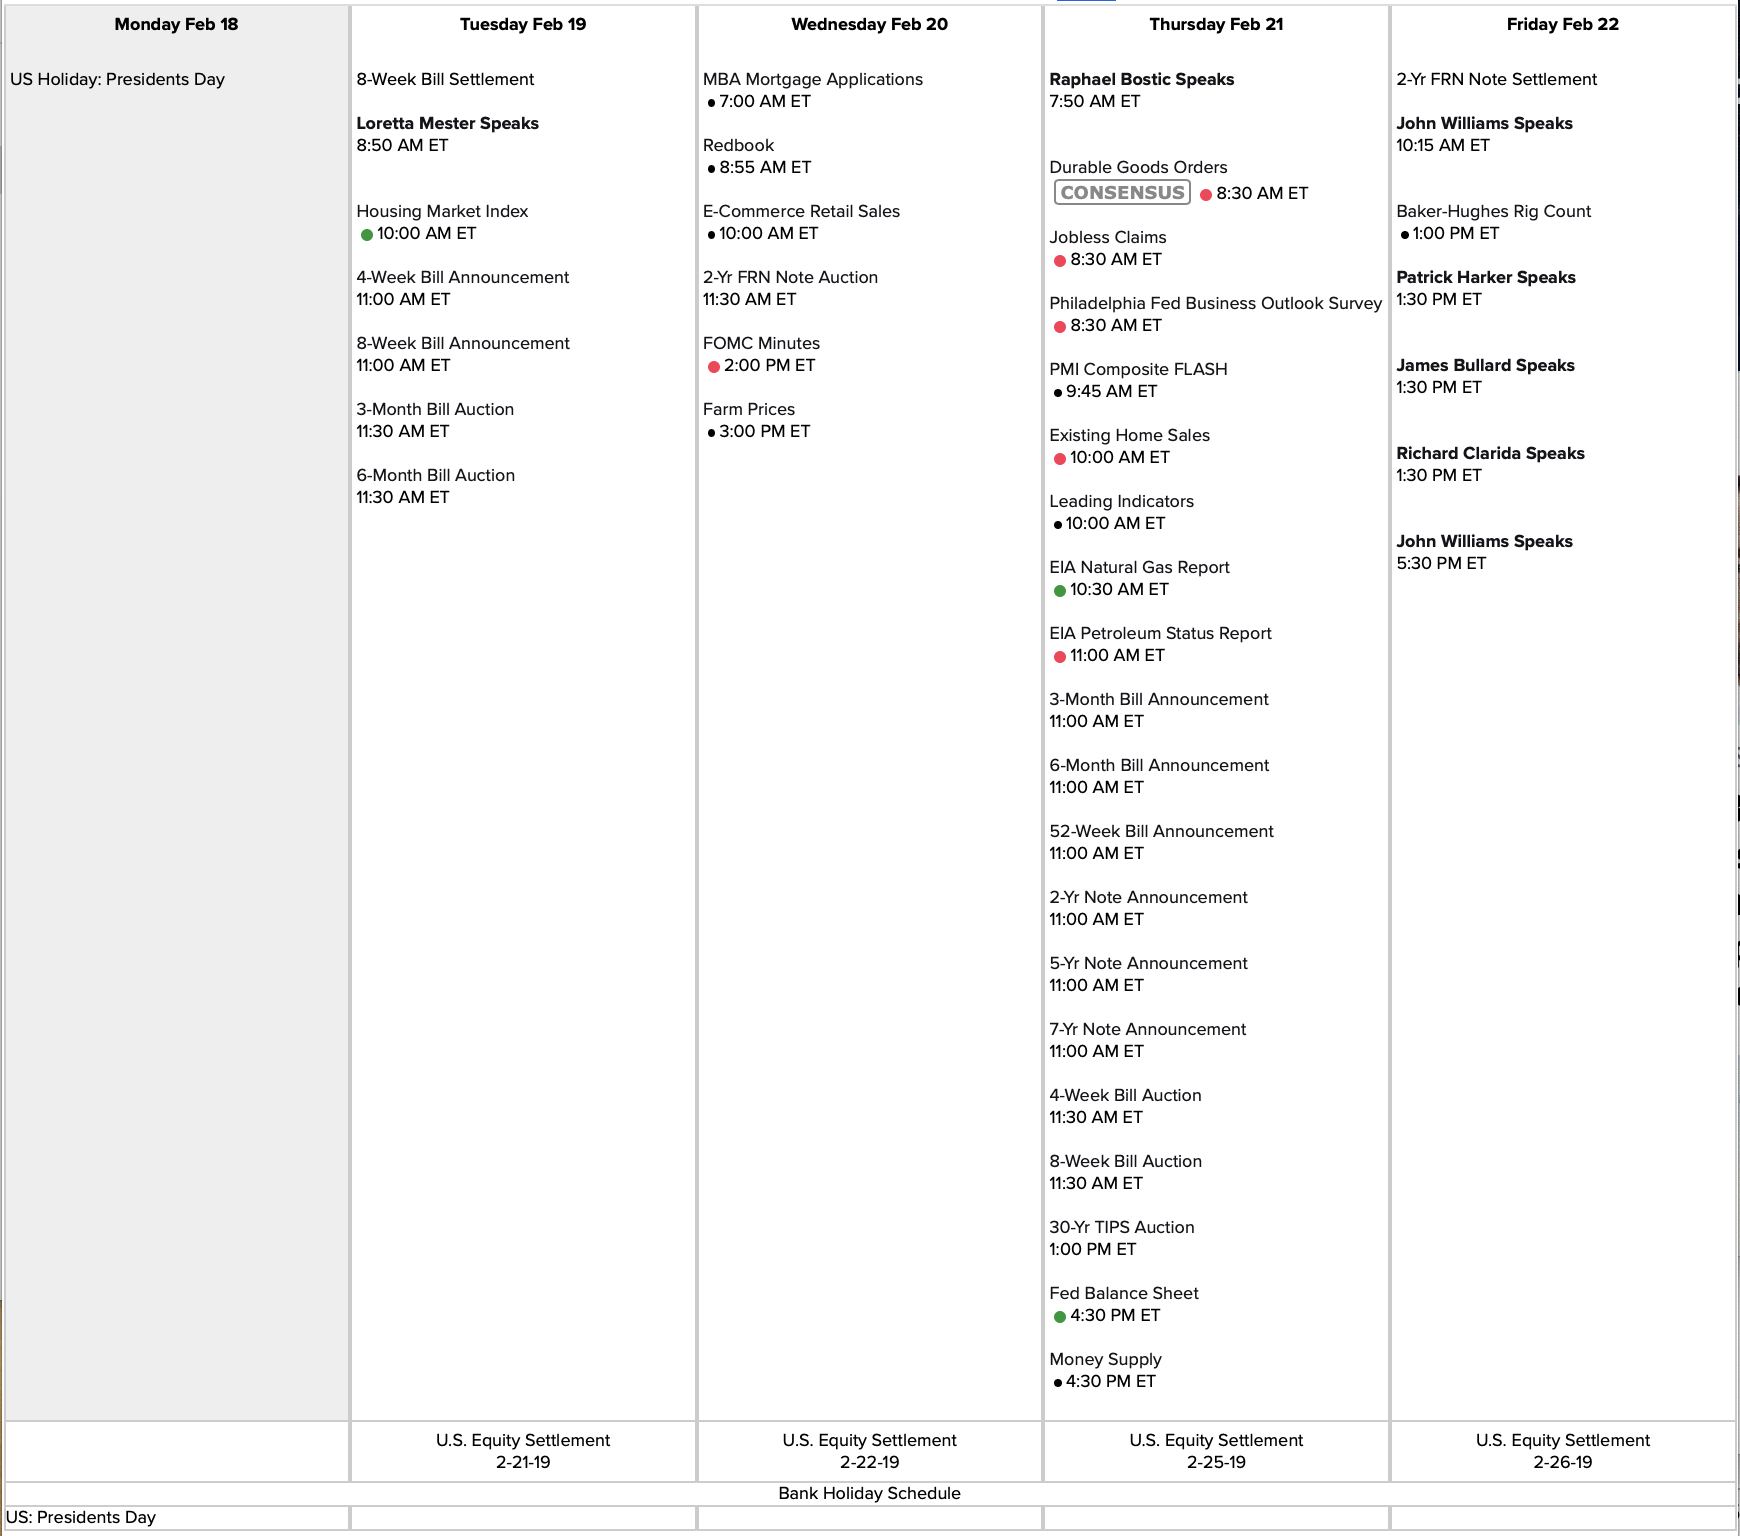
Link to calendar: https://us.econoday.com/byweek.asp?day=18&month=2&year=2019&cust=us&lid=0
TAPped out
$Earnings Closed $TAP Feb15/Feb22 65 #DoubleCalendar. I needed to close the puts, tried to play the swings but then stock started rallying so took an additional .30 loss on the exit. Calendar bought for .34 on Monday.
WMT earnings analysis
#Earnings — $WMT reports Tuesday morning (after Monday holiday). Below are details on earnings one-day moves over the last 12 quarters.
Nov. 15, 2018 BO -1.96%
Aug. 16, 2018 BO +9.33%
May 17, 2018 BO -1.90%
Feb. 20, 2018 BO -10.17% Biggest DOWN
Nov. 16, 2017 BO +10.89% Biggest UP
Aug. 17, 2017 BO -1.58%
May 18, 2017 BO +3.22%
Feb. 21, 2017 BO +2.99%
Nov. 17, 2016 BO -3.08%
Aug. 18, 2016 BO +1.87%
May 19, 2016 BO +9.58%
Feb. 18, 2016 BO -3.01%
Avg (+ or -) 4.97%
Bias 1.35%, positive bias on earnings.
With stock at 99.30 the data suggests these ranges:
Based on current IV (expected move into Friday per TOS): 95.03 to 103.57
Based on AVERAGE move over last 12 quarters: 94.37 to 104.23
Based on MAXIMUM move over last 12 Q’s (10.9%): 88.49 to 110.11
Open to requests for other symbols.
CSCO closed
#Earnings Sold to Close $CSCO Feb15/Feb22 47.5 #DoubleCalendar for .30. Bought for .18 on Wednesday. Stock came down enough for a small profit, but was too far from strike to make it a good one.
NTAP dub cal
#Earnings #DoubleCalendar Was assigned stock on over half of my position in $NTAP; Feb 15th 68 short puts. I just sold the Feb 22nd LONG puts for 3.60. I will now watch for some intraday strength in the stock to sell the stock, as well as cover the remaining short puts that were not assigned. If I can net a .39 difference (the price of the original double calendar), the trade will be breakeven. Higher and it will turn a profit.
Hall of Presidents
Back by popular demand, in observance of Presidents’ Day, it’s the Hall of Revolving Presidents. Click “Home/Refresh” or refresh your browser to change the featured President.
AMAT dub cal
#Earnings #DoubleCalendar Bought to open $AMAT Feb15/Feb22 41 dbl cals for .52
SPX 1-dte
#SPX1dte Closed $SPX monthly condor for .35. Sold yesterday for 1.00
Sold $SPX Feb 15th 2685/2705-2785/2805 condors for .85. (IV 13.2%, SPX 2751)
Also, bought to close $SPX Feb 22nd 2670/2650 put spreads for 1.00. Sold for 3.45 on Feb 4th. Still holding the Feb 20th 2725/2700 put spreads, sold ATM for 8.40.
UVXY calls
#VXXGame Bought to open $UVXY April 100 calls for .60. I have these for Feb and Mar. Since Feb expire tomorrow adding the April batch. Will be used to sell lower strikes against if we get a re-test.
AMAT earnings analysis
#Earnings — $AMAT reports tonight. Below are details on earnings one-day moves over the last 12 quarters.
Nov. 15, 2018 AC +1.08%
Aug. 16, 2018 AC -7.71%
May 17, 2018 AC -8.24% Biggest DOWN
Feb. 14, 2018 AC +3.89%
Nov. 16, 2017 AC -2.33%
Aug. 17, 2017 AC +2.73%
May 18, 2017 AC +0.38%
Feb. 15, 2017 AC -0.87%
Nov. 17, 2016 AC +0.03%
Aug. 18, 2016 AC +7.08%
May 19, 2016 AC +13.81% Biggest UP
Feb. 18, 2016 AC +7.04%
Avg (+ or -) 4.60%
Bias 1.41%, positive bias on earnings.
With stock at 40.75 the data suggests these ranges:
Based on current IV (expected move into Friday per TOS): 38.47 to 43.03
Based on AVERAGE move over last 12 quarters: 38.88 to 42.62
Based on MAXIMUM move over last 12 Q’s (13.8%): 35.12 to 46.38
NVDA earnings analysis
#Earnings — $NVDA reports tonight. Below are details on earnings one-day moves over the last 12 quarters.
Nov. 15, 2018 AC -18.75% Biggest DOWN
Aug. 16, 2018 AC -4.90%
May 10, 2018 AC -2.15%
Feb. 8, 2018 AC +6.69%
Nov. 9, 2017 AC +5.26%
Aug. 10, 2017 AC -5.32%
May 9, 2017 AC +17.82%
Feb. 9, 2017 AC -2.37%
Nov. 10, 2016 AC +29.80% Biggest UP
Aug. 11, 2016 AC +5.59%
May 12, 2016 AC +15.20%
Feb. 17, 2016 AC +8.60%
Avg (+ or -) 10.20%
Bias 4.62%, positive bias on earnings.
With stock at 153.00 the data suggests these ranges:
Based on current IV (expected move into Friday per TOS): 142.59 to 163.41
Based on AVERAGE move over last 12 quarters: 137.39 to 168.61
Based on MAXIMUM move over last 12 Q’s (29.8%): 107.41 to 198.59
Futures drop
Futures have given up all of their earlier gains after a slew of weaker than expected economic data.https://t.co/Cq39KWZ7Rg pic.twitter.com/oceTxPSkTB
— Bespoke (@bespokeinvest) February 14, 2019
SHOP fully closed
#Earnings Sold the last batch of $SHOP Feb15/Feb22 #DoubleCalendar for 3.10. Bought for 1.60 on Monday.
SPX 1-dte
#SPX1dte Sold to Open $SPX Feb 14th (monthlys) 2690/2710-2790/2810 condors for 1.00. These are monthlys, so they stop trading at Thursday’s close but settle Friday morning. I will close the trade before tomorrow’s close to avoid gap risk.
Expiring: Feb 13th condor, sold yesterday for 1.00.
NTAP dub cal
#Earnings Bought to Open $NTAP Feb15/Feb22 68 #DoubleCalendar for .39.
CSCO dub cal
#Earnings Bought to Open $CSCO Feb15/Feb22 47.5 #DoubleCalendar for .18.
Price has gone up on NTAP so looking to buy now.
NTAP and CSCO for earnings
#Earnings #DoubleCalendar Both $NTAP and $CSCO make very cheap double calendars. Especially NTAP, which can probably be bought for around .20 and may offer profits as high as 2.00, if there is not a super large move. Even with a modest move, this should still turn a profit, but if not, it’s only .20. CSCO will go for a similar price but will offer a lower return.
FOSL earnings analysis
#Earnings — $FOSL reports tonight. Below are details on earnings one-day moves over the last 12 quarters.
Nov. 7, 2018 AC +5.75%
Aug. 7, 2018 AC -11.63%
May 8, 2018 AC +9.06%
Feb. 13, 2018 AC +87.72% Biggest UP
Nov. 7, 2017 AC -17.22%
Aug. 8, 2017 AC -25.08%
May 9, 2017 AC -20.44%
Feb. 14, 2017 AC -14.82%
Nov. 3, 2016 AC +3.52%
Aug. 9, 2016 AC +0.69%
May 10, 2016 AC -29.07% Biggest DOWN
Feb. 16, 2016 AC +28.55%
Avg (+ or -) 21.13%
Bias 1.42%, slight positive bias on earnings.
With stock at 16.20 the data suggests these ranges:
Based on current IV (expected move into Friday per TOS): 13.28 to 19.12
Based on AVERAGE move over last 12 quarters: 12.78 to 19.62
Based on MAXIMUM move over last 12 Q’s (87.7%): 1.99 to 30.41
YELP earnings analysis
#Earnings — $YELP reports tonight. Below are details on earnings one-day moves over the last 12 quarters.
Nov. 8, 2018 AC -26.59% Biggest DOWN
Aug. 8, 2018 AC +26.65%
May 10, 2018 AC -7.81%
Feb. 7, 2018 AC -14.04%
Nov. 1, 2017 AC -0.10%
Aug. 3, 2017 AC +27.66% Biggest UP
May 9, 2017 AC -18.35%
Feb. 9, 2017 AC -13.64%
Nov. 2, 2016 BO +9.94%
Aug. 9, 2016 AC +12.83%
May 5, 2016 AC +23.71%
Feb. 8, 2016 AC -2.30%
Avg (+ or -) 15.30%
Bias 1.50%, slight positive bias on earnings.
With stock at 38.75 the data suggests these ranges:
Based on current IV (expected move into Friday per TOS): 33.76 to 43.74
Based on AVERAGE move over last 12 quarters: 32.82 to 44.68
Based on MAXIMUM move over last 12 Q’s (27.7%): 28.03 to 49.47
SQ calls
#LongLEAPs #SyntheticCoveredCalls
Sold $SQ Feb 22nd 77 calls for 2.05. Earnings are the following week.
Closing more SHOP
#Earnings Funny story. I have two orders in to sell at 2.75, both 1-lots. And I had another order to sell 3 for 3.00. Guess which one filled?
Sold $SHOP #DoubleCalendar for 3.00. Bought for 1.60 on Monday.
TQQQ calls
#LongLEAPs #SyntheticCoveredCalls
Still licking the wounds of last few weeks of calls being blown through.
Sold $TQQQ Feb 22nd 48 calls for 2.20

