#SPX1dte Too cheap to go short, so trying a long shot again…
Bought to open $SPX 2770/2790-2850/2860 broken-wing iron condor for .55. (IV: 6.23%, SPX: 2820)
Author Archives: Jeff
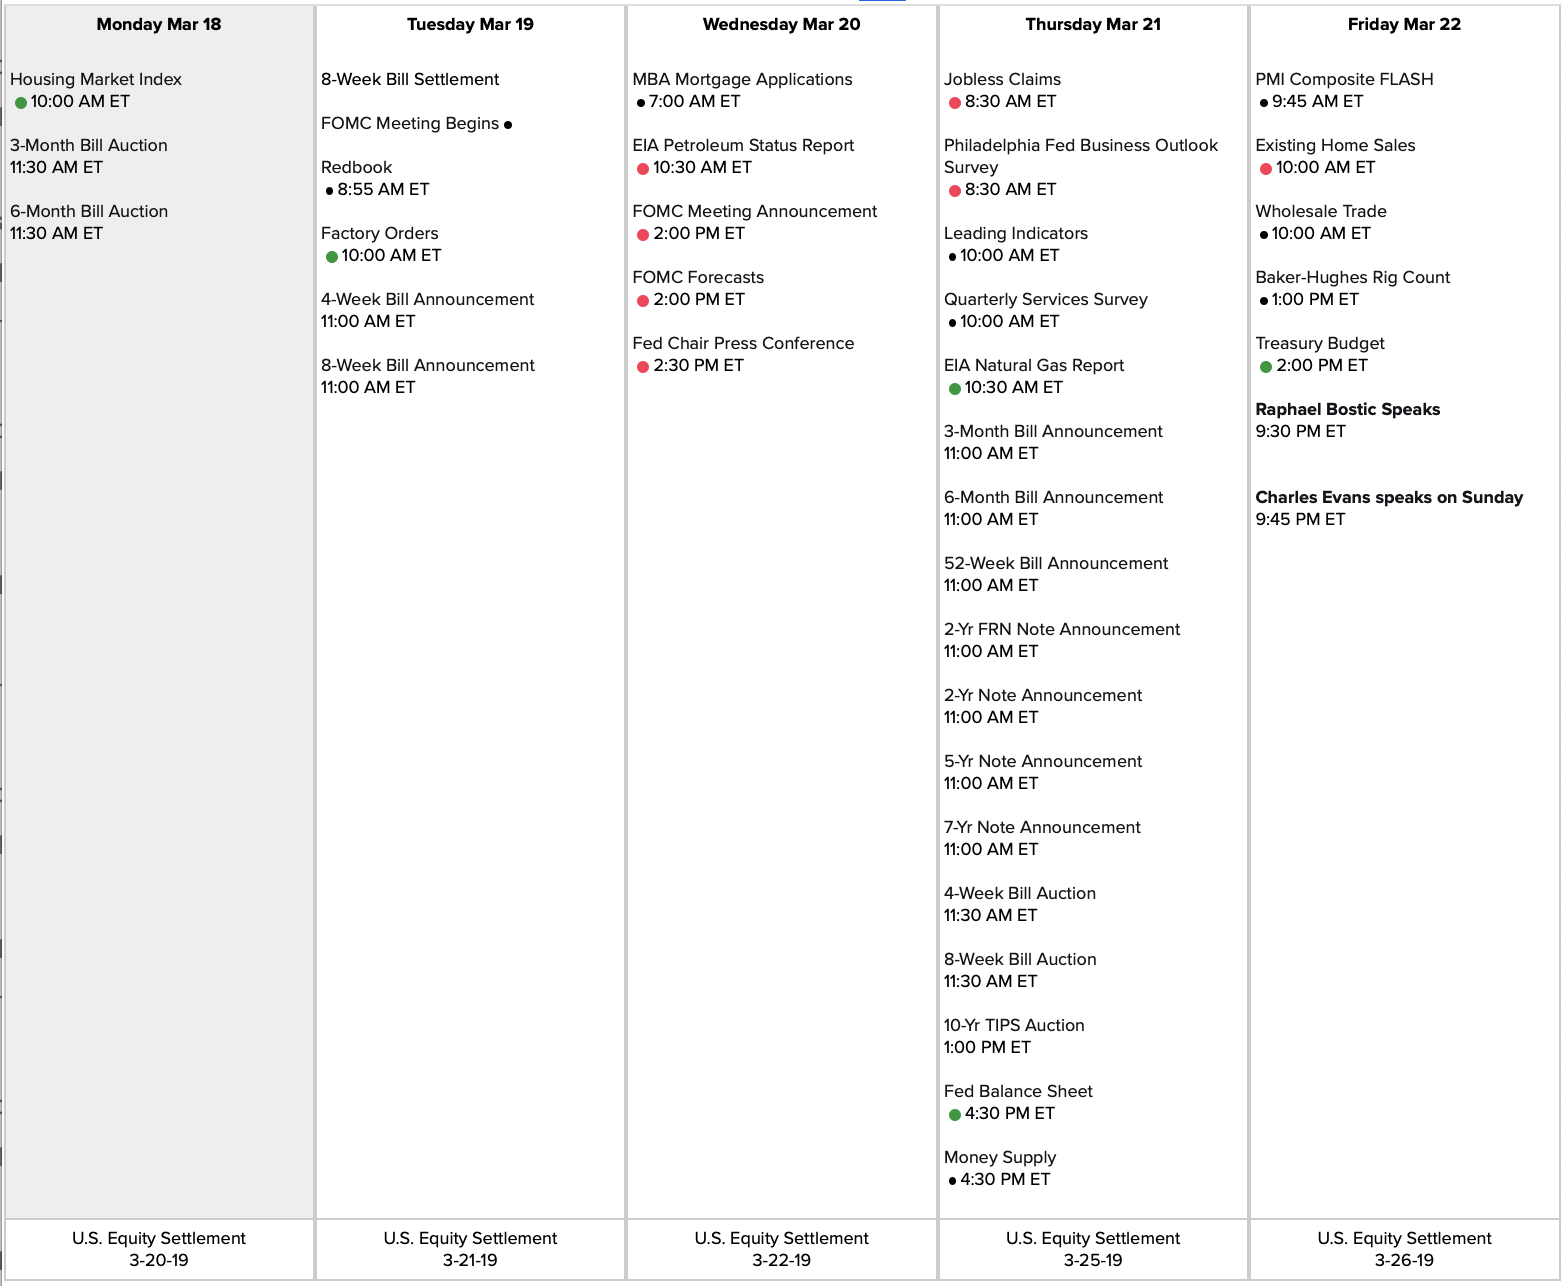
Econ Calendar for week of 3/18/19
ORCL starting to close
#Earnings Sold to close first batch of $ORCL Mar15/Mar22 53 #DoubleCalendar for .50. Watching for better exit on the next batch. Bought yesterday for .23 and .24
OSTK earnings trade and analysis
#Earnings — $OSTK reports Monday morning. Below are details on earnings FIVE-day moves over the last 12 quarters.
Thu 11/08/2018 AC -12.62%
Thu 08/09/2018 AC -14.77% Biggest DOWN
Tue 05/08/2018 AC -4.19%
Thu 03/15/2018 AC -3.63%
Wed 11/08/2017 AC +40.40% Biggest UP
Thu 08/03/2017 AC +6.99%
Thu 05/04/2017 AC -1.29%
Tue 01/31/2017 AC +1.20%
Thu 11/03/2016 AC +21.75%
Thu 08/04/2016 AC -0.74%
Tue 05/03/2016 AC +2.96%
Tue 02/09/2016 AC +30.59%
Avg (+ or -) 11.76%
Bias 5.55%, positive bias on earnings.
With stock at 20.25 the data suggests these ranges over FIVE days:
Based on current IV (expected move into Friday per TOS): 16.43 to 24.07
Based on AVERAGE move over last 12 quarters: 17.87 to 22.63
Based on MAXIMUM move over last 12 Q’s (40.4%): 12.07 to 28.43
Based on DOWN max only (-14.8%): 17.26
Open to requests for other symbols.
AVGO earnings trade
#Earnings Bpought to open $AVGO Mar 15th 260/265/267.5 call #BrokenWingButterfly for 1.70. No upside risk. Allows for a 3% downside move.
SPX 1-dte
#SPX1dte Sold $SPX March 15th (PM) 2755/2775-2835/2855 condors for .75. (IV: 10.37%, SPX 2809)
I will be closing today’s condor for as cheaply as possible into the close, to avoid gap risk on tomorrow morning’s settlement.
ADBE earnings trade and analysis
#Earnings — Sold ADBE Mar 15th 245/250-280/285 condor for 1.12. Allows 5.7% move in either direction. Such a move has only been significantly exceeded twice in the data below.
$ADBE reports tonight. Below are details on earnings one-day moves over the last 12 quarters.
Dec. 13, 2018 AC -7.28% Biggest DOWN
Sept. 13, 2018 AC +2.29%
June 14, 2018 AC -2.43%
March 15, 2018 AC +3.05%
Dec. 14, 2017 AC +1.43%
Sept. 19, 2017 AC -4.24%
June 20, 2017 AC +2.36%
March 16, 2017 AC +3.80%
Dec. 15, 2016 AC -1.47%
Sept. 20, 2016 AC +7.11% Biggest UP
June 21, 2016 AC -5.72%
March 17, 2016 AC +3.84%
Avg (+ or -) 3.75%
Bias 0.23%, no significant bias on earnings.
With stock at 265.00 the data suggests these ranges:
Based on current IV (expected move into Friday per TOS): 252.53 to 277.47
Based on AVERAGE move over last 12 quarters: 255.06 to 274.94
Based on MAXIMUM move over last 12 Q’s (7.3%): 245.71 to 284.29
Open to requests for other symbols.
ORCL earnings trade and analysis
#Earnings — Bought ORCL Mar15/Mar22 53 #DoubleCalendar for .23 & .24.
$ORCL reports tonight. Below are details on earnings one-day moves over the last 12 quarters.
Dec. 17, 2018 AC +0.26%
Sept. 17, 2018 AC -0.30%
June 19, 2018 AC -7.45%
March 19, 2018 AC -9.43% Biggest DOWN
Dec. 14, 2017 AC -3.76%
Sept. 14, 2017 AC -7.67%
June 21, 2017 AC +8.56% Biggest UP
March 15, 2017 AC +6.22%
Dec. 15, 2016 AC -4.30%
Sept. 15, 2016 AC -4.74%
June 16, 2016 AC +2.69%
March 15, 2016 AC +3.82%
Avg (+ or -) 4.93%
Bias -1.34%, negative bias on earnings.
With stock at 53.00 the data suggests these ranges:
Based on current IV (expected move into Friday per TOS): 50.52 to 55.48
Based on AVERAGE move over last 12 quarters: 50.39 to 55.61
Based on MAXIMUM move over last 12 Q’s (9.4%): 48.00 to 58.00
Based on Max UP only (+8.6%): 57.54
Open to requests for other symbols.
AVGO earnings analysis
#Earnings — $AVGO reports tonight. Below are details on earnings one-day moves over the last 12 quarters.
Dec. 6, 2018 AC +0.58%
Sept. 6, 2018 AC +7.69%
June 7, 2018 AC -2.53%
March 15, 2018 AC -4.81% Biggest DOWN
Dec. 6, 2017 AC 0.00%
Aug. 24, 2017 AC -3.70%
June 1, 2017 AC +8.49% Biggest UP
March 1, 2017 AC +0.99%
Dec. 8, 2016 AC +4.90%
Sept. 1, 2016 AC -2.24%
June 2, 2016 AC +4.93%
March 3, 2016 AC +6.35%
Avg (+ or -) 3.93%
Bias 1.72%, positive bias on earnings.
With stock at 271.00 the data suggests these ranges:
Based on current IV (expected move into Friday per TOS): 257.74 to 284.26
Based on AVERAGE move over last 12 quarters: 260.34 to 281.66
Based on MAXIMUM move over last 12 Q’s (8.5%): 247.99 to 294.01
Based on Max DOWN only (-4.8%): 257.96
Open to requests for other symbols.
SPX 1-dte
#SPX1dte Sold $SPX March 14th (monthlys) 2750/2770-2855/2875 condors for 1.00.(IV 13%, SPX: 2816)
Compounding effect on levered ETF’s – TQQQ
I am long $TQQQ 66.67 LEAP calls for Jan 2020. I wanted to look at the effect of compounding on the TQQQ, which moves 3x the $QQQ on a daily basis. Levered ETF’s like this are naturally drawn toward zero, a topic I’ve covered before as #ContangoETFs. This is why some of us sell calls on $DUST and $NUGT and a few others like $BOIL. Even though they can go high pretty fast, they will always be drawn back toward zero.
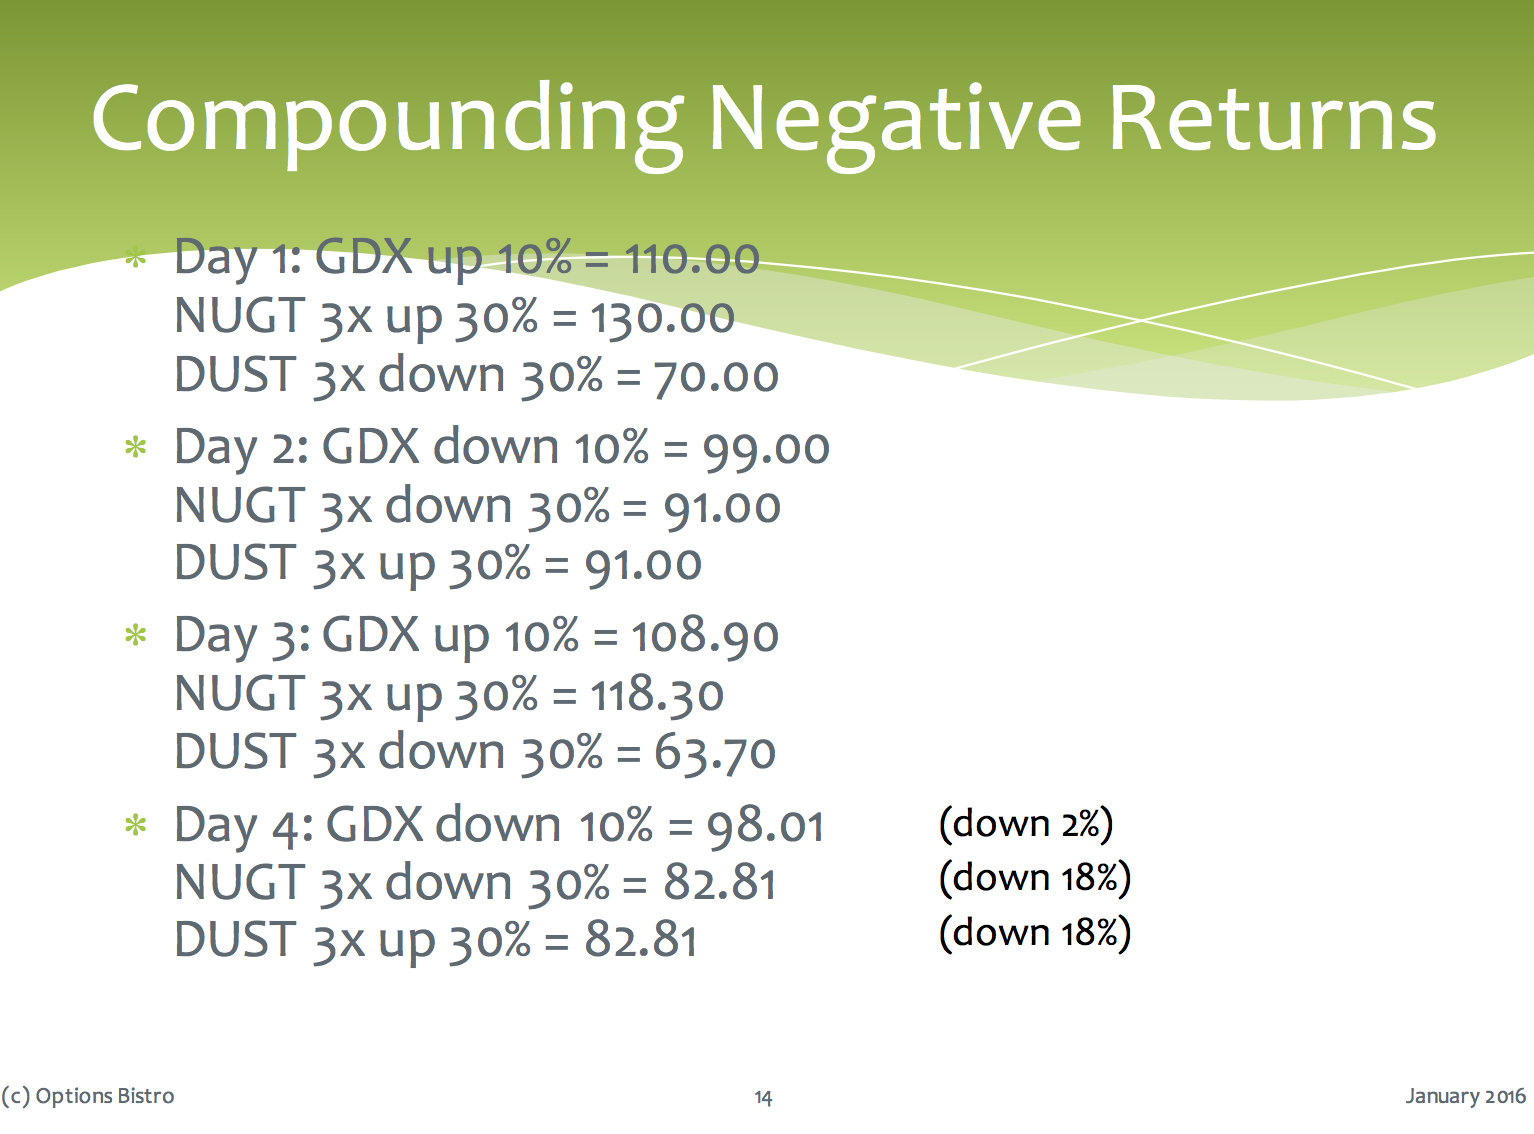
Here’s a chart from my long-ago webinar demonstrating the effect, using hypothetical 10% moves, up and down, on $GDX, and its levered ETFs NUGT and DUST:
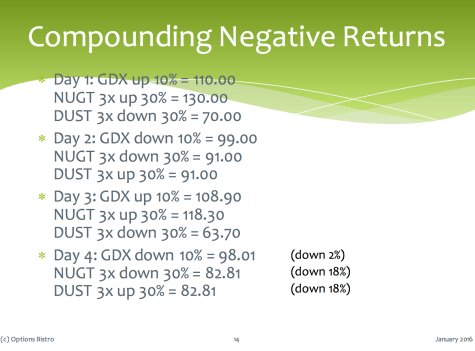
As you can see, over just 4 days of moving up and down, GDX is only down 2% and both ETF’s are down 18%. Note that even though NUGT is bullish and DUST is bearish, they moved down the exact same amount.
So I was thinking of TQQQ over the last several months, since the market has gone up and down significantly. Unlike the gold miners, the indices like QQQ have been steadily rising for years, so can we can expect better behavior? I found that the close on June 6, 2018, was only 17 cents off from yesterday’s close on QQQ, so basically the same, and the perfect point from which to measure.
First, I looked at the intraday high of the year, on Aug 30th.
$QQQ up 6.6% from June 6 (175.86 to 187.52)
$TQQQ up 19.1% from June 6 (61.61 to 73.36) *better
This is not surprising, as the move was straight up, and TQQQ performs x3 the QQQ.
Then I looked at yesterday’s close:
QQQ flat at 175.69 from June 6th
TQQQ down 11.7% from June 6th *worse
So, from June 6 until now, TQQQ has suffered from the 3x compounding, while QQQ ended flat.
Looking at a longer time-frame, from the summer highs of 2015:
QQQ up 49.6%
TQQQ up 129.0% *better
What do we conclude? If an underlying has a persistent bullish trend, as QQQ and all the major indices have had since 2009, the triple levered ETF’s will perform better. However, if we enter a period of consolidation, or a bear trend, they will perform more weakly than the underlying.
SPX 1-dte stopped
#SPX1dte Bought to close $SPX March 13th 2825 calls for .90. Condors sold yesterday for .80. Will be placing a new one today with monthlys that stop trading at tomorrow’s close.
DG earnings analysis
#Earnings — $DG reports tomorrow morning. Below are details on earnings one-day moves over the last 12 quarters.
Dec. 4, 2018 BO -6.80%
Aug. 30, 2018 BO -0.97%
May 31, 2018 BO -9.36%
March 15, 2018 BO +4.75%
Dec. 7, 2017 BO +2.77%
Aug. 31, 2017 BO -5.43%
June 1, 2017 BO +6.54%
March 16, 2017 BO +0.53%
Dec. 1, 2016 BO -4.96%
Aug. 25, 2016 BO -17.62%
May 26, 2016 BO +4.61%
March 10, 2016 BO +10.66%
Avg (+ or -) 6.25%
Bias -1.27%, negative bias on earnings.
With stock at 121.00 the data suggests these ranges:
Based on current IV (expected move into Friday per TOS): 114.40 to 127.60
Based on AVERAGE move over last 12 quarters: 113.44 to 128.56
Based on MAXIMUM move over last 12 Q’s (17.6%): 99.68 to 142.32
Based on Max UP only (+10.7%): 133.90
Open to requests for other symbols.
SFIX assignment
#Earnings #Assignment #EarlyAssignment #ShortStock
Assigned over half of my position on $SFIX short 25 calls. Closed short stock position for 31.90. Will sell long calls to cancel out loss, and hopefully cancel out original purchase too if I can get the stock just a bit higher.
SPX surging
#SPX1dte BTC $SPX March 22nd 2825/2850 call spreads for 10.50. Condors sold for 6.00 on Monday. Had no choice but to close in face of renewed upside warning and strong rally. I’m letting the 2720/2700 put side decay some more, and also added a Partial #ReverseRoll:
Sold SPX March 22nd 2780/2755 put spreads for 3.45.
Now in the hole and will have to choose when to sell a new call spread. Also may need to close today’s 1-dte with short at 2825. Hard to believe it could reach that but after Monday’s 40-point rise we can’t be sure.
“Minor” upside warning
#VIXIndicator Usually the Upside Warning is canceled when we get a Downside Warning. But sometimes, like last Monday, the UpW is canceled by an intraday spike on the $VIX, with no DW taking effect. Usually when that happens, the DW comes within the next few days.
But sometimes, the VIX retreats enough to fire a “minor” upside warning… which is measured on the Fib levels from the recent intraday spike. So three closes below the 78.6% line would fire this “minor” signal.
That will happen today provided VIX closes below 14.44.
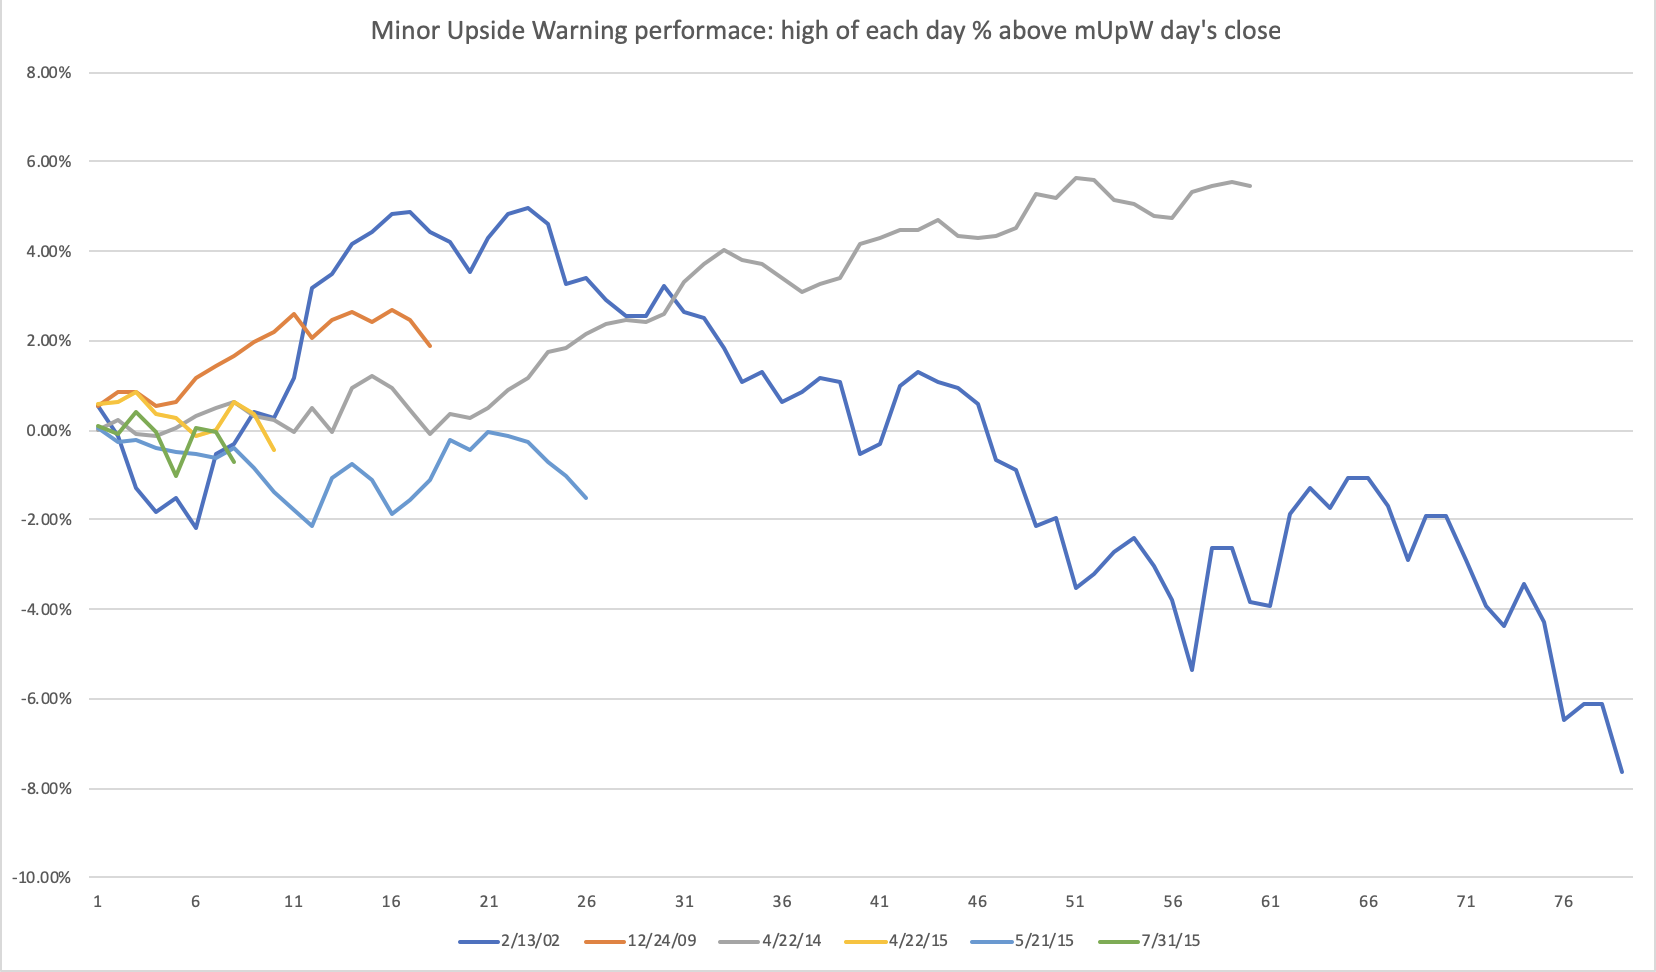
This has happened only 6 times since 2000. Below is a chart with the performance of SPX in the days after each “mUpW”, ending at the next VIX spike or DW. You can see that it is mostly positive; even the longest one that goes negative spiked pretty high before rolling over.
SPX 1-dte
#SPX1dte Sold $SPX March 13th 2740/2760-2825/2845 condors for .80 (IV: 10.46%, SPX: 2792)
TQQQ calls
#LongLEAPs #SyntheticCoveredCalls Sold $TQQQ March 22nd 52 calls for 1.25 (earlier)
SPX 1-dte slammed
#SPX1dte The is the kind of hit this strategy cannot suffer often. Bought to close $SPX March 11th 2770 calls for 6.10. I was working to close for the last 20 minutes but could not get a pullback. I will make a few cents back sell the long 2790’s, but only .20-.30 cents (first ones just filled for .20).
I’m going to maintain a view of weakness and sell an aggressive call spread to work on the roll.
I set my sights to close after we breached 2760. Wasn’t too concerned until by shorts hit 3.00. Then, the rally would not relent. This was the Monday I was looking for last week, when I was LONG calls. I almost made the same trade on Friday but decided to go short. Then, the rally into the close set me up for this painful Monday.
SFIX earnings trade and analysis
#Earnings — This is another cheap shot with a fairly new stock that’s been volatile. Profit range allows 20% in either direction. If this drifts toward the center during the week it could be a triple or quadruple.
Bought $SFIX Mar15/Mar22 25 #DoubleCalendar for .20, .24, .25.
$SFIX reports tonight. Below are details on earnings one-day moves over its entire history.
Dec. 10, 2018 AC -20.90%
Oct. 1, 2018 AC -35.15% Biggest DOWN
June 7, 2018 AC +26.48% Biggest UP
March 12, 2018 AC -3.60%
Dec. 19, 2017 AC -9.77%
Avg (+ or -) 19.18%
Bias -8.59%, negative bias on earnings.
With stock at 25.00 the data suggests these ranges:
Based on current IV (expected move into Friday per TOS): 20.06 to 29.94
Based on AVERAGE move over last 12 quarters: 20.21 to 29.80
Based on MAXIMUM move over last 12 Q’s (35.2%): 16.21 to 33.79
Based on Max UP only (+26.5%): 31.62
Open to requests for other symbols.
SPX 1-dte
#SPX1dte Closed $SPX March 11th 2690 short puts for .05. Will work to close 2770 short calls as stop was breached.
SPX 1-dte
#SPX1dte Sold to Open $SPX March 11th 2670/2690-2770/2790 for .90. (IV: 9.6%, SPX 2731)
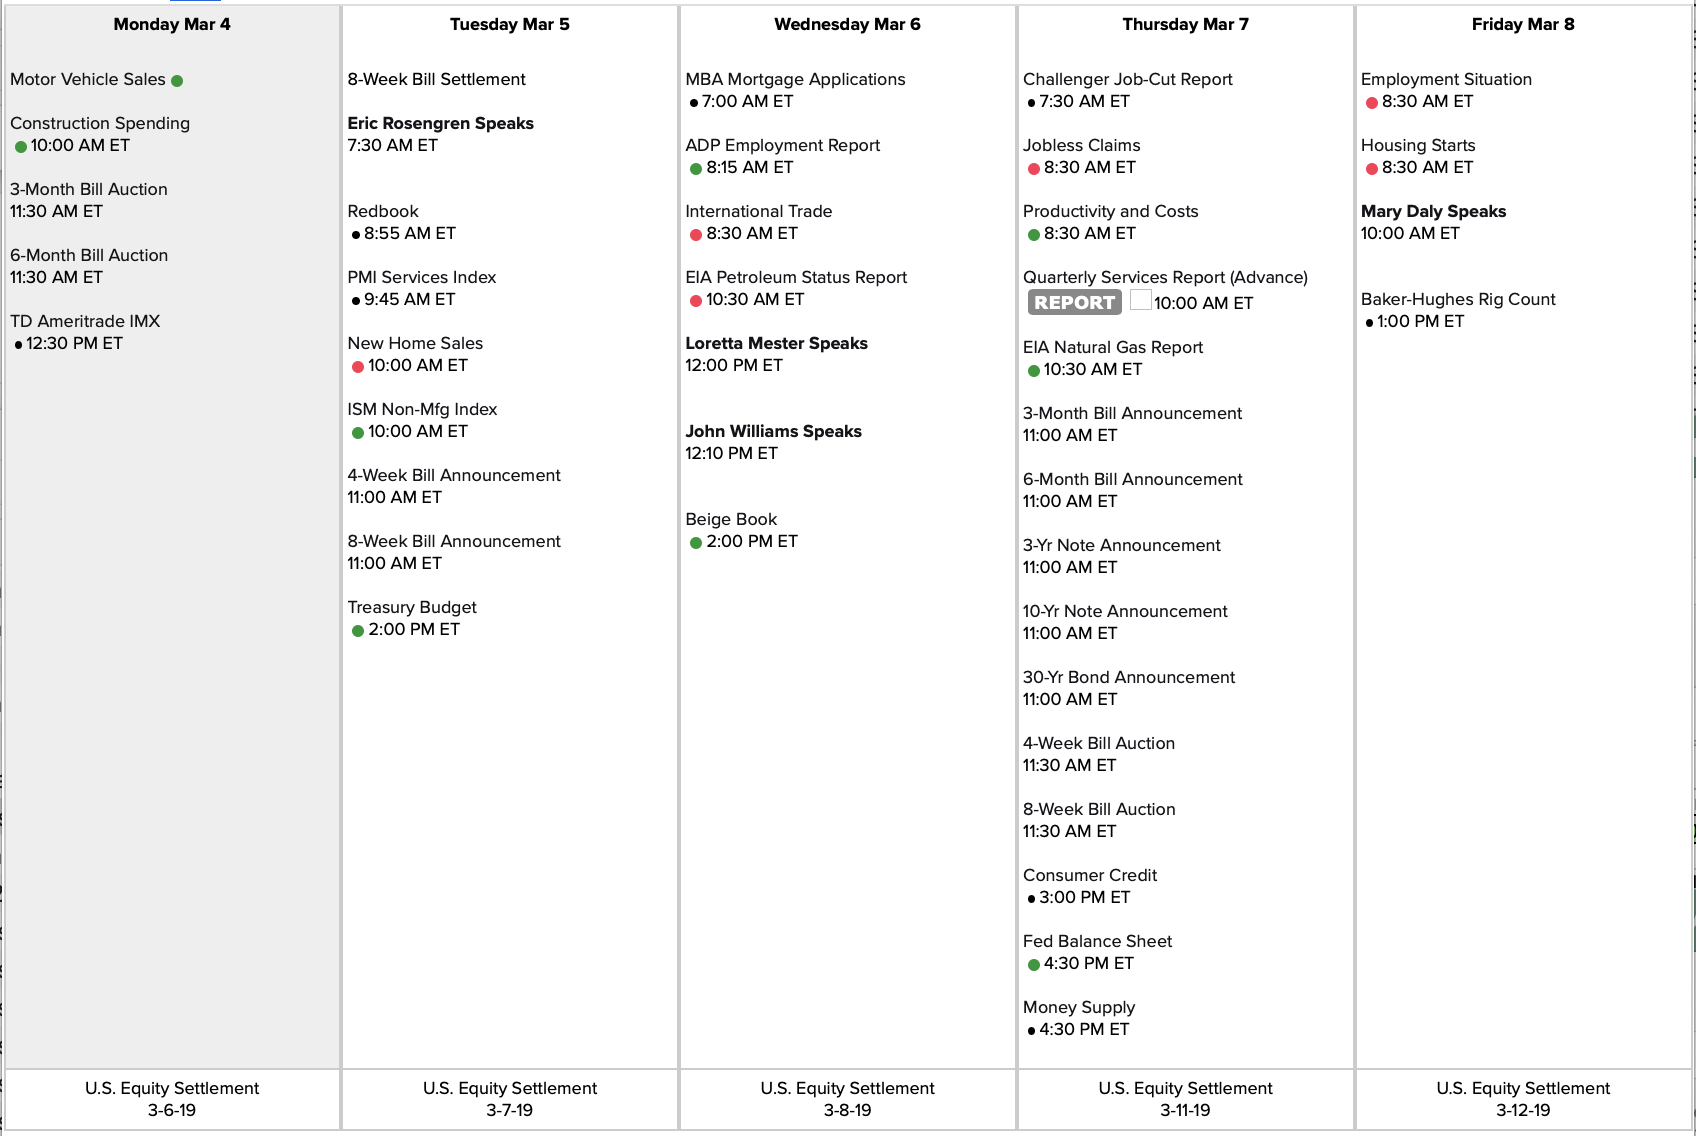
Econ Calendar for week of 3/11/19
SPX 1-dte closed
#SPX1dte Closed $SPX March 8th 2700/2680 put spreads for .15. Condors sold yesterday for 1.10. I’ll let calls expire.
SPX 1-dte roll
#SPX1dte BTC $SPX March 15th 2800/2820 call spreads for 1.15. Sold yesterday for 3.20 as a roll.
Dub Cals closed
#Earnings Sold to close $COST Mar08/Mar15 217.5 #DoubleCalendar for 1.33. Bought yesterday for 1.20. Only a 1-lot… chose not to wait for a pullback when expiration is today and small profit availabe.
Sold to close $SSYS Mar08/Mar15 26.5 dbl cal for .04. Bought for .16 on Wednesday.
$DLTR, looking to close ITM call side for .05 or .00
Dub cals didn’t work this week, but losses only totaled .40 plus commissions.
February Jobs Report
#Jobs Way lower than expected. Wages continue uptick.
+20,000 non-farm payroll jobs, vs. 180K expected (lowest since Sept 2017)
Unemployment at 3.8%, down 0.2%
U6 unemployment at 7.3%, down 0.8% (biggest drop in over 20 years)
Wages up 0.4%, 3.4% year over year (highest since April 2009)
Labor force participation 63.2%, unchanged
January revised up from 304K to 311K
December revised up from 222K to 227K
SPX 1-dte
#SPX1dte Sold to Open $SPX March 8th 2680/2700-2775/2795 condors for 1.10. (IV 13.48%, SPX 2747)
Also, closed April 5th 2525/2550-2925/2950 condors for 1.75. Sold for 2.60 on 2/20 as a roll. I didn’t want to sit with anything right now as I feel a rush lower could be happening in the coming days.
COST dub cal
#Earnings Bought to Open $COST Mar08/Mar15 217.5 #DoubleCalendar for 1.20. As yesterday, filled on TOS but not IB yet.
BIG earnings analysis
#Earnings — $BIG reports tomorrow. Below are details on earnings EIGHT-day moves over the last 12 quarters (since next available options expire in 8 days).
Fri 12/07/2018 BO -29.28% Biggest DOWN
Fri 08/31/2018 BO -10.10%
Fri 06/01/2018 BO +4.54%
Fri 03/09/2018 BO -12.93%
Fri 12/01/2017 BO +0.76%
Fri 08/25/2017 BO -4.59%
Fri 05/26/2017 BO +3.28%
Fri 03/03/2017 BO -1.89%
Fri 12/02/2016 BO +8.09%
Fri 08/26/2016 BO -5.76%
Fri 05/27/2016 BO +18.85% Biggest UP
Fri 03/04/2016 BO +8.88%
Avg (+ or -) 9.08%
Bias -1.68%, negative bias on earnings.
With stock at 31.65 the data suggests these ranges:
Based on current IV (expected move into Friday per TOS): 27.41 to 35.89
Based on AVERAGE move over last 12 quarters: 28.78 to 34.52
Based on MAXIMUM move over last 12 Q’s (29.3%): 22.38 to 40.92
Based on Max UP only (+18.9%): 37.62
Open to requests for other symbols.
SPX 4-dte stopped
#SPX1dte Stopped $SPX March 8th 2720/2700 put spreads for 2.10. Condors sold Monday for 2.03 as a roll.
Expected move breached this morning so this is too risky to hold longer. Was able to get out near break-even on the bounce. I’ll let the 2830/2850 call side expire.
TQQQ calls closed
#LongLEAPs #SyntheticCoveredCalls BTC $TQQQ March 8th 50 calls for .78. Sold for 2.15 on Feb 22nd.
COST earnings analysis
#Earnings — $COST reports tonight. Below are details on earnings one-day moves over the last 12 quarters.
Dec. 13, 2018 AC -8.58% Biggest DOWN
Oct. 4, 2018 AC -5.55%
May 31, 2018 AC -0.55%
March 7, 2018 AC -0.89%
Dec. 14, 2017 AC +3.32%
Oct. 5, 2017 AC -5.97%
May 25, 2017 AC +1.79%
March 2, 2017 AC -4.33%
Dec. 7, 2016 AC +2.43%
Sept. 29, 2016 AC +3.40%
May 25, 2016 AC +3.57% Biggest UP
March 2, 2016 AC -0.77%
Avg (+ or -) 3.43%
Bias -1.01%, negative bias on earnings.
With stock at 218.00 the data suggests these ranges:
Based on current IV (expected move into Friday per TOS): 210.75 to 225.25
Based on AVERAGE move over last 12 quarters: 210.52 to 225.48
Based on MAXIMUM move over last 12 Q’s (18.9%): 199.30 to 236.70
Based on Max UP only (+3.6%): 225.78
Open to requests for other symbols.
SSYS dub cal
#Earnings As $DLTR ascends to the heavens, leaving my calendar in the dust, I’m trying another cheap one. $SSYS has an average move of 9% but for 20 cents, worth the shot.
I was filled on TOS with a 1-lot for .16. Kind of crazy. The fill shows I sold the Mar08 short call for 1.49 and bought the Mar15 long call for 1.50. Only a one penny spread? Meanwhile, my order at Interactive Brokers is in for .20 and not filling. Go figure.
Bought to Open $SSYS Mar08/Mar15 26.5 #DoubleCalendar for .16, trying for more at .20
BURL trade
#Earnings Bought to open $BURL Mar 8th 167.5/172.5/175 #BrokenWingButterfly (calls) for 1.40. No upside risk…
Max loss debit paid (1.40) if below 167.25.
Breakeven 168.85.
Max gain, 3.60 if Friday pin at 172.50.
Capped gain if over 175.00, 1.10.
SPX 1-dte closed
#SPX1dte Closed $SPX March 6th 2760/2740 put spreads for .40. Stop was breached earlier so I watched for a bounce opportunity. Sold yesterday for .95.
KR earnings analysis
#Earnings — $KR reports tomorrow morning. Below are details on earnings one-day moves over the last 12 quarters.
Dec. 6, 2018 BO +3.21%
Sept. 13, 2018 BO -9.92%
June 21, 2018 BO +9.74% Biggest UP
March 8, 2018 BO -12.39%
Nov. 30, 2017 BO +6.07%
Sept. 8, 2017 BO -7.50%
June 15, 2017 BO -18.89% Biggest DOWN
March 2, 2017 BO -4.33%
Dec. 1, 2016 BO +3.28%
Sept. 9, 2016 BO +0.63%
June 16, 2016 BO -0.67%
March 3, 2016 BO -7.01%
Avg (+ or -) 6.97%
Bias -3.15%, strong negative bias on earnings.
With stock at 28.80 the data suggests these ranges:
Based on current IV (expected move into Friday per TOS): 26.65 to 30.95
Based on AVERAGE move over last 12 quarters: 26.79 to 30.81
Based on MAXIMUM move over last 12 Q’s (18.9%): 23.36 to 34.24
Based on Max UP only (9.7%): 31.61
Open to requests for other symbols.
BURL earnings analysis
#Earnings — $BURL reports tomorrow morning. Below are details on earnings one-day moves over the last 12 quarters.
I’m posting this one because it has a remarkably bullish response to earnings. Also, in a very long weekly squeeze. Will probably do a bullish butterfly, or maybe try my first #JadeLizard.
Nov. 28, 2018 BO +12.78%
Aug. 30, 2018 BO -0.86%
May 31, 2018 BO +7.11%
March 8, 2018 BO +5.84%
Nov. 21, 2017 BO -1.51%
Aug. 24, 2017 BO +1.36%
May 25, 2017 BO +4.90%
March 2, 2017 BO +6.66%
Nov. 22, 2016 BO +15.98% Biggest UP
Aug. 25, 2016 BO +3.12%
May 26, 2016 BO +7.44%
March 3, 2016 BO -2.78% Biggest DOWN
Avg (+ or -) 5.86%
Bias 5.00%, very strong positive bias on earnings.
With stock at 170.00 the data suggests these ranges:
Based on current IV (expected move into Friday per TOS): 158.81 to 181.19
Based on AVERAGE move over last 12 quarters: 160.04 to 179.96
Based on MAXIMUM move over last 12 Q’s (16.0%): 142.83 to 197.17
Based on Max DOWN only (-2.8%): 165.27
Open to requests for other symbols.
ANF closing, DLTR not
#Earnings #LongStraddle Sold to close half of $ANF March 8th 21.5 calls for 3.40 and 3.80. #LongStraddle bought yesterday for 2.94. Holding the rest to see how high we can go.
DLTR 95 #DoubleCalendar, front week premium not going down much yet so sitting on this one for awhile.
CRM and SQ
#Earnings Bought to close $CRM March 8th 150/152.5/175/177.5 condors for .23. Sold for 1.15 yesterday.
#LongLEAPs #SyntheticCoveredCalls Sold to Open $SQ Mar 15th 79 calls for 1.00
SPX 1-dte
#SPX1dte Sold to Open $SPX March 6th 2740/2760-2815/2835 condors for .95. (IV 9.35%, SPX 2792)
ANF straddle, DLTR maybe
#Earnings #LongStraddle Bought $ANF March 8th 21.5 straddle for 2.94. Avg Move on earnings: 14.7%. I need a 13.7% move to breakeven.
Also trying for a #DoubleCalendar on $DLTR. Only if I can get filled for .40. Low probability, since it moves decently, but low risk worth the shot.
ANF earnings analysis
#Earnings — $ANF reports tomorrow morning. Below are details on earnings one-day moves over the last 12 quarters.
Nov. 29, 2018 BO +20.91%
Aug. 30, 2018 BO -17.15%
June 1, 2018 BO -8.72%
March 7, 2018 BO +11.90%
Nov. 17, 2017 BO +23.90% Biggest UP
Aug. 24, 2017 BO +17.06%
May 25, 2017 BO +8.99%
March 2, 2017 BO +13.94%
Nov. 18, 2016 BO -13.76%
Aug. 30, 2016 BO -20.30% Biggest DOWN
May 26, 2016 BO -15.66%
March 2, 2016 BO +3.64%
Avg (+ or -) 14.66%
Bias 2.06%, Positive bias on earnings.
With stock at 21.50 the data suggests these ranges:
Based on current IV (expected move into Friday per TOS): 18.76 to 24.24
Based on AVERAGE move over last 12 quarters: 18.35 to 24.65
Based on MAXIMUM move over last 12 Q’s (23.9%): 16.36 to 26.64
Open to requests for other symbols.
DLTR earnings analysis
#Earnings — $DLTR reports tomorrow morning. Below are details on earnings one-day moves over the last 12 quarters.
Nov. 29, 2018 BO +6.13%
Aug. 30, 2018 BO -15.54% Biggest DOWN
May 31, 2018 BO -14.28%
March 7, 2018 BO -14.47%
Nov. 21, 2017 BO +2.41%
Aug. 24, 2017 BO +5.62%
May 25, 2017 BO +0.92%
March 1, 2017 BO +0.20%
Nov. 22, 2016 BO +8.15%
Aug. 25, 2016 BO -9.93%
May 26, 2016 BO +12.77% Biggest UP
March 1, 2016 BO +2.21%
Avg (+ or -) 7.72%
Bias -1.32%, negative bias on earnings.
With stock at 95.00 the data suggests these ranges:
Based on current IV (expected move into Friday per TOS): 88.39 to 101.61
Based on AVERAGE move over last 12 quarters: 87.67 to 102.33
Based on MAXIMUM move over last 12 Q’s (15.5%): 80.24 to 109.76
Open to requests for other symbols.
SPX 4-dte roll
#SPX1dte Sold $SPX March 8th 2700/2720-2830/2850 condors for 2.03. Partial roll for loss taken this morning. (IV 12.34%, deltas .13p, .11c, SPX 2785.
Upside Warning canceled
#VIXIndicator The $VIX just took out the Upside Warning by 1-point. We need to close at 16.97 or higher for this to be a Downside Warning.
SPX 1-dte dream shattered
#SPX1dte Major suckage… Stopped $SPX March 4th 2770/2750 put spread for 4.60. What started as a brilliant #RiskReversal turned out to be my biggest loser since December (about 3.00 loss, after all accounted for).
To be expected once you get comfortable allowing spreads to expire. The first time volatility comes back it will take a bite.
SPY long trade closed
#LongCalls Plumb forgot I still had some of these, otherwise I would have sold at the the opening highs.
Sold to close $SPY March 8th 277.5 calls for 2.30. Bought for 1.67 (avg price), sold for 3.54 (avg price).
SPX dump
#SPX1dte Wow… huge reversal. Got stuck holding some longs that are now worthless… at least I sold enough to make that side overall profitable. But now my put spread is threatened and SPX has passed my stop level.
Could this be the blow-off top that starts a new down trend?
CRM condor
#Earnings Sold to Open $CRM March 8th 150/152.5-175/177.5 #IronCondor for 1.15. I put the order in earlier and didn’t expect it to drop this much. But still looking okay based on historical moves (analysis posted Friday.)
Biggest UP move: 11.0%, Biggest DOWN move: -4.4%, Average move: 3.7%. This is trade is +11.5% and -2.9% OTM.
SPX 1-dte risk reversal
#SPX1dte #RiskReversal Sold first batch of $SPX March 4th 2820/2830 LONG call spreads for 2.40. Bought for .45 on Friday (and financed by short put spreads sold for .75). Index not looking too strong so I may have to bail with the rest soon.
Final trades and expirations
#Earnings Sold to Close $VMW #DoubleCalendar final lots for 2.36 and 2.03. Bought for 1.23 yesterday. Avg close price 2.62.
$SPLK splunked out… the only time profit was available was first 5 minutes of the day. Bought for 1.20 yesterday.
Expiring:
$SPX 2740/2760-2810/2830 condors, sold yesterday for 1.10.
$AZO 860/855 put spreads. Call side closed for .35 on Wednesday. Condor sold for 2.28 on Monday.
$SQ 85 calls, sold for 1.08 on Wednesday.
Lottery tickets for next week:
$BUD 75 long puts
$MSTR 58 and 54 long puts
Econ calendar for week of 3/4/19
#Jobs report for February announced Friday, 8:30am ET
Link to calendar: https://us.econoday.com/byweek.asp?day=4&month=3&year=2019&cust=us&lid=0
CRM earnings analysis
#Earnings — $CRM reports Monday at the close. Below are details on earnings one-day moves over the last 12 quarters. (5-day moves are not significantly different)
Nov. 27, 2018 AC +10.27%
Aug. 29, 2018 AC -1.71%
May 29, 2018 AC +1.90%
Feb. 28, 2018 AC +2.73%
Nov. 21, 2017 AC -1.81%
Aug. 22, 2017 AC +0.12%
May 18, 2017 AC -0.39%
Feb. 28, 2017 AC +3.02%
Nov. 17, 2016 AC +3.43%
Aug. 31, 2016 AC -4.41% Biggest DOWN
May 18, 2016 AC +4.13%
Feb. 24, 2016 AC +11.03% Biggest UP
Avg (+ or -) 3.75%
Bias 2.36%, strong positive bias on earnings.
With stock at 164.00 the data suggests these ranges:
Based on current IV (expected move into Friday per TOS): 153.49 to 174.51
Based on AVERAGE move over last 12 quarters: 157.86 to 170.14
Based on MAXIMUM move over last 12 Q’s (11.0%): 145.91 to 182.09
Open to requests for other symbols.
SPX 1-dte, altered
#SPX1dte I’m still in the early stages of this strategy, and I’m testing ways to vary things up based on market conditions. IV for Monday’s options is only 6.83%, which I think is the lowest I’ve seen this year. Selling the standard .06 delta condor isn’t worth the risk (too cheap). This is when I have gone LONG in the past with mixed success. Today I’m trying a risk/reversal set-up. Mondays have been bullish lately, and in general the market feels pretty stuck in a range, so I don’t fear a big drop yet.
Bought to open $SPX March 4th 2820/2830 cal spreads for .45 (long delta .06, SPX 2795)
Sold to Open $SPX March 4th 2770/2750 put spreads for .75 (short delta .11, SPX 2796)
If nothing happens, I’ll make .30. But hopefully we’ll have an early rally toward my call spread and I can close for a profit while put spread expires.
VMW starting to come in
#Earnings #DoubleCalendar Closed first batch of $VMX Mar01/Mar08 dbl cals for 2.90. Bought yesterday for 1.30. These higher priced stocks always produce the bigger profits. This winner will easily overtake the small losses in MNST and BUD for the week.
Earnings trades
#Earnings Sold to close $BUD 75 call calendar for .07. This one moved farther up today, so profit’s not possible. Closed the call side to avoid assignment.
$MNST I’ll get a small profit out of the 62 calendar, but not moving down enough to make the ATM 58 #DoubleCalendar work. Will be closing the call side to avoid assignment, but will wait until later in case we get a drop.
$VMW This one moved up, but should still turn a small profit.
$SPLK #BrokenWingButterfly Looking for this to rise into the close so I can take profit. It passed through my center strike in the morning but volatility was too wild to close with enough profit.
SPY sales
#LongCalls Sold to close $SPY March 8th 277.5 long calls for 4.00. Bought for 1.72. Still holding one last batch.
VMW earnings analysis
#Earnings — $VMW reports tonight. Below are details on earnings one-day moves over the last 12 quarters.
Nov. 29, 2018 AC +3.62%
Aug. 23, 2018 AC -2.19%
May 31, 2018 AC +6.14%
March 1, 2018 AC -5.91%
Nov. 30, 2017 AC +3.60%
Aug. 24, 2017 AC +1.89%
June 1, 2017 AC -2.09%
Jan. 26, 2017 AC +3.49%
Oct. 26, 2016 AC +3.35%
July 18, 2016 AC +9.04%
April 19, 2016 AC +13.73% Biggest UP
Jan. 26, 2016 AC -9.82% Biggest DOWN
Avg (+ or -) 5.41%
Bias 2.07%, strong positive bias on earnings.
With stock at 173.00 the data suggests these ranges:
Based on current IV (expected move into Friday per TOS): 163.23 to 182.77
Based on AVERAGE move over last 12 quarters: 163.65 to 182.35
Based on MAXIMUM move over last 12 Q’s (13.7%): 149.25 to 196.75
Open to requests for other symbols.
SPX 1-dte
#SPX1dte Sold to Open $SPX March 1st 2740/2760-2810/2830 condors for 1.10. Going a bit aggressive with .08 deltas on the shorts… Fridays have been mellow lately. (IV: 9.5%, SPX 2787)
Expiring: Feb 28th condors, sold yesterday for .80.
SPLK trade
#Earnings #BrokenWingButterfly This trade worked last quarter, and with positive bias in $SPLK I like it. Still, the stock is a bit extended so I see it as riskier than last quarter.
Bought $SPLK March 1st 137/142/145 Broken wing CALL butterfly for 1.20. buy (1) 137, sell (2) 142, buy (1) 145
(stock at 137.00 at time of trade)
Trade has no upside risk. Max loss, debit paid (1.20). Max gain: 3.80 (if pin at 142). Capped gain: .80 if above 145. Goal will be to close for profit during the day when price passes through the 142 area. If it explodes higher or gaps lower, trade can be ignored for exercise to cancel out (or, if above 145, close all to avoid exercise fees). BUT if price ends day between 137 and 145, you WILL BE ASSIGNED if you don’t close the necessary options. I can help if you follow this trade.
FL earnings analysis
#Earnings — $FL reports tonight. Below are details on earnings one-day moves over the last 12 quarters.
Nov. 20, 2018 AC +14.90%
Aug. 24, 2018 BO -9.17%
May 25, 2018 BO +20.15%
March 2, 2018 BO -12.72%
Nov. 17, 2017 BO +28.16% Biggest UP
Aug. 18, 2017 BO -27.92% Biggest DOWN
May 19, 2017 BO -16.65%
Feb. 24, 2017 BO +9.37%
Nov. 18, 2016 BO +0.60%
Aug. 19, 2016 BO +11.04%
May 20, 2016 BO -6.45%
Feb. 26, 2016 BO -4.31%
Avg (+ or -) 13.45%
Bias 0.58%, small positive bias on earnings.
With stock at 58.50 the data suggests these ranges:
Based on current IV (expected move into Friday per TOS): 52.30 to 64.70
Based on AVERAGE move over last 12 quarters: 50.63 to 66.37
Based on MAXIMUM move over last 12 Q’s (17.9%): 42.03 to 74.97
Open to requests for other symbols.
SPLK earnings analysis
#Earnings — $SPLK reports tonight. Below are details on earnings one-day moves over the last 12 quarters.
Nov. 29, 2018 AC +9.93%
Aug. 23, 2018 AC +14.81%
May 24, 2018 AC -5.20%
March 1, 2018 AC +9.26%
Nov. 16, 2017 AC +17.89% Biggest UP
Aug. 24, 2017 AC +8.47%
May 25, 2017 AC -6.97%
Feb. 23, 2017 AC -3.23%
Nov. 29, 2016 AC +0.41%
Aug. 25, 2016 AC -10.10% Biggest DOWN
May 26, 2016 AC +2.56%
Feb. 25, 2016 AC +7.73%
Avg (+ or -) 8.05%
Bias 3.80%, strong positive bias on earnings.
With stock at 138.00 the data suggests these ranges:
Based on current IV (expected move into Friday per TOS): 126.42 to 149.58
Based on AVERAGE move over last 12 quarters: 126.90 to 149.10
Based on MAXIMUM move over last 12 Q’s (17.9%): 113.31 to 162.69
Open to requests for other symbols.
SQ calls, earnings
#Earnings #LongLEAPs #SyntheticCoveredCalls
Sold $SQ March 1st 85 calls for 1.08. Against my 2020 110 long call LEAPs.
SPX 1-dte
#SPX1dte Sold to Open $SPX Feb 28th 2735/2755-2820/2835 condors for .80. (IV 10.1%, SPX 2794)
BUD trade and earnings analysis
#Earnings — Bought to open $BUD Mar01/Mar08 75 #DoubleCalendar for .48. Looking at the daily chart, BUD is not the king of big moves. I’ve said it all.
$BUD reports tomorrow morning. Below are details on earnings one-day moves over the last 12 quarters.
Oct. 25, 2018 BO -9.37% Biggest DOWN
July 26, 2018 BO -5.02%
May 9, 2018 BO -0.31%
March 1, 2018 BO +3.07%
Oct. 26, 2017 BO -0.94%
July 27, 2017 BO +6.16% Biggest UP
May 4, 2017 BO +5.68%
March 2, 2017 BO -3.72%
Oct. 28, 2016 BO -3.80%
July 29, 2016 BO +2.79%
May 4, 2016 BO -2.98%
Feb. 25, 2016 BO -2.38%
Avg (+ or -) 3.85%
Bias -0.90%, negative bias on earnings.
With stock at 75.00 the data suggests these ranges:
Based on current IV (expected move into Friday per TOS): 71.07 to 78.93
Based on AVERAGE move over last 12 quarters: 72.11 to 77.89
Based on MAXIMUM move over last 12 Q’s (9.4%): 67.97 to 82.03
Open to requests for other symbols.
MNST trade and earnings analysis
#Earnings — Bought to open $MNST Mar01/Mar08 58 #DoubleCalendar for .23, .246, and .25.
$MNST reports tonight. Below are details on earnings one-day moves over the last 12 quarters.
Nov. 7, 2018 AC -3.16%
Aug. 8, 2018 AC +2.65%
May 8, 2018 AC -7.47%
Feb. 28, 2018 AC -14.43% Biggest DOWN
Nov. 8, 2017 AC +1.17%
Aug. 8, 2017 AC -1.14%
May 4, 2017 AC +3.30%
March 1, 2017 AC +12.75% Biggest UP
Nov. 3, 2016 AC -3.55%
Aug. 4, 2016 AC +2.47%
April 29, 2016 BO +12.81%
Feb. 25, 2016 AC -1.74%
Avg (+ or -) 5.55%
Bias 0.31%, small positive bias on earnings.
With stock at 58.00 the data suggests these ranges:
Based on current IV (expected move into Friday per TOS): 54.07 to 61.93
Based on AVERAGE move over last 12 quarters: 54.78 to 61.22
Based on MAXIMUM move over last 12 Q’s (14.1%): 49.63 to 66.37
Open to requests for other symbols.
SPX 1-dte
#SPX1dte Closed $SPX Feb 27th 2755/2735 put spreads for .20. Would have allowed to expire but I have to be away from my desk for a time today. Order in to close the 2820 short calls for .05. Condors sold yesterday for 1.10.
SQ earnings analysis
#Earnings — $SQ reports tonight. Below are details on earnings one-day moves over the last 12 quarters.
Nov. 7, 2018 AC +8.48%
Aug. 8, 2018 AC -11.38%
May 7, 2018 AC +7.84%
Feb. 21, 2018 AC -27.23% Biggest DOWN
Nov. 1, 2017 AC -20.10%
Aug. 2, 2017 AC -1.08%
May 10, 2017 AC +5.58%
Feb. 22, 2017 AC -18.13%
Nov. 4, 2015 AC +9.99%
Aug. 5, 2015 AC +10.00% Biggest UP
May 6, 2015 AC -7.90%
Feb. 26, 2015 AC -6.34%
Avg (+ or -) 11.17%
Bias -4.19%, negative bias on earnings.
With stock at 78.50 the data suggests these ranges:
Based on current IV (expected move into Friday per TOS): 72.38 to 84.62
Based on AVERAGE move over last 12 quarters: 69.73 to 87.27
Based on MAXIMUM move over last 12 Q’s (27.2%): 57.12 to 99.88
Open to requests for other symbols.
AZO closed
#Earnings #IronCondor Bougtht to close $AZO March 1st 940/945 call spreads for .35. Leaving put spread to expire or shorts to close for .05. Condor sold for 2.30 on Monday.
SPX 1-dte
#SPX1dte Sold to Open $SPX 2735/2755-2820/2835 condors for 1.10. (IV: 10.67%, SPX 2796)
PANW earnings analysis
#Earnings — $PANW reports tonight. Below are details on earnings one-day moves over the last 12 quarters.
Nov. 29, 2018 AC -1.76%
Sept. 6, 2018 AC +3.28%
June 4, 2018 BO -0.52%
Feb. 26, 2018 AC +2.31%
Nov. 20, 2017 AC +4.82%
Aug. 31, 2017 AC +10.53%
May 31, 2017 AC +17.20% Biggest UP
Feb. 28, 2017 AC -24.15% Biggest DOWN
Nov. 21, 2016 AC -13.24%
Aug. 30, 2016 AC -7.16%
May 26, 2016 AC -12.36%
Feb. 25, 2016 AC +5.20%
Avg (+ or -) 8.54%
Bias -1.32%, negative bias on earnings.
With stock at 233.00 the data suggests these ranges:
Based on current IV (expected move into Friday per TOS): 217.69 to 248.31
Based on AVERAGE move over last 12 quarters: 213.09 to 252.91
Based on MAXIMUM move over last 12 Q’s (24.2%): 176.73 to 289.27
Open to requests for other symbols.
EOG earnings analysis
#Earnings — $EOG reports tomorrow morning. Below are details on earnings one-day moves over the last 12 quarters.
Nov. 2, 2018 BO -4.24%
Aug. 3, 2018 BO -2.79%
May 3, 2018 AC -1.16%
Feb. 28, 2018 BO -5.16% Biggest DOWN
Nov. 3, 2017 BO +1.50%
Aug. 2, 2017 BO -2.26%
May 8, 2017 AC -0.05%
Feb. 27, 2017 AC -0.93%
Nov. 3, 2016 AC -0.30%
Aug. 4, 2016 AC +7.02% Biggest UP
May 5, 2016 AC -3.17%
Feb. 25, 2016 AC -1.45%
Avg (+ or -) 2.50%
Bias -1.08%, negative bias on earnings.
With stock at 94.50 the data suggests these ranges:
Based on current IV (expected move into Friday per TOS): 90.14 to 98.86
Based on AVERAGE move over last 12 quarters: 92.14 to 96.86
Based on MAXIMUM move over last 12 Q’s (7.0%): 87.87 to 101.13
Open to requests for other symbols.
SPX 4-dte
#SPX1dte As a roll from the stopped spread today: Sold $SPX March 1st 2715/2740/2845/2870 condors for 2.40. If possible I will close with 60% of profit a day or two early. (.10 delta, 12.5% IV, SpX 2801)
SPX 1-dte stopped
#SPX1dte Bought to close $SPX Feb 25th 2815 calls for 2.75. Holding the longs to sell if we go higher.
This is my first loss on a short 1-dte since Jan 22nd. And again, losses are about 1x-3x the wins, so not difficult to make up.