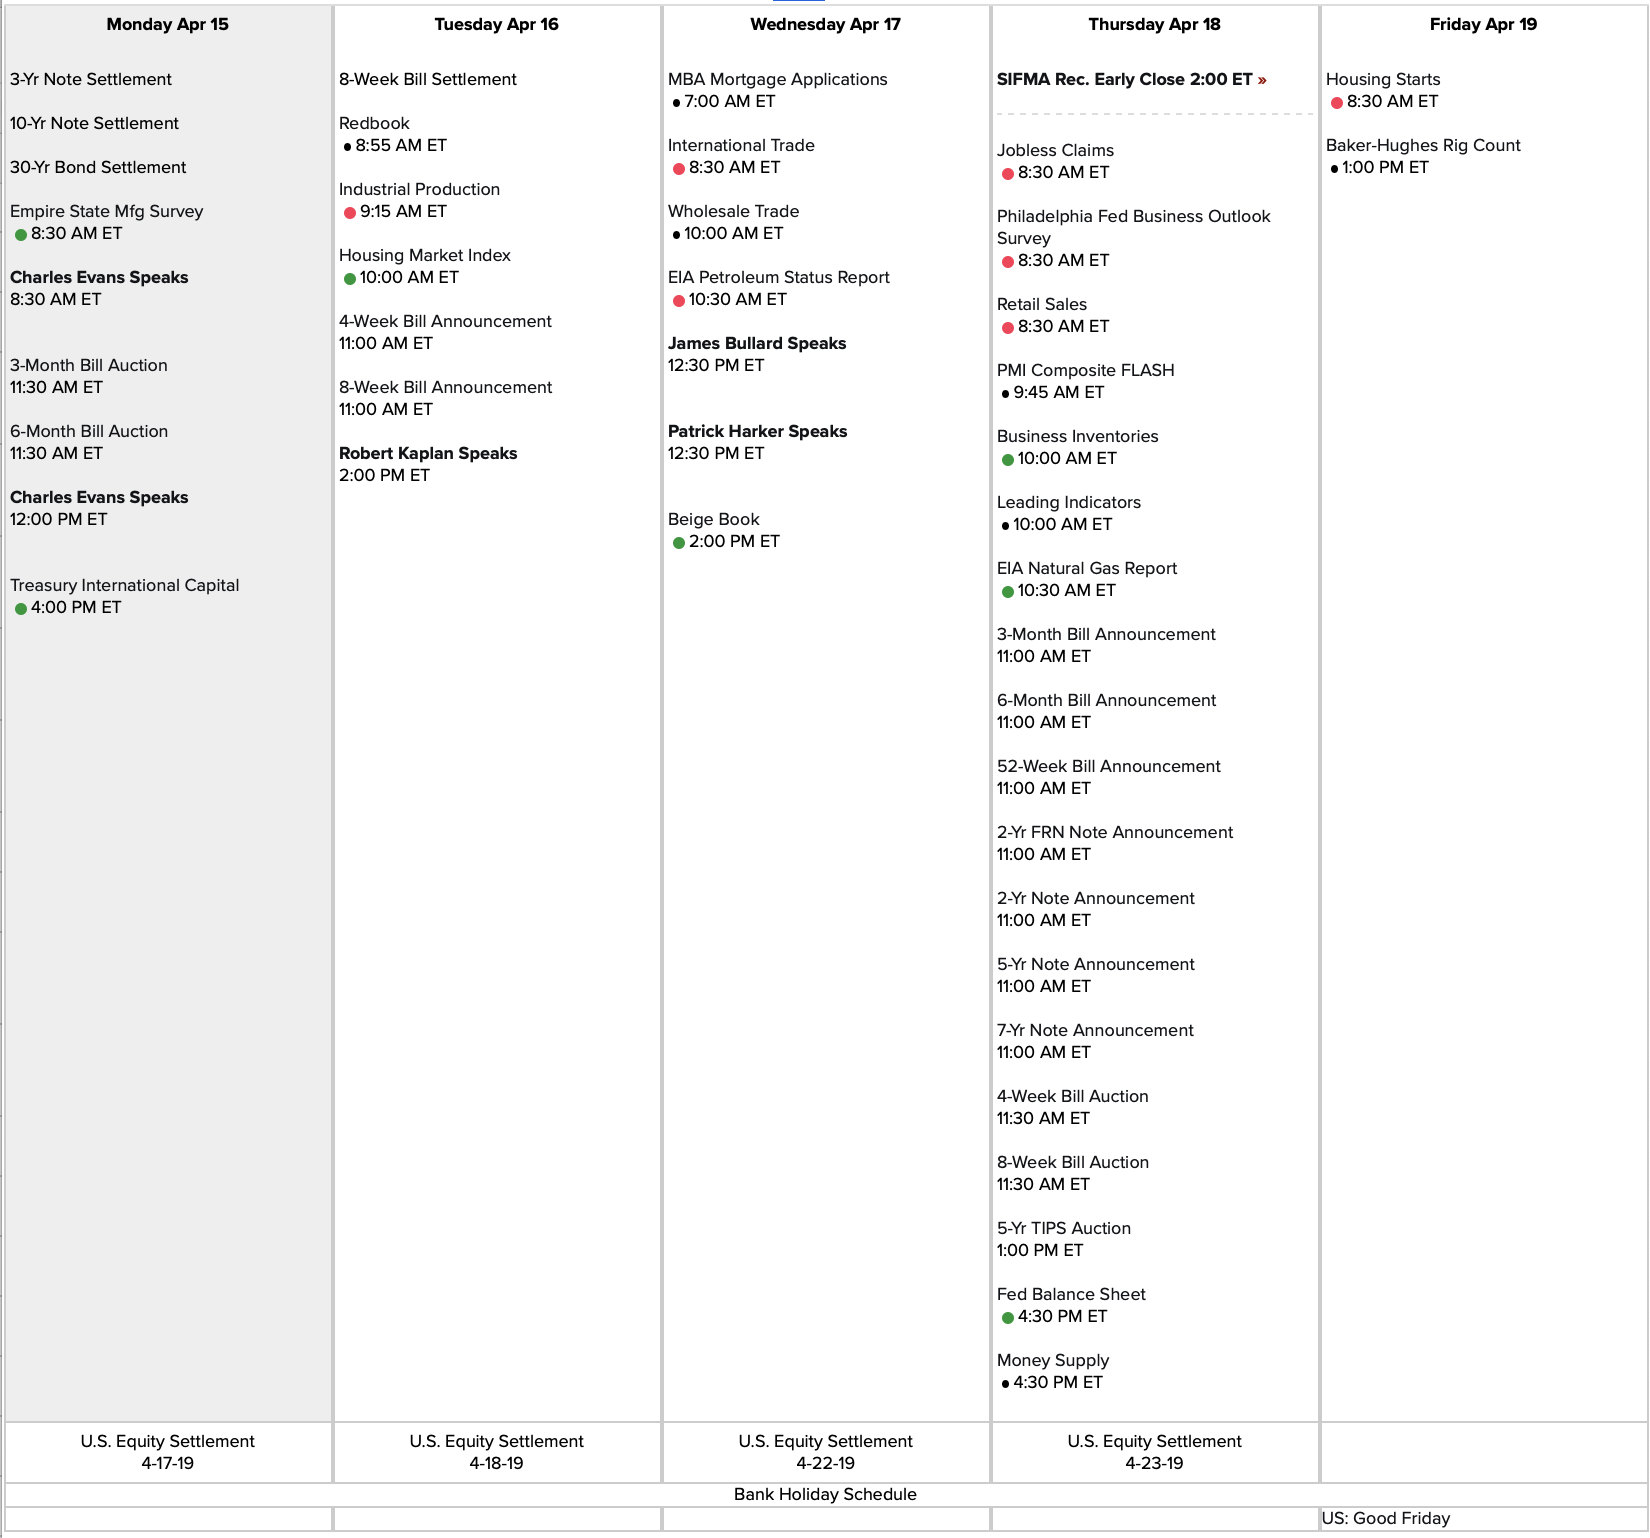
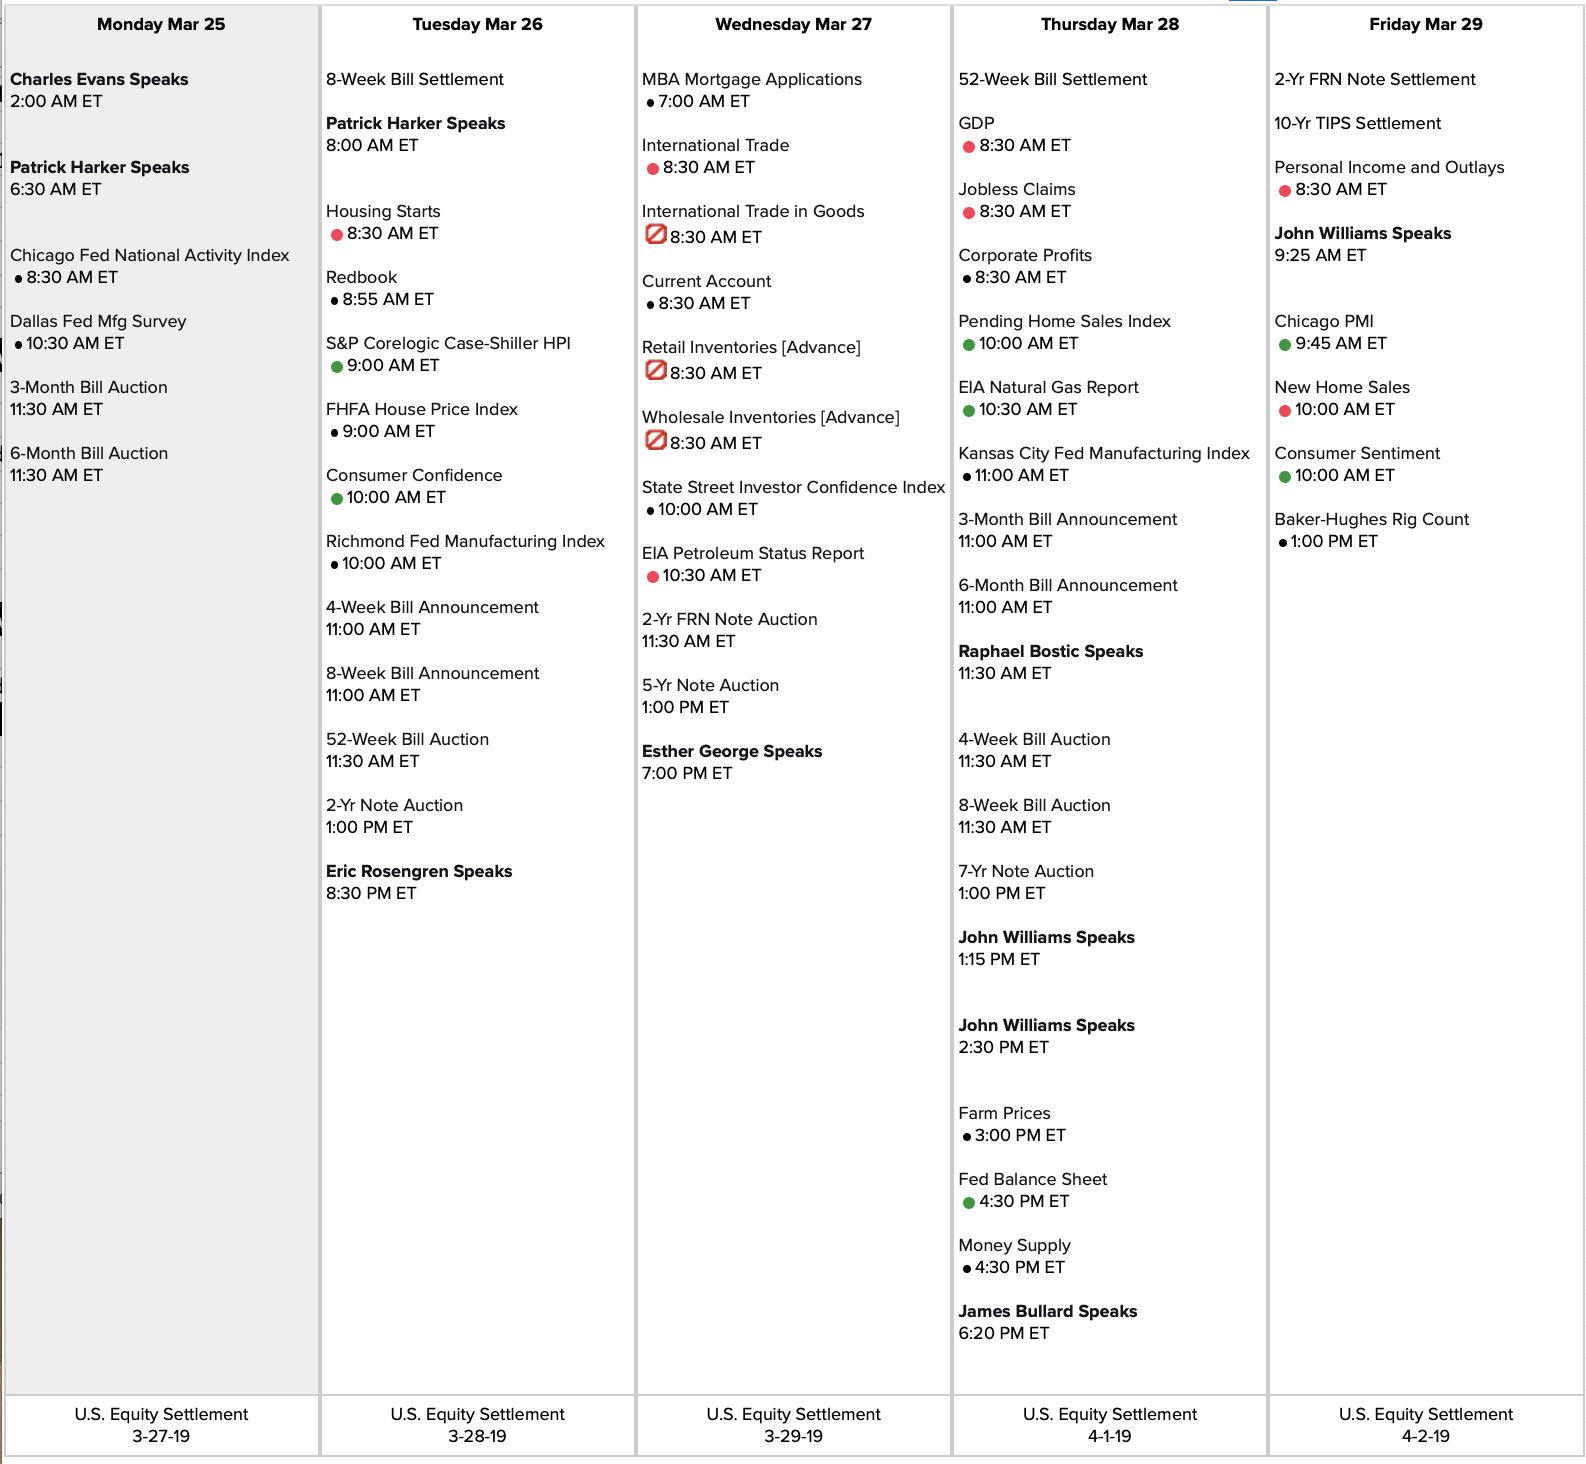
Shortened week with Good Friday holiday.
Link to calendar: https://us.econoday.com/byweek.asp?day=15&month=4&year=2019&cust=us&lid=0
#Earnings $GS reports Monday morning. Below are details on earnings one-day moves over the last 12 quarters.
Since expiration is not until next Friday, I checked 5-day moves and they are slightly bigger than the one-day moves, but not a huge difference.
Jan. 16, 2019 BO +9.54% Biggest UP
Oct. 16, 2018 BO +3.01%
July 17, 2018 BO -0.18%
April 17, 2018 BO -1.64%
Jan. 17, 2018 BO -1.86%
Oct. 17, 2017 BO -2.60%
July 18, 2017 BO -2.59%
April 18, 2017 BO -4.71% Biggest DOWN
Jan. 18, 2017 BO -0.61%
Oct. 18, 2016 BO +2.14%
July 19, 2016 BO -1.17%
April 19, 2016 BO +2.28%
Avg (+ or -) 2.69%
Bias 0.13%, no significant bias on earnings.
With stock at 207.50 the data suggests these ranges:
Based on current IV (expected move into Friday per TOS): 197.93 to 217.07
Based on AVERAGE move over last 12 quarters: 201.91 to 213.09
Based on MAXIMUM move over last 12 Q’s (9.5%): 187.70 to 227.30
Based on DOWN max only (-4.7%): 197.73
Open to requests for other symbols.
#SPX1dte Since I sold Monday’s condor yesterday, selling today’s today.
Sold $SPX Apr 12th 2865/2885-2920/2935 condors for .80. Tight leash… if we get a face-blasting rally I’ll back out.
#VIXIndicator With a $VIX close at 13.54 or lower today, a”minor” upside warning will fire, reaffirming market’s upside bias in the absence of any significant pullback materializing. Should mean another leg higher next week.
#SPX1ste Sold $SPX Apr 15th 2830/2850-2920/2940 condor for 1.25 (IV 7.23%, SPX 2890)
With low IV and sideways market, placing today’s trade a bit earlier and more aggressively than usual.
#Earnings Sold $PNC Apr 12th 124/127-128/131 #IronCondor for 2.00.
Risking 1.00 to make 2.00. Sightly bearish due to its recent history.
https://www.wsj.com/articles/no-spring-thaw-in-store-for-banks-11554908159
#Earnings $PNC reports tomorrow morning. Below are details on earnings one-day moves over the last 12 quarters.
Comparing 1-point-wide, 3-point-wing #IronCondor trades, PNC comes out with a much better R/R than does $JPM. PNC has a slightly lower average move, but weighted toward downside.
Jan. 16, 2019 BO +0.07%
Oct. 12, 2018 BO -5.58% Biggest DOWN
July 13, 2018 BO +0.23%
April 13, 2018 BO -4.11%
Jan. 12, 2018 BO +0.23%
Oct. 13, 2017 BO -1.12%
July 14, 2017 BO -0.11%
April 13, 2017 BO -0.17%
Jan. 13, 2017 BO +0.72% Biggest UP
Oct. 14, 2016 BO +0.10%
July 15, 2016 BO -0.96%
April 14, 2016 BO -0.56%
Avg (+ or -) 1.16%
Bias -0.94%, negative bias on earnings.
With stock at 128.50 the data suggests these ranges:
Based on current IV (expected move into Friday per TOS): 124.74 to 132.26
Based on AVERAGE move over last 12 quarters: 127.01 to 129.99
Based on MAXIMUM move over last 12 Q’s (5.6%): 121.33 to 135.67
Based on UP max only (+0.7%): 129.43
Open to requests for other symbols.
#Earnings $JPM reports tomorrow morning. Below are details on earnings one-day moves over the last 12 quarters.
Jan. 15, 2019 BO +0.73%
Oct. 12, 2018 BO -1.09%
July 13, 2018 BO -0.45%
April 13, 2018 BO -2.70% Biggest DOWN
Jan. 12, 2018 BO +1.65%
Oct. 12, 2017 BO -0.28%
July 14, 2017 BO -0.91%
April 13, 2017 BO -1.17%
Jan. 13, 2017 BO +0.53%
Oct. 14, 2016 BO -0.32%
July 14, 2016 BO +1.51%
April 13, 2016 BO +4.23% Biggest UP
Avg (+ or -) 1.30%
Bias 0.14%, no significant directional bias on earnings.
With stock at 106.50 the data suggests these ranges:
Based on current IV (expected move into Friday per TOS): 104.08 to 108.92
Based on AVERAGE move over last 12 quarters: 105.12 to 107.88
Based on MAXIMUM move over last 12 Q’s (4.2%): 102.00 to 111.00
Based on DOWN max only (-2.7%): 103.62
Open to requests for other symbols.
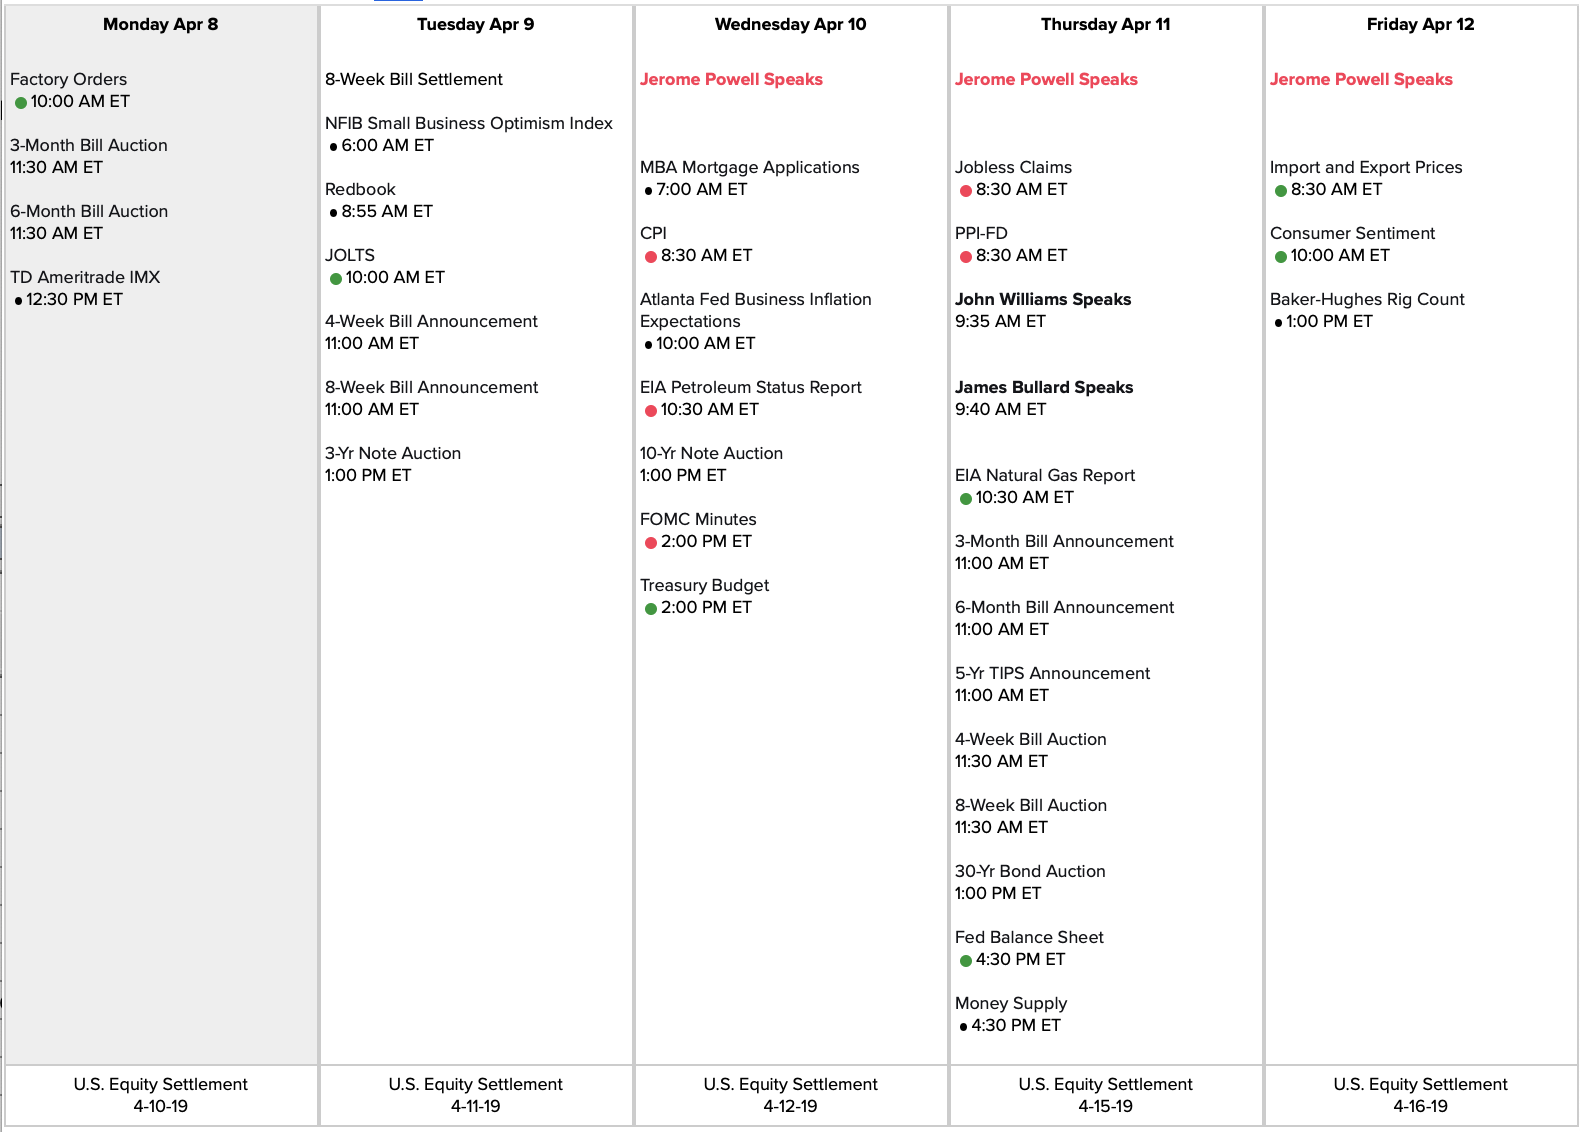
#SPX1dte BTC $SPX April 10th 2900 calls for .10. Closing before FOMC minutes released at 2p ET. Condor sold for .80 yesterday.
#Earnings $BBBY reports tomorrow morning. Below are details on earnings one-day moves over the last 12 quarters.
Jan. 9, 2019 AC +16.55% Biggest UP
Sept. 26, 2018 AC -20.99% Biggest DOWN
June 27, 2018 AC -3.81%
April 11, 2018 AC -19.95%
Dec. 20, 2017 AC -12.49%
Sept. 19, 2017 AC -15.87%
June 22, 2017 AC -12.12%
April 5, 2017 AC +3.38%
Dec. 21, 2016 AC -9.17%
Sept. 21, 2016 AC +0.74%
June 22, 2016 AC +1.50%
April 6, 2016 AC +0.32%
Avg (+ or -) 9.74%
Bias -5.99%, strong negative bias on earnings.
With stock at 18.90 the data suggests these ranges:
Based on current IV (expected move into Friday per TOS): 16.52 to 21.28
Based on AVERAGE move over last 12 quarters: 17.06 to 20.74
Based on MAXIMUM move over last 12 Q’s (13.1%): 14.93 to 22.87
Based on UP max only (+16.6%): 22.03
Open to requests for other symbols.
#SPX1dte Sold $SPX Apr 10th 2825/2845-2900/2925 condors for .80. (IV: 8.99%, SPX: 2877)
#ShortPuts #PieTrades Sold $T July 32 puts for 1.50.
#Earnings $DAL reports tomorrow morning. Below are details on earnings one-day moves over the last 12 quarters.
Jan. 15, 2019 BO +0.16%
Oct. 11, 2018 BO +3.56%
July 12, 2018 BO +1.78%
April 12, 2018 BO +2.93%
Jan. 11, 2018 BO +4.76% Biggest UP
Oct. 11, 2017 BO +0.70%
July 13, 2017 BO -1.76% Biggest DOWN
April 12, 2017 BO -0.52%
Jan. 12, 2017 BO -1.06%
Oct. 13, 2016 BO +1.88%
July 14, 2016 BO +3.58%
April 14, 2016 BO +0.93%
Avg (+ or -) 1.97%
Bias 1.41%, strong positive bias on earnings.
With stock at 57.00 the data suggests these ranges:
Based on current IV (expected move into Friday per TOS): 54.79 to 59.21
Based on AVERAGE move over last 12 quarters: 55.88 to 58.12
Based on MAXIMUM move over last 12 Q’s (13.1%): 54.29 to 59.71
Based on DOWN max only (-1.8%): 56.00
Open to requests for other symbols.
#SPX1dte Another roll: Sold $SPX Apr 17th (weekly) 2815/2840-2925/2950 condors for 4.95.(IV: 10.38%, SPX: 2893)
Also expiring today: Apr 8th 2835/2855-2915/2925 condors, sold Friday for .70.
#SPX1dte Sold $SPX Apr 8th 2835/2855-2915/2925 condors for .70 (IV: 6.21%, SPX: 2889)
$SPY – Initial Claims Suggest Significant New Highs For S&P 500 https://t.co/QPUL5fNze8
— Seeking Alpha (@SeekingAlpha) April 5, 2019
#ShortPuts #PieTrades BTC $T April 18th 31 puts for .15. Sold for 1.60 on Jan 22nd.
Replicated my Oct 24th-Jan 18th successful trade. This time it was Jan 22nd to April 18th.
Assignment would be fine on a high-div tock, becomes a PieTrade with covered calls.
I will look to sell July puts in the coming days.
#Jobs Improvement over February lows
+196,000 non-farm payroll jobs, vs. 175K expected
Unemployment at 3.8%, unchanged
U6 unemployment at 7.3%, unchanged
Wages up 0.1%, 3.2% year over year
Labor force participation 63.0%, down by 0.2
February revised up from 20K to 33K
January revised up from 311K to 312K
#SPX1dte Sold $SPX Apr 5th 2825/2845-2910/2925 condors for .95 (IV: 10.36% SPX: 2877)
#Earnings #DoubleCalendar Sold to close $STZ Apr5/Apr12 180 dbl cals for .51 (avg price). Bought yesterday for .785
As I commented below, today’s action is an indication that earnings released in the AM may tend to have more intraday movement than those that report the night before. This is because the conference call will start or continue into the trading hours. For reports in the afternoon, all of the info has been absorbed over night and that could mean less movement.
So, waiting this morning was not such a good idea, because with the perfect opening we need to grab the profit before the ongoing conference call affects the price.
#SPX1dte #VIXIndicator No upside warning today so I’m selling both sides:
Sold $SPX April 12th 2800/2825-2910/2935 condors for 6.30 (IV 11.82%, SPX 2875)
#Webinars #Earnings #DoubleCalendar Please include any questions in the comments below!
#Earnings #DoubleCalendar Bought to Open $STZ Apr05/Apr12 180 dbl cal for .78 & .80.
Link for today’s webinar is below!
Topic: Double Calendars on Earnings
Time: Apr 3, 2019 11:00 AM Pacific Time (US and Canada)
Join Zoom Meeting
https://zoom.us/j/558920979
#Webinar I’ll be holding a webinar later today on #DoubleCalendar earnings trades. It will be either live or recorded, depending on how smoothly I can get the software operating. Either way, it WILL be recorded for future viewing, so don’t worry if you miss it. Shooting for 2pm ET, 11am PT.
#Earnings $STZ reports tomorrow morning. Below are details on earnings one-day moves over the last 12 quarters.
Jan. 9, 2019 BO -12.41% Biggest DOWN
Oct. 4, 2018 BO +5.38%
June 29, 2018 BO -1.78%
March 29, 2018 BO +5.31%
Jan. 5, 2018 BO -0.21%
Oct. 5, 2017 BO +5.41%
June 29, 2017 BO +9.75%
April 6, 2017 BO +9.60%
Jan. 5, 2017 BO +0.47%
Oct. 5, 2016 BO +0.07%
June 30, 2016 BO +6.37%
April 6, 2016 BO +13.07% Biggest UP
Avg (+ or -) 5.82%
Bias 3.42%, strong positive bias on earnings.
With stock at 177.50 the data suggests these ranges:
Based on current IV (expected move into Friday per TOS): 167.70 to 187.30
Based on AVERAGE move over last 12 quarters: 167.17 to 187.83
Based on MAXIMUM move over last 12 Q’s (13.1%): 154.30 to 200.70
Based on DOWN max only (-12.4%): 155.47
Open to requests for other symbols.
#SPX1dte Closed Z$SPX Apr 3rd 2885/2895 all spreads for 1.60. Condors sold yesterday for 1.15, so .45 loss. Too tight with the low IV.
#SPX1dte Sold $SPX April 3rd 2820/2840-2885/2895 condors for 1.15. (IV 8.55% SPX 2866)
Also BTC Apr 5th 2865/2890 call spreads for 9.70. I’m eating a day to roll this. If we get $VIX closes below 13.55 today and tomorrow, it should mean a push in the short-term toward 2900. I’ll sell aggressively based on tomorrow’s action.
#Earnings $SIG reports tomorrow morning. Below are details on earnings one-day moves over the last 12 quarters.
I have never traded this, but it is a big mover
Dec. 6, 2018 BO -18.04%
Aug. 30, 2018 BO +23.84% Biggest UP
June 6, 2018 BO +18.39%
March 14, 2018 BO -20.22%
Nov. 21, 2017 BO -30.39% Biggest DOWN
Aug. 24, 2017 BO +16.66%
May 25, 2017 BO -7.75%
March 9, 2017 BO +8.72%
Nov. 22, 2016 BO +2.14%
Aug. 25, 2016 BO -12.62%
May 26, 2016 BO -10.49%
March 24, 2016 BO +2.88%
Avg (+ or -) 14.35%
Bias -2.24%, negative bias on earnings.
With stock at 27.50 the data suggests these ranges:
Based on current IV (expected move into Friday per TOS): 23.31 to 31.69
Based on AVERAGE move over last 12 quarters: 23.56 to 31.44
Based on MAXIMUM move over last 12 Q’s (30.4%): 19.14 to 35.86
Based on UP max only (+23.8%): 34.06
Open to requests for other symbols.
#SPXdte Pressured on the upside this week… BTC $SPX April 1st 2855/2875 call spreads for 4.40. Condors sold Thursday for 1.00. Should have closed this Friday.
Also rolling the April 5th call spread I have. No trade yet.
I’m going to start watching Market Tide indicator more to help guide these trades. I’m putting up /ES 1-hour and 10-min charts, since these are mostly 1-day trades with a few that are 1-5 weeks out.
Anyone prefer $SPY to /ES for the Tide?
#SPX1dte Sold $SPX April 1st 2790/2770 put spreads for .45. This is a roll-up from the puts closed this morning. I’m leaving the 2855/2875 call spread in place.
Expiring: March 29th 2770/2790-2845/2860 condors, sold this morning for 1.10.
#Earnings $CCL #IronButterfly from Monday a flop… exercising for loss of 1.25 on the sale for 2.25.
#Jobs Report is Friday morning
Link to calendar: https://us.econoday.com/byweek.asp?day=1&month=4&year=2019&cust=us&lid=0
#SPX1dte Closed $SPX April 1st 2740/2720 put spreads for .10. Sold as part of condor yesterday… condor for 1.00, put side was .41 of that.
#LongLEAPs #SyntheticCoveredCalls Sold $SQ Apr 12th 78.5 calls for 1.05
#SPX1dte Since I messed up and sold Monday’s expiration yesterday, I’m selling TODAY’s expiration now.
Sold $SPX March 29th 2770/2790-2845/2860 condors for 1.10. Expires tonight. (IV 12.71% SPX 2824)
IV is high enough that it isn’t too risky to get decent premium. From a delta standpoint I’m being more aggressive on the call side, but we haven’t seen any blistering rallies on Friday afternoons lately.
#SPX1dte Sold $SPX April 1st 2720/2740-2855/2875 condors for 1.00 (IV: 11.32%, SPX 2811). Meant to sell March 29th but I sold Monday’s.
#SPX1dte I got punched around pretty bad in March with a couple of 1-dte breaches and failed attempts at rolling. This reverse roll was the worst; had I left the call spread it would have ben fine. Thank God for strong months like February to eclipse small losing months like March.
BTC $SPX March 29th 2820/2800 put spreads for 8.50. Sold for 4.80 on March 19th as a #ReverseRoll.
#Earnings $RH reports tonight. Below are details on earnings one-day moves over the last 12 quarters.
Always a big mover. Expected move is less than average move, meaning options are underpriced.
Dec. 3, 2018 AC +10.90%
Sept. 4, 2018 AC -13.06%
June 11, 2018 AC +30.54%
March 27, 2018 AC +22.48%
Dec. 5, 2017 AC +0.79%
Sept. 6, 2017 AC +44.75%
June 1, 2017 AC -25.69%
March 28, 2017 AC +14.94%
Dec. 8, 2016 AC -18.13%
Sept. 8, 2016 AC +3.08%
June 8, 2016 AC -21.23%
March 29, 2016 AC +3.97%
Avg (+ or -) 17.46%
Bias 4.45%, positive bias on earnings.
With stock at 130.00 the data suggests these ranges:
Based on current IV (expected move into Friday per TOS): 111.45 to 148.55
Based on AVERAGE move over last 12 quarters: 107.30 to 152.70
Based on MAXIMUM move over last 12 Q’s (44.8%): 71.83 to 188.18
Based on DOWN max only (-25.7%): 96.60
Open to requests for other symbols.
#SPX1dte Bought to close $SPX March 27th 2755 short puts for .10. Allowing remainder to expire. Condors sold yesterday for 1.20.
#CoveredCalls Sold to Open #INTC Apr 26th 54 covered calls for 1.61. These expire before the ex-div. Earnings date not confirmed, so it could be before or after this expiry.
#Earnings $FIVE reports tonight. Below are details on earnings one-day moves over the last 12 quarters.
This stock is one of the most historically bullish movers on earnings.
Dec. 6, 2018 BO -2.66%
Sept. 6, 2018 AC +13.31%
June 6, 2018 AC +21.86%
March 21, 2018 AC +4.20%
Nov. 30, 2017 AC -0.46%
Aug. 30, 2017 AC -3.45%
June 1, 2017 AC +0.50%
March 22, 2017 AC +10.80%
Dec. 1, 2016 AC +9.87%
Aug. 31, 2016 AC -1.14%
June 2, 2016 AC +2.07%
March 22, 2016 AC +6.81%
Avg (+ or -) 6.43%
Bias 5.14%, strong positive bias on earnings.
With stock at 118.50 the data suggests these ranges:
Based on current IV (expected move into Friday per TOS): 108.40 to 128.60
Based on AVERAGE move over last 12 quarters: 110.88 to 126.12
Based on MAXIMUM move over last 12 Q’s (21.9%): 92.60 to 144.40
Based on DOWN max only (-3.5%): 114.41
Open to requests for other symbols.
#Earnings $LULU reports tonight. Below are details on earnings one-day moves over the last 12 quarters.
Dec. 6, 2018 AC -13.36%
Aug. 30, 2018 AC +13.08%
May 31, 2018 AC +16.31%
March 27, 2018 AC +9.21%
Dec. 6, 2017 AC +6.42%
Aug. 31, 2017 AC +7.19%
June 1, 2017 AC +11.54%
March 29, 2017 AC -23.43%
Dec. 7, 2016 AC +15.04%
Sept. 1, 2016 AC -10.55%
June 8, 2016 BO +4.90%
March 30, 2016 BO +10.71%
Avg (+ or -) 11.81%
Bias 3.92%, positive bias on earnings.
With stock at 144.550 the data suggests these ranges:
Based on current IV (expected move into Friday per TOS): 130.30 to 158.70
Based on AVERAGE move over last 12 quarters: 127.43 to 161.57
Based on MAXIMUM move over last 12 Q’s (23.4%): 110.64 to 178.36
Based on UP max only (+16.3%): 168.07
Open to requests for other symbols.
#LongLEAPs #SyntheticCoveredCalls BTC $SQ Mar 29th 79.5 calls for .05. Sold for .95 last Tuesday.
#SPX1dte Sold $SPX Mar 27th 2735/2755/2840/2855 condors for 1.20. (IV: 13.97%, SPX 2806)
Also, BTC March 29th 2860/2885 call spreads for 1.05. Sold for 3.75 on Friday.
#ContangoETFs Sold to Open $NUGT Jan 2020 40 calls for 2.10. Took over a month since it last peaked, but patience can be a virtue with these levered suckers.
#Earnings — I’m selling the CCL Mar 29th 53/56.5/60 #IronButterfly. Trying for 2.30, but will likely have to go lower. Not a big mover… its only large move was in December during the Christmas dive.
$CCL reports tomorrow morning. Below are details on earnings one-day moves over the last 12 quarters.
Dec. 20, 2018 BO -9.48% Biggest DOWN
Sept. 27, 2018 BO -4.83%
June 25, 2018 BO -7.85%
March 22, 2018 BO -1.28%
Dec. 19, 2017 BO +2.29%
Sept. 26, 2017 BO +2.86%
June 22, 2017 BO -1.11%
March 28, 2017 BO +0.66%
Dec. 20, 2016 BO +2.27%
Sept. 26, 2016 BO -1.67%
June 28, 2016 BO +0.20%
March 30, 2016 BO +5.49% Biggest UP
Avg (+ or -) 3.33%
Bias -1.04%, negative bias on earnings.
With stock at 56.50 the data suggests these ranges:
Based on current IV (expected move into Friday per TOS): 53.53 to 59.48
Based on AVERAGE move over last 12 quarters: 54.62 to 58.38
Based on MAXIMUM move over last 12 Q’s (9.5%): 51.14 to 61.86
Based on UP max only (+5.5%): 59.60
Open to requests for other symbols.
#SPX1dte Filled at 9:14am ET on $SPX Mar 25th 2755/2735 put spreads for .25 (bought to close). Condors sold Friday for 1.00. Order in to close short 2855 calls for .05.
#Earnings #DoubleCalendar
Sold to close $NKE Mar22/Mar29 88 put calendar for .02. Holding long 88 calls into next Friday. Good job by Mort closing the put calendar earlier at .17… I just had too much faith. Double Calendars bought yesterday for .49.
Exercising: $TIF 96/100/102 calls #BrokenWingButterfly for 2.00. Bought yesterday for 1.50. Allowing to exercise on IB for about 70 cents in fees per lot, but closed manually for 2.00 on TOS to avoid $45 in fees.
#SPX1dte Sold $SPX March 25th 2735/2755/2855/2875 condors for 1.00 (IV: 11.64%, SPX: 2809)
#SPX1dte I can say I was not expecting this after yesterday, but clearly volatility is coming back for at least a visit, if not to stay longer this time. Also getting too loose with my rules…. stop level was hit on the first dip. But it never fails that when I follow my rule and dump out for breakeven, the day ends flat. If I let it go, then we end up ITM. This is two big hits in the month, so must change my ways. Thank God Feb was so strong for my accounts!
BTC $SPX March 22nd 2810/2790 put spreads for 5.00. Condors sold for .80 yesterday.
With the warning signal from the VIX looking to sell a week-out call spread. Also have the March 29th 2820/2800 put spreads, now ITM. Will give these until Monday to see if this is a head fake and look to roll it then.
#VIXIndicator It was only a “minor” one so not surprising that it didn’t last long or go far… VIX spiked today to reach 25% higher than yesterday’s close, so that cancels the minor upside warning. A close at 17.04 or higher would be a Downside Warning.
#SPX1dte Sold to Open $SPX March 22 2790/2810/2880/2890 condors for .80. (IV: 10.86%, SPX 2851)
Also, closed $SPX March 22 2780/2755 put spreads for .10. Sold for 3.45 on March 13th.
#Earnings Bought to Open $TIF 96/100/102 #BrokenWingButterfly (calls) for 1.50.
Max loss: $150
Downside breakeven: 97.50
Max profit: 2.50 (if pin at 100)
Capped profit at 102 and above: .50
#Earnings Bought to Open $NKE Mar22/Mar29 88 #DoubleCalendar for .49.
#Earnings — $TIF reports tomorrow morning. Below are details on earnings one-day moves over the last 12 quarters.
Nov. 28, 2018 BO -11.82% Biggest DOWN
Aug. 28, 2018 BO +0.99%
May 23, 2018 BO +23.28% Biggest UP
March 16, 2018 BO -5.06%
Nov. 29, 2017 BO -1.58%
Aug. 24, 2017 BO -1.32%
May 24, 2017 BO -8.70%
March 17, 2017 BO +2.71%
Nov. 29, 2016 BO +3.14%
Aug. 25, 2016 BO +6.40%
May 25, 2016 BO +0.06%
March 18, 2016 BO +2.95%
Avg (+ or -) 5.67%
Bias 0.92%, slight positive bias on earnings.
With stock at 100.00 the data suggests these ranges:
Based on current IV (expected move into Friday per TOS): 93.90 to 106.10
Based on AVERAGE move over last 12 quarters: 94.33 to 105.67
Based on MAXIMUM move over last 12 Q’s (23.3%): 76.72 to 123.28
Based on DOWN max only (-11.8%): 88.18
Open to requests for other symbols.
#Earnings — $NKE reports tonight. Below are details on earnings one-day moves over the last 12 quarters.
Dec. 20, 2018 AC +7.16%
Sept. 25, 2018 AC -1.28%
June 28, 2018 AC +11.12% Biggest UP
March 22, 2018 AC +0.32%
Dec. 21, 2017 AC -2.28%
Sept. 26, 2017 AC -1.91%
June 29, 2017 AC +10.96%
March 21, 2017 AC -7.05% Biggest DOWN
Dec. 20, 2016 AC +0.98%
Sept. 27, 2016 AC -3.77%
June 28, 2016 AC +3.84%
March 22, 2016 AC -3.79%
Avg (+ or -) 4.54%
Bias 1.19%, positive bias on earnings.
With stock at 87.70 the data suggests these ranges:
Based on current IV (expected move into Friday per TOS): 83.36 to 92.04
Based on AVERAGE move over last 12 quarters: 83.72 to 91.68
Based on MAXIMUM move over last 12 Q’s (12.7%): 77.95 to 97.45
Based on DOWN max only (-7.1%): 81.53
Open to requests for other symbols.
The wk after March option expiration (so this wk) has seen the S&P 500 down each of the past 7 yrs. Only wk to do that.
Also, the avg return the past 7 yrs is -1.6% = making it the worst wk of yr.
In fact, the SPX was down 6% this same wk last yr.
Hmm. pic.twitter.com/dwMKQQLoSO
— Ryan Detrick, CMT (@RyanDetrick) March 21, 2019
#Earnings — $WSM reports tonight. Below are details on earnings THIRTY-FOUR-day moves over the last 12 quarters, since the next available options are 29 days from expiry.
Thu 11/15/2018 AC -18.61% Biggest DOWN
Wed 08/22/2018 AC +4.62%
Wed 05/23/2018 AC +26.22% Biggest UP
Wed 03/14/2018 AC -9.19%
Thu 11/16/2017 AC +1.95%
Wed 08/23/2017 AC +15.20%
Wed 05/24/2017 AC -2.43%
Wed 03/15/2017 AC +11.99%
Thu 11/17/2016 AC +0.37%
Wed 08/24/2016 AC -6.61%
Wed 05/25/2016 AC -1.78%
Wed 03/16/2016 AC +0.38%
Avg (+ or -) 8.28%
Bias 1.84%, positive bias on earnings.
With stock at 57.50 the data suggests these ranges:
Based on current IV (expected move into APRIL EXPIRATION per TOS): 51.34 to 63.66
Based on AVERAGE move over last 12 quarters: 52.74 to 62.26
Based on MAXIMUM move over last 12 Q’s (26.2%): 42.42 to 72.58
Based on DOWN max only (-18.6%): 46.80
Open to requests for other symbols.
#SPX1dte Earlier, bought to close $SPX March 20th 2870 short calls for .05.
Just now, BTC 2790/2770 put spreads for .10.
Sold condors yesterday for .75. Chose to not allow to expire as FOMC announcements are unpredictable. Now, however, as we are dead flat, things look safe for expiry.
#Earnings — $MU reports tonight. Below are details on earnings one-day moves over the last 12 quarters.
Dec. 18, 2018 AC -7.91%
Sept. 20, 2018 AC -2.86%
June 20, 2018 AC +0.83%
March 22, 2018 AC -7.99%
Dec. 19, 2017 AC +4.02%
Sept. 26, 2017 AC +8.51%
June 29, 2017 AC -5.11%
March 23, 2017 AC +7.40%
Dec. 21, 2016 AC +12.68% Biggest UP
Oct. 4, 2016 AC -0.56%
June 30, 2016 AC -9.15% Biggest DOWN
March 30, 2016 AC -0.09%
Avg (+ or -) 5.59%
Bias -0.02%, no significant bias on earnings.
With stock at 40.00 the data suggests these ranges:
Based on current IV (expected move into Friday per TOS): 37.05 to 42.95
Based on AVERAGE move over last 12 quarters: 37.76 to 42.24
Based on MAXIMUM move over last 12 Q’s (12.7%): 34.93 to 45.07
Based on DOWN max only (-9.2%): 36.34
Open to requests for other symbols.
#SPX1dte Sold $SPX March 20th 2770/2790-2870/2885 condors for .75. (IV: 12.0%, SPX: 2832).
#SPX1dte I’m reversing my ill-timed decision to sell a call spread yesterday. We’re in an Upside Warning and the market strength is pervasive. I fortunately got a pullback on some China murmurs, so was able to get out at a non-embarrassing price.
Bought to close $SPX Mar 22nd 2860/2885 call spreads for 4.80. Sold yesterday for 3.10
Sold to Open SPX Mar 29th 2820/2800 put spreads for 4.80
#LongLEAPs #SyntheticCoveredCalls Sold $SQ Mar 29th 79.5 calls for .95
#Earnings — $FDX reports tonight. Below are details on earnings one-day moves over the last 12 quarters.
Dec. 18, 2018 AC -12.16% Biggest DOWN
Sept. 17, 2018 AC -5.53%
June 19, 2018 AC -2.69%
March 20, 2018 AC -1.17%
Dec. 19, 2017 AC +3.51%
Sept. 19, 2017 AC +2.08%
June 20, 2017 AC +1.60%
March 21, 2017 AC +2.12%
Dec. 20, 2016 AC -3.33%
Sept. 20, 2016 AC +6.89%
June 21, 2016 AC -4.53%
March 16, 2016 AC +11.83% Biggest UP
Avg (+ or -) 4.79%
Bias -0.12%, no significant bias on earnings.
With stock at 183.00 the data suggests these ranges:
Based on current IV (expected move into Friday per TOS): 172.73 to 193.27
Based on AVERAGE move over last 12 quarters: 174.24 to 191.76
Based on MAXIMUM move over last 12 Q’s (12.2%): 160.75 to 205.25
Based on UP max only (+11.8%): 204.65
Open to requests for other symbols.
#SPX1dte The long spreads I bought Friday didn’t work; was able to sell a few call spreads for .15 and .20 tis morning.
Since I still have a put spread expiring this Friday, I also sold $SPX March 22nd 2860/2885 call spreads for 3.10.
#LongLEAPs #SyntheticCoveredCalls Sold $TQQQ Apr 5th 54 calls for 3.40
#LongLEAPs #SyntheticCoveredCalls
this week I got out of one with profit and stopped on the other.
BTC $SQ March 15th 79 calls for .10 on Thursday. Sold for 1.00 last week.
BTC $TQQQ March 22nd 52 calls for 3.30 on Wednesday. Sold for 1.25 on Monday. Not filled on roll attempt today so will try again on Monday.
#Earnings #DoubleCalendar Sold to close $SFIX Mar 22nd 25 calls for 6.80. Waited since Wednesday for this to bounce meaningfully above 32.00, but it didn’t. So I lost a few extra cents on closing, since I covered the short puts and stock for 6.90.
Sold final batch of $ORCL 53 dub cals for .80. Also legged out of a couple to get .85 total. Never has there been a more perfect Friday for a double calendar. Bought for .23 & .24 yesterday.
Bought to close $INTC Mar 15th 50 #CoveredCalls for 4.30 to avoid assignment. Will replace with new calls or sell stock next week.
#OptionsExpiration
$AVGO 260/265/267.5 #BrokenWingButterfly (calls), exercising for 2.50 credit (bought for 1.70 yesterday).
$ADBE 245/250/280/285 condors, sold for 1.12 yesterday.
$SPX 2755/2775-2835/2855 condors, sold yesterday for .75