
#SPX1dte Sold to Open $SPX Apr 29th 2875/2895-2950/2965 condors for 1.35. (IV: 6.89%, SPX 2929)
Author Archives: Jeff
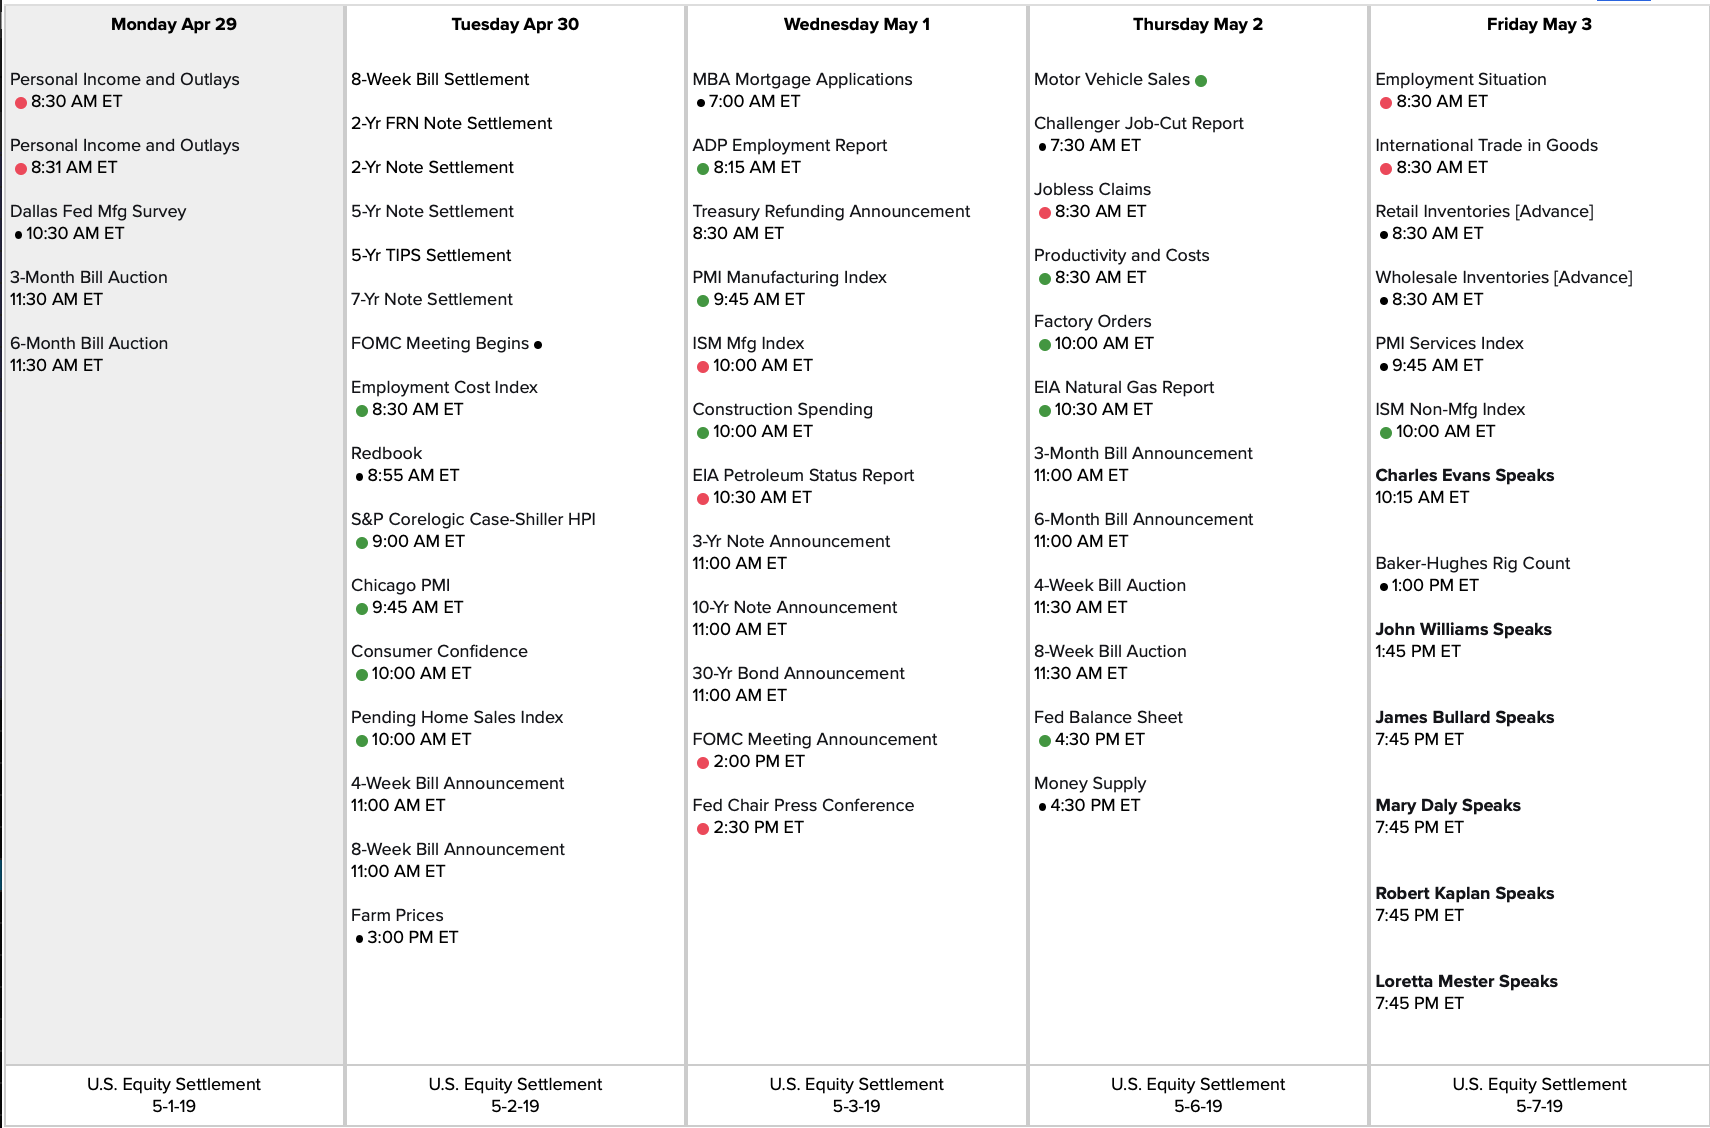
Econ Calendar for week of 4/29/19
#Jobs report is Friday at 8:30am ET
Link to calendar: https://us.econoday.com/byweek.asp?day=29&month=4&year=2019&cust=us&lid=0
SPOT condor
#Earnings Sold to Open $SPOT May 3rd 127/129-145/147 #IronCondor for .96 and .95.
Strikes outside stock’s previous max moves, and risk/reward is just shy of 1:1.
AMZN half closed
#Earnings Bought to close half of my position, $AMZN Apr 26th 1885/1915/1945 #IronButterfly for 13.22. Sold yesterday for 28.15. Getting a bit nervous about this uptrend… I want to give it more chance to come back to 1915, but locking in nice profit on this first batch now in case it keeps going.
SBUX half closed
#Earnings Sold to close half of my position, $SBUX Apr26/May03 77 #DoubleCalendar for .85. Bought yesterday for .30. Waiting on the other half as this may be close to a pin. Same with $AMZN.
SPOT earnings analysis
#Earnings I usually don’t take trades on Monday morning earnings, but this stock has excellent premium and thus far, modest moves. However, its history is short so it could surprise us. That is reflected in the expected move, which is much higher than its historical average move.
Looking at a condor, with wings 2-points wide.
$SPOT reports Monday morning. Below are details on earnings one-day moves over its entire history.
Feb. 6, 2019 BO -2.83%
Nov. 1, 2018 BO -5.69% Biggest DOWN
July 26, 2018 BO +4.40% Biggest UP
May 2, 2018 AC -5.65%
Avg (+ or -) 4.64%
Bias -2.44%, negative bias on earnings.
With stock at 137.00 the data suggests these ranges:
Based on current IV (expected move into Friday per TOS): 125.96 to 148.04
Based on AVERAGE move over last 4 quarters: 130.64 to 143.36
Based on MAXIMUM move over last 4 Q’s (5.7%): 129.20 to 144.80
Based on UP max only (4.4%): 143.03
Open to requests for other symbols.
Profits in the end
Was able to turn $NOC double calendar into a profitable trade by taking assignment and then legging out. Sold the long puts for 16.00 at the open, then closed stock for 280.50.
And on one account that I hadn’t noticed was still open last night on $MMM, did the same thing… sold long puts for 30.00 and covered stock for 191.00, netting 1.00 on the close and a tiny profit on the trade. Better than a loss! And for once, I played the swings right… usually a weakness for me.
FFIV closed
#Earnings Sold to Close $FFIV Apr26/Mar03 165 #DoubleCalendar for 2.10. Bought yesterday for .81 and .82.
Had to pay .02 to close the $MMM 220 put calendar to avoid assignment. Dub Cal bought yesterday for .904
AMZN IB
#Earnings Sold to Open $AMZN Apr 26th 1885/1915/1945 #IronButterfly for 28.15. Risking 1.85 to make hopefully a lot.
SPX 1-dte
#SPX1dte Sold to Open $SPX Apr 26th 2875/2895-2950/2970 condors for 1.00. (IV: 9.36%, SPX: 2929)
SBUX Dub Cal
#Earnings Bought to Open $SBUX Apr26/May03 77 #DoubleCalendar for .30. Partial fill so far. This is a cheap play, must stay within its average range, or at least drift through it tomorrow. I placed a double-sized because of the low cost.
It is the tightest Bid/Ask I have seen on a double calendar, so very liquid.
Dub cal updates
#Earnings
#EarlyAssignment last night on just one (1) $NOC Apr 26th 295 put, part of my #DoubleCalendar. Sold the long May 2nd put for 16.00, and waited through the dip to sell stock for 280.50, netting 1.50 for a profit of .43. The rest of my position will probably not fare so well, but I’ll probably hold again tonight and may be assigned more. (Dub cal bought Wednesday for 1.07.
$MMM has made its biggest earnings drop in at least 17 years, which is as far back as I have records. Nothing you can do about that…. it was the perfect candidate for this strategy, but even “perfect” is no guarantee. I will likely close put side today and not risk early assignment. (bought yesterday for .91)
$FFIV jumped around the center strike in the morning but I got no fill. Now looking for it to recover. (bought yesterday for .81)
Not seeing any great candidates for dub cals today. Maybe $SBUX. Looking at a low risk #IronButterfly on $AMZN.
SBUX earnings analysis
#Earnings $SBUX reports tonight. Below are details on earnings one-day moves over the last 12 quarters.
Jan. 24, 2019 AC +3.62%
Nov. 1, 2018 AC +9.70% Biggest UP
July 26, 2018 AC +1.36%
April 26, 2018 AC -1.71%
Jan. 25, 2018 AC -4.22%
Nov. 2, 2017 AC +2.11%
July 27, 2017 AC -9.24% Biggest DOWN
April 27, 2017 AC -2.02%
Jan. 26, 2017 AC -4.00%
Nov. 3, 2016 AC +1.89%
July 21, 2016 AC +0.52%
April 21, 2016 AC -4.88%
Avg (+ or -) 3.77%
Bias -0.57%, Slight negative bias on earnings.
With stock at 76.75 the data suggests these ranges:
Based on current IV (expected move into Friday per TOS): 73.74 to 79.76
Based on AVERAGE move over last 12 quarters: 73.85 to 79.65
Based on MAXIMUM move over last 12 Q’s (9.7%): 69.31 to 84.19
Based on DOWN max only (-9.2%): 69.66
Open to requests for other symbols.
GRUB earnings analysis
#Earnings $GRUB reports tonight. Below are details on earnings one-day moves over the last 12 quarters.
Feb. 7, 2019 BO -2.00%
Oct. 25, 2018 BO -11.98%
July 25, 2018 BO +23.53%
May 1, 2018 BO -8.39%
Feb. 8, 2018 BO +27.36% Biggest UP
Oct. 25, 2017 BO +11.17%
Aug. 3, 2017 AC +9.05%
April 27, 2017 BO +22.55%
Feb. 8, 2017 BO -3.51%
Oct. 26, 2016 BO -12.69% Biggest DOWN
July 28, 2016 BO +24.10%
May 3, 2016 BO -7.12%
Avg (+ or -) 13.62%
Bias 6.01%, positive bias on earnings.
With stock at 70.00 the data suggests these ranges:
Based on current IV (expected move into Friday per TOS): 60.14 to 79.86
Based on AVERAGE move over last 12 quarters: 60.47 to 79.53
Based on MAXIMUM move over last 12 Q’s (27.4%): 50.85 to 89.15
Based on DOWN max only (-12.7%): 61.12
Open to requests for other symbols.
AMZN earnings analysis
#Earnings $AMZN reports tonight. Below are details on earnings one-day moves over the last 12 quarters.
Jan. 31, 2019 AC -5.38%
Oct. 25, 2018 AC -7.81% Biggest DOWN
July 26, 2018 AC +0.51%
April 26, 2018 AC +3.60%
Feb. 1, 2018 AC +2.87%
Oct. 26, 2017 AC +13.21% Biggest UP
July 27, 2017 AC -2.48%
April 27, 2017 AC +0.71%
Feb. 2, 2017 AC -3.54%
Oct. 27, 2016 AC -5.13%
July 28, 2016 AC +0.82%
April 28, 2016 AC +9.56%
Avg (+ or -) 4.64%
Bias 0.58%, small positive bias on earnings.
With stock at 1,910.00 the data suggests these ranges:
Based on current IV (expected move into Friday per TOS): 1,836.26 to 1,983.74
Based on AVERAGE move over last 12 quarters: 1,821.47 to 1,998.53
Based on MAXIMUM move over last 12 Q’s (13.2%): 1,657.69 to 2,162.31
Based on DOWN max only (-7.8%): 1,760.83
Open to requests for other symbols.
SPX call spread closed
#SPX1dte BTC $SPX Apr 26th 2930/2955 call spread for 5.25. Condors sold Monday for 4.75. Puts will expire. We’ll just forget that ever happened.
TSLA earnings analysis
#Earnings $TSLA reports tonight. Below are details on earnings one-day moves over the last 12 quarters.
Jan. 30, 2019 AC -0.56%
Oct. 24, 2018 AC +9.13%
Aug. 1, 2018 AC +16.18% Biggest UP
May 2, 2018 AC -5.54%
Feb. 7, 2018 AC -8.62% Biggest DOWN
Nov. 1, 2017 AC -6.79%
Aug. 2, 2017 AC +6.50%
May 3, 2017 AC -5.00%
Feb. 22, 2017 AC -6.40%
Oct. 26, 2016 AC +0.87%
Aug. 3, 2016 AC +2.13%
May 4, 2016 AC -4.95%
Avg (+ or -) 6.06%
Bias -0.25%, small negative bias on earnings.
With stock at 260.00 the data suggests these ranges:
Based on current IV (expected move into Friday per TOS): 238.89 to 281.11
Based on AVERAGE move over last 12 quarters: 244.25 to 275.75
Based on MAXIMUM move over last 12 Q’s (16.2%): 217.93 to 302.07
Based on DOWN max only (-8.6%): 237.59
Open to requests for other symbols.
CMG earnings analysis
#Earnings $CMG reports tonight. Below are details on earnings one-day moves over the last 12 quarters.
Feb. 6, 2019 AC +11.35%
Oct. 25, 2018 AC +3.42%
July 26, 2018 AC +5.71%
April 25, 2018 AC +24.44% Biggest UP
Feb. 6, 2018 AC -10.55%
Oct. 24, 2017 AC -14.58% Biggest DOWN
July 25, 2017 AC -2.30%
April 25, 2017 AC +2.38%
Feb. 2, 2017 AC -4.54%
Oct. 25, 2016 AC -9.28%
July 21, 2016 AC +5.83%
April 26, 2016 AC -6.43%
Avg (+ or -) 8.40%
Bias 0.45%, small positive bias on earnings.
With stock at 710.00 the data suggests these ranges:
Based on current IV (expected move into Friday per TOS): 660.25 to 759.75
Based on AVERAGE move over last 12 quarters: 650.35 to 769.65
Based on MAXIMUM move over last 12 Q’s (24.4%): 536.48 to 883.52
Based on DOWN max only (-14.6%): 606.48
Open to requests for other symbols.
NOW earnings analysis – straight up?
#Earnings $NOW reports tonight. Below are details on earnings one-day moves over the last 12 quarters.
12 quarters straight with all UP moves. (go back 13 quarters for the first negative, -15.6%)
Jan. 30, 2019 AC +13.41%
Oct. 24, 2018 AC +1.42%
July 25, 2018 AC +4.60%
April 25, 2018 AC +4.53%
Jan. 31, 2018 AC +2.64%
Oct. 25, 2017 AC +1.21%
July 26, 2017 AC +0.74% Smallest UP
April 26, 2017 AC +3.75%
Jan. 25, 2017 AC +3.61%
Oct. 26, 2016 AC +7.68%
July 27, 2016 AC +4.65%
April 20, 2016 AC +14.06% Biggest UP
Avg (+ or -) 5.19%
Bias 5.19%, ONLY a positive bias on earnings.
With stock at 243.00 the data suggests these ranges:
Based on current IV (expected move into Friday per TOS): 227.32 to 258.68
Based on AVERAGE move over last 12 quarters: 230.38 to 255.62
Based on MAXIMUM move over last 12 Q’s (14.1%): 208.83 to 277.17
Based on Smallest UP only (+0.7%): 244.80
Open to requests for other symbols.
MMM earnings trade and analysis
#Earnings $MMM reports tomorrow morning. Below are details on earnings one-day moves over the last 12 quarters.
Bidding for $MMM Apr26/May03 220 #DoubleCalendar for .90. No fill yet.
Jan. 29, 2019 BO +1.94%
Oct. 23, 2018 BO -4.37%
July 24, 2018 BO +0.92%
April 24, 2018 BO -6.83% Biggest DOWN
Jan. 25, 2018 BO +1.88%
Oct. 24, 2017 BO +5.91% Biggest UP
July 25, 2017 BO -5.05%
April 25, 2017 BO +0.46%
Jan. 24, 2017 BO -1.42%
Oct. 25, 2016 BO -2.94%
July 26, 2016 BO -1.09%
April 26, 2016 BO -1.30%
Avg (+ or -) 2.84%
Bias -0.99%, negative bias on earnings.
With stock at 220.00 the data suggests these ranges:
Based on current IV (expected move into Friday per TOS): 212.48 to 227.52
Based on AVERAGE move over last 12 quarters: 213.75 to 226.25
Based on MAXIMUM move over last 12 Q’s (6.8%): 204.97 to 235.03
Based on DOWN max only (-5.9%): 204.97
Open to requests for other symbols.
FFIV dub cal
#Earnings Bought to Open $FFIV Apr26/May03 165 #DoubleCalendar for .80. Only partial fill so far.
Also going for one on $MMM
Earnings chart updates
$INTC is tomorrow after the bell
$WYNN is still uncertain, currently predicted 4/30 after bell
DHI earnings analysis
#Earnings $DHI reports tomorrow morning. Below are details on earnings one-day moves over the last 12 quarters.
Jan. 25, 2019 BO -2.61%
Nov. 8, 2018 BO -8.96% Biggest DOWN
July 26, 2018 BO +10.87% Biggest UP
April 26, 2018 BO +1.20%
Jan. 31, 2018 BO +1.07%
Nov. 9, 2017 BO +1.27%
July 26, 2017 BO -1.91%
April 20, 2017 BO -2.50%
Jan. 24, 2017 BO +6.61%
Nov. 8, 2016 BO -5.44%
July 21, 2016 BO -0.34%
April 21, 2016 BO +1.14%
Avg (+ or -) 3.66%
Bias 0.03%, no bias on earnings.
With stock at 46.50 the data suggests these ranges:
Based on current IV (expected move into Friday per TOS): 44.24 to 48.76
Based on AVERAGE move over last 12 quarters: 44.80 to 48.20
Based on MAXIMUM move over last 12 Q’s (10.9%): 41.45 to 51.55
Based on DOWN max only (-9.0%): 42.33
Open to requests for other symbols.
FFIV earnings analysis
#Earnings $FFIV reports tonight. Below are details on earnings one-day moves over the last 12 quarters.
Jan. 23, 2019 AC -2.22%
Oct. 24, 2018 AC +6.10%
July 25, 2018 AC +1.07%
April 25, 2018 AC +0.89%
Jan. 24, 2018 AC -5.05%
Oct. 25, 2017 AC +3.97%
July 26, 2017 AC -7.16%
April 26, 2017 AC -7.50%
Jan. 25, 2017 AC -8.25% Biggest DOWN
Oct. 26, 2016 AC +9.57% Biggest UP
July 20, 2016 AC +0.32%
April 20, 2016 AC +5.53%
Avg (+ or -) 4.80%
Bias -0.23%, small positive bias on earnings.
With stock at 165.00 the data suggests these ranges:
Based on current IV (expected move into Friday per TOS): 155.35 to 174.65
Based on AVERAGE move over last 12 quarters: 157.08 to 172.92
Based on MAXIMUM move over last 12 Q’s (9.6%): 149.21 to 180.79
Based on DOWN max only (-8.3%): 151.39
Open to requests for other symbols.
FB earnings analysis
#Earnings $FB reports tonight. Below are details on earnings one-day moves over the last 12 quarters.
Jan. 30, 2019 AC +10.81% Biggest UP
Oct. 30, 2018 AC +3.80%
July 25, 2018 AC -18.96% Biggest DOWN
April 25, 2018 AC +9.06%
Jan. 31, 2018 AC +3.31%
Nov. 1, 2017 AC -2.04%
July 26, 2017 AC +2.91%
May 3, 2017 AC -0.62%
Feb. 1, 2017 AC -1.79%
Nov. 2, 2016 AC -5.63%
July 27, 2016 AC +1.34%
April 27, 2016 AC +7.19%
Avg (+ or -) 5.62%
Bias 0.78%, small positive bias on earnings.
With stock at 182.00 the data suggests these ranges:
Based on current IV (expected move into Friday per TOS): 170.98 to 193.02
Based on AVERAGE move over last 12 quarters: 171.77 to 192.34
Based on MAXIMUM move over last 12 Q’s (19.0%): 147.49 to 216.51
Based on UP max only (10.8%): 201.67
Open to requests for other symbols.
NUGT closing
#ContangoETFs The $NUGT positions I sold in first quarter are starting to close:
BTC $NUGT June 30 call for .15 on Apr 15. Sold for 1.35 on Feb 19th
BTC $NUGT Sept 35 call for .20 yesterday. Sold for 2.06 on Jan 31st.
Looks like $DUST may be coming in to play soon.
EW closed
#Earnings Sold to close $EW Apr26/May03 180 #DoubleCalendar for 2.25. Bought yesterday for 1.03. Third quarter in a row this was the best symbol for this strategy. Unfortunately I only got a partial fill yesterday.
SPX 0-dte
#SPX1dte Since I plumb forgot to sell this yesterday, selling it this morning:
Sold $SPX Apr 24th 2890/2910-2945/2960 condors for .95. Expires today. (IV: 8.02%, SPX 2932)
Sometimes because volatility is higher in the morning, and because morning gaps can be accounted for, this sometimes can be a better approach that selling at the previous day’s close.
SNAPped shut
#Earnings Sold to close $SNAP Apr26 12 #LongStraddle for .75. Bought for 1.95 yesterday. If I don’t get the gap I try to sell quickly while volatility is still high, limiting the loss.
EW earnings analysis
#Earnings $EW reports tonight. Below are details on earnings one-day moves over the last 12 quarters.
Bought to Open $EW Apr26/May03 180 #DoubleCalendar for 1.03. This one has a good risk profile and has been a winner for me two quarters in a row.
Jan. 31, 2019 AC -1.00%
Oct. 23, 2018 AC -5.35%
July 26, 2018 AC -8.50%
April 24, 2018 AC -3.82%
Feb. 1, 2018 AC +3.81%
Oct. 24, 2017 AC -9.55%
July 26, 2017 AC +0.64%
April 25, 2017 AC +10.49% Biggest UP
Feb. 1, 2017 AC -8.45%
Oct. 25, 2016 AC -17.09% Biggest DOWN
July 26, 2016 AC +5.62%
April 26, 2016 AC +0.08%
Avg (+ or -) 6.20%
Bias -2.76%, negative bias on earnings.
With stock at 182.00 the data suggests these ranges:
Based on current IV (expected move into Friday per TOS): 172.02 to 191.98
Based on AVERAGE move over last 12 quarters: 170.72 to 193.28
Based on MAXIMUM move over last 12 Q’s (17.1%): 150.90 to 213.10
Based on UP max only (10.5%): 201.09
Open to requests for other symbols.
EBAY earnings analysis
#Earnings $EBAY reports tonight. Below are details on earnings one-day moves over the last 12 quarters.
Jan. 29, 2019 AC +1.15%
Oct. 30, 2018 AC +5.87%
July 18, 2018 AC -10.11%
April 25, 2018 AC -5.58%
Jan. 31, 2018 AC +13.82% Biggest UP
Oct. 18, 2017 AC -1.79%
July 20, 2017 AC -1.53%
April 19, 2017 AC -3.92%
Jan. 25, 2017 AC +4.99%
Oct. 19, 2016 AC -10.76% Biggest DOWN
July 20, 2016 AC +10.89%
April 26, 2016 AC +3.18%
Avg (+ or -) 6.13%
Bias 0.52%, slight positive bias on earnings.
With stock at 36.75 the data suggests these ranges:
Based on current IV (expected move into Friday per TOS): 34.53 to 38.97
Based on AVERAGE move over last 12 quarters: 34.50 to 39.00
Based on MAXIMUM move over last 12 Q’s (13.8%): 31.67 to 41.83
Based on DOWN max only (-10.8%): 32.80
Open to requests for other symbols.
SNAP straddle
#Earnings Bought to Open $SNAP Apr 26th 12 #LongStraddle for 1.95. I need a 16.3% move to reach break-even points. Avg move on the stock has been 19.8%. Intraday Max Move on the day after earnings is an average of 23.3%.
War machine
#Earnings Yesterday Lockheed, today Northrup. Next trade will be in Stark Industries.
Bought to open $NOC Apr26/May03 295 #DoubleCalendar for 1.09.
NOC earnings analysis
#Earnings I found today’s trades: #DoubleCalender on NOC and #LongStraddle on $SNAP
$NOC reports tomorrow morning. Below are details on earnings one-day moves over the last 12 quarters.
Jan. 31, 2019 BO -1.87%
Oct. 24, 2018 BO -6.00%
July 25, 2018 BO -6.53% Biggest DOWN
April 25, 2018 BO -2.60%
Jan. 25, 2018 BO +3.68%
Oct. 25, 2017 BO +3.64%
July 26, 2017 BO -0.07%
April 26, 2017 BO -0.02%
Jan. 26, 2017 BO -1.68%
Oct. 26, 2016 BO +3.88% Biggest UP
July 27, 2016 BO -0.24%
April 27, 2016 BO +1.68%
Avg (+ or -) 2.66%
Bias -0.51%, slight negative bias on earnings.
With stock at 294.00 the data suggests these ranges:
Based on current IV (expected move into Friday per TOS): 280.91 to 307.09
Based on AVERAGE move over last 12 quarters: 286.19 to 301.81
Based on MAXIMUM move over last 12 Q’s (6.5%): 274.80 to 313.20
Based on UP max only (+3.9%): 305.41
Open to requests for other symbols.
CAT earnings analysis
#Earnings $CAT reports tomorrow morning. Below are details on earnings one-day moves over the last 12 quarters.
Jan. 28, 2019 BO -9.12% Biggest DOWN
Oct. 23, 2018 BO -7.55%
July 30, 2018 BO -1.97%
April 24, 2018 BO -6.20%
Jan. 25, 2018 BO +0.61%
Oct. 24, 2017 BO +4.98%
July 25, 2017 BO +5.87%
April 25, 2017 BO +7.86% Biggest UP
Jan. 26, 2017 BO -0.94%
Oct. 25, 2016 BO -1.75%
July 26, 2016 BO +5.15%
April 22, 2016 BO -0.43%
Avg (+ or -) 4.37%
Bias -0.29%, no significant bias on earnings.
With stock at 142.50 the data suggests these ranges:
Based on current IV (expected move into Friday per TOS): 135.17 to 149.83
Based on AVERAGE move over last 12 quarters: 136.27 to 148.73
Based on MAXIMUM move over last 12 Q’s (9.1%): 129.50 to 155.50
Based on UP max only (7.9%): 153.70
Open to requests for other symbols.
ANTM earnings analysis
#Earnings $ANTM reports tomorrow morning. Below are details on earnings one-day moves over the last 12 quarters.
Jan. 30, 2019 BO +9.11%
Oct. 31, 2018 BO +3.79%
July 25, 2018 BO +0.75%
April 25, 2018 BO +6.15%
Jan. 31, 2018 BO +1.81%
Oct. 25, 2017 BO +5.35%
July 26, 2017 BO -2.93%
April 26, 2017 BO +3.80%
Feb. 1, 2017 BO +4.31%
Nov. 2, 2016 BO +4.74%
July 27, 2016 BO -2.71%
April 27, 2016 BO -1.57%
Avg (+ or -) 3.92%
Bias 2.72%, strong positive bias on earnings.
With stock at 250.00 the data suggests these ranges:
Based on current IV (expected move into Friday per TOS): 236.54 to 263.46
Based on AVERAGE move over last 12 quarters: 240.20 to 259.80
Based on MAXIMUM move over last 12 Q’s (9.1%): 227.23 to 272.78
Based on DOWN max only (-2.9%): 242.68
Open to requests for other symbols.
SNAP earnings analysis – straddle candidate
#Earnings #LongStraddle strategy has been working well lately. Worked on SNAP last quarter and I’ll probably try again.
$SNAP reports tonight. Below are details on earnings one-day moves over it entire history.
Feb. 5, 2019 AC +22.01% 22.01%
Oct. 25, 2018 AC -10.15% -10.15%
Aug. 7, 2018 AC -6.78% -6.78%
May 1, 2018 AC -21.93% -21.93% Biggest DOWN
Feb. 6, 2018 AC +47.58% 47.58% Biggest UP
Nov. 7, 2017 AC -14.61% -14.61%
Aug. 10, 2017 AC -14.08% -14.08%
May 10, 2017 AC -21.45% -21.45%
Avg (+ or -) 19.82%
Bias -2.43%, slight negative bias on earnings.
With stock at 12.00 the data suggests these ranges:
Based on current IV (expected move into Friday per TOS): 10.08 to 13.92
Based on AVERAGE move over last 12 quarters: 9.62 to 14.38
Based on MAXIMUM move over last 12 Q’s (47.6%): 6.29 to 17.71
Based on DOWN max only (-21.9%): 9.37
Open to requests for other symbols.
SPX flying
#SPX1dte As soon as I give up on the move I’ve been waiting for, it happens. Now I’m stuck with a 2930 short expiring this Friday. I will be rolling it, but not sure how or when yet.
LMT and TWTR closing
#Earnings Closed $LMT Apr26/May03 315 #DoubleCalendar for .95 and 1.00. Bought for .765 yesterday. The gap up is a bit much for a calendar to handle, but these higher priced stocks mean higher priced options and more flexibility to close. I was probably too early, but I have been bitten before by waiting
Closed partial of $TWTR Apr 26th long 34 calls for 4.00, 4.40, and 4.50. #LongStraddle bought yesterday for 3.64. Looks like it’s doing its usual thing, gap and run, so I’ll wait to close the rest.
SPX 4-dte
#SPX1dte I am tempting the market to do something. I hope it doesn’t.
Sold $SPX Apr 26th 2850/2875/2930/2955 condors for 4.75.
Expiring today: Apr 22nd 2855/2875/2930/2945 condors, sold Thursday for .80
TWTR straddle
#Earnings Bought to Open $TWTR Apr 26th 34 #LongStraddle for 3.64.
Stock has an average move of 12.1%. I need a 10.7% move to hit breakeven points. Only 4 out of the last 12 moves were less than 10%.
LMT earnings trade & analysis
#Earnings Bought to Open $LMT Apr26/May03 315 #DoubleCalendar for .76 and .77
$LMT reports tomorrow morning. Below are details on earnings one-day moves over the last 12 quarters.
Jan. 29, 2019 BO +1.45%
Oct. 23, 2018 BO -1.66%
July 24, 2018 BO +1.33%
April 24, 2018 BO -6.16% Biggest DOWN
Jan. 29, 2018 BO +1.89%
Oct. 24, 2017 BO -2.36%
July 18, 2017 BO -0.58%
April 25, 2017 BO -2.24%
Jan. 24, 2017 BO -1.77%
Oct. 25, 2016 BO +7.36% Biggest UP
July 19, 2016 BO +1.04%
April 26, 2016 BO +2.58%
Avg (+ or -) 2.54%
Bias 0.07%, no significant bias on earnings.
With stock at 315.00 the data suggests these ranges:
Based on current IV (expected move into Friday per TOS): 302.98 to 327.02
Based on AVERAGE move over last 12 quarters: 307.01 to 322.99
Based on MAXIMUM move over last 12 Q’s (7.4%): 291.82 to 338.18
Based on DOWN max only (-6.2%): 295.60
Open to requests for other symbols.
TWTR earnings analysis
#Earnings $TWTR reports tomorrow morning. Below are details on earnings one-day moves over the last 12 quarters.
In all cases except the second to last date on the list below, TWTR kept advancing in the same direction after one day after earnings. So for the 5-day totals, add about 1-4% more than the one-day numbers below.
Feb. 7, 2019 BO -9.83%
Oct. 25, 2018 BO +15.46%
July 27, 2018 BO -20.54% Biggest DOWN
April 25, 2018 BO -2.36%
Feb. 8, 2018 BO +12.15%
Oct. 26, 2017 BO +18.49% Biggest UP
July 27, 2017 BO -14.12%
April 26, 2017 BO +7.91%
Feb. 9, 2017 BO -12.33%
Oct. 27, 2016 BO +0.63%
July 26, 2016 AC -14.52%
April 26, 2016 AC -16.28%
Avg (+ or -) 12.05%
Bias -2.95%, negative bias on earnings.
With stock at 34.00 the data suggests these ranges:
Based on current IV (expected move into Friday per TOS): 30.56 to 37.44
Based on AVERAGE move over last 12 quarters: 29.90 to 38.10
Based on MAXIMUM move over last 12 Q’s (20.5%): 27.02 to 40.98
Based on UP max only (+18.5%): 40.29
Open to requests for other symbols.
WHR earnings analysis
#Earnings $WHR reports tonight. Below are details on earnings one-day moves over the last 12 quarters.
There is no significant difference between 1-day moves and 5-day moves.
Jan. 28, 2019 AC +9.66% Biggest UP
Oct. 24, 2018 AC +6.78%
July 23, 2018 AC -14.52% Biggest DOWN
April 23, 2018 AC +3.75%
Jan. 24, 2018 AC +2.30%
Oct. 23, 2017 AC -10.54%
July 26, 2017 AC -6.28%
April 25, 2017 BO +3.51%
Jan. 26, 2017 BO -8.54%
Oct. 25, 2016 BO -10.77%
July 22, 2016 BO +2.67%
April 26, 2016 BO -3.55%
Avg (+ or -) 6.91%
Bias -2.13%, negative bias on earnings.
With stock at 140.00 the data suggests these ranges:
Based on current IV (expected move into Friday per TOS): 129.58 to 150.42
Based on AVERAGE move over last 12 quarters: 130.33 to 149.67
Based on MAXIMUM move over last 12 Q’s (14.5%): 119.67 to 160.33
Based on UP max only (+9.7%): 153.52
Open to requests for other symbols.
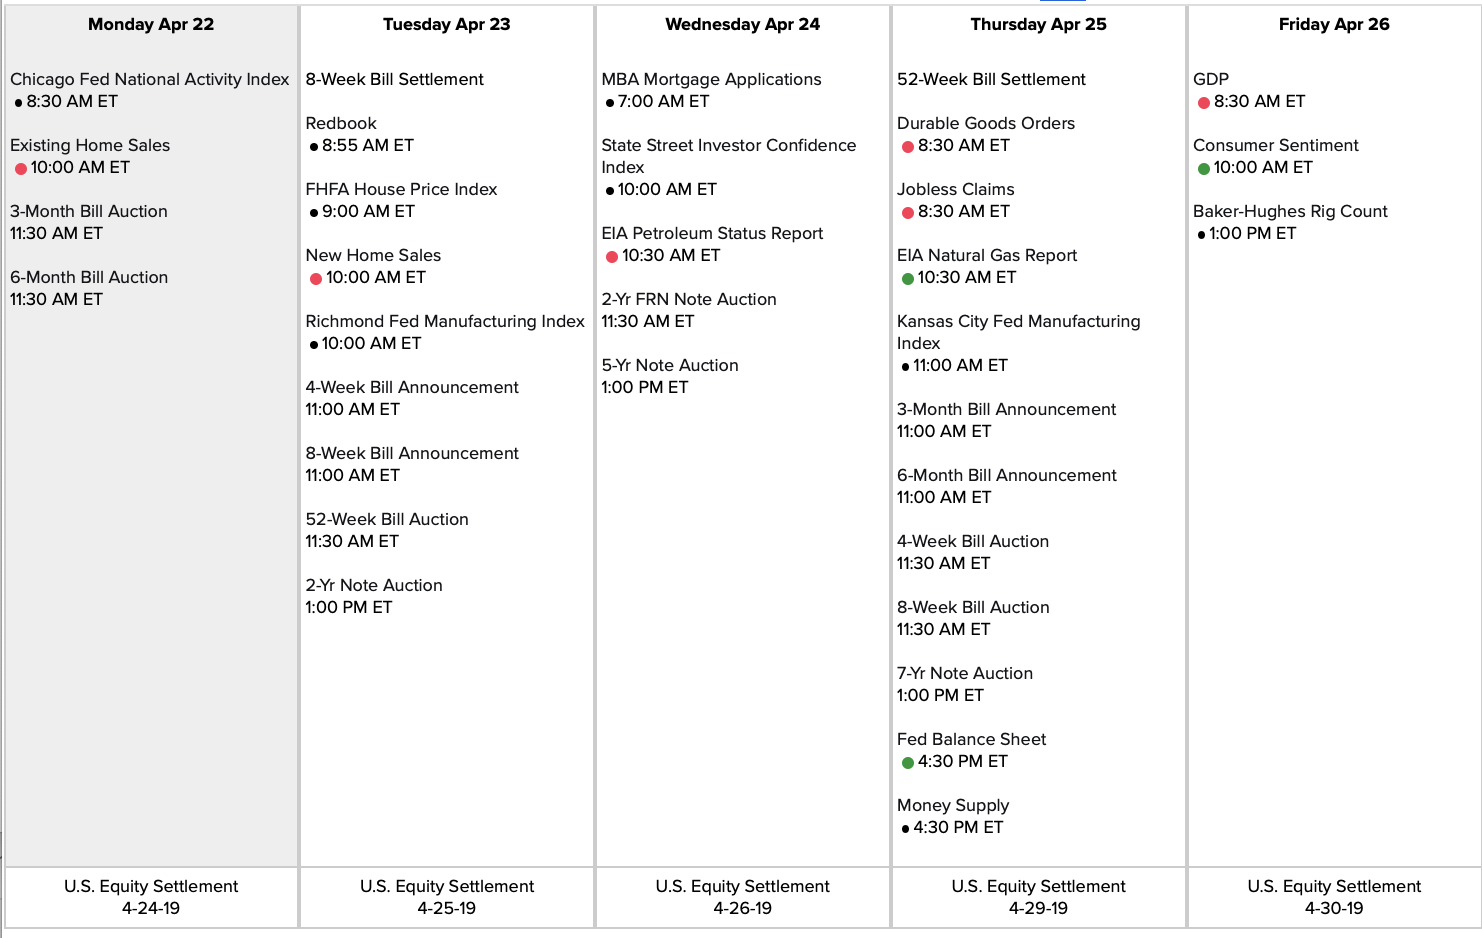
Econ Calendar for week of 4/22/19
AXP closed
#Earnings Sold to close $AXP Apr18/Apr26 112 #DoubleCalendar for .69, .73, and .90. Bought for .48 yesterday.
I got .90 for one at the open… then waiting lowered the profit for the rest as the stock rose.
Closed $IBM dub cal for .03. Bought for .407 on Tuesday.
SPX 1-dte
#SPX1dte Sold $SPX Apr 22nd 2855/2875-2930/2945 condors at .80 (IV: 5.49%, SPX: 2904)
HON closed
#Earnings Sold to close $HON Apr18/Apr26 162.5 #DoubleCalendar for .40. Bought yesterday for .55.
$AXP will be the profitable one… order in for 1.10, seeing if price can come to me, or I will lower my ask.
SPX 6-dte closed
#SPX1dte Bought to close $SPX Apr 24th 2900/2875 put spreads for 5.35. Sold for 6.95 on Monday. Index has not performed well for being under a (minor) upside warning, and this spread has bounced in and out of profit. Taking the profit while I can.
ISRG earnings analysis
#Earnings $ISRG reports tonight. Below are details on earnings one-day moves over the last 12 quarters.
Jan. 24, 2019 AC -3.93%
Oct. 18, 2018 AC -3.45%
July 19, 2018 AC -0.86%
April 17, 2018 AC +8.17% Biggest UP
Jan. 25, 2018 AC -2.12%
Oct. 19, 2017 AC +3.39%
July 20, 2017 AC -4.55%
April 18, 2017 AC +6.36%
Jan. 24, 2017 AC +5.09%
Oct. 18, 2016 AC -5.56% Biggest DOWN
July 19, 2016 AC +4.63%
April 19, 2016 AC +3.34%
Avg (+ or -) 4.29%
Bias 0.88%, slight positive bias on earnings.
With stock at 530.00 the data suggests these ranges:
Based on current IV (expected move into NEXT Friday per TOS): 497.67 to 562.33 (8 days, Friday)
Based on AVERAGE move over last 12 quarters: 507.28 to 552.72 (4 days, Monday)
Based on MAXIMUM move over last 12 Q’s (8.2%): 486.70 to 573.30 (4 days, Monday)
EIGHT-day max moves: UP: +9.8% (581.94), DOWN: -7.8% (488.66)
Open to requests for other symbols.
SKX partial closed
#Earnings Closed $SKX 35 long puts for 5.00. Only got a couple closed before the crash. Now price has recovered some, so I will wait to see if it falls again. Otherwise, i’ll be disputing this and asking for at least 4.90. (Strangles bought for 4.15 yesterday).
Order in to close $AXP for 1.30. I show mid price as .90 currently.
$HON too high to close now, may take loss
$IBM also out of range.
Nightmare
Total Interactive Brokers meltdown on both my computers. Unable to execute trades and missed closings on several trades. On the phone with them for over an hour now.
SPX 1-dte
#SPX1dte Sold to Open $SPX Apr 18th (weeklys) 2850/2870-2925/2945 condors for .90. (IV 9.42% SPX 2901)
I’m going to close the put side of my monthly spread to avoid gap risk. Hopefully for .10, but may be .15 or .20.
HON dub cal
#Earnings Bought to Open $HON Apr18/Apr26 162.5 #DoubleCalendar for .55.
SKX strangle
Earnings #LongStrangle
Was planning for a #LongStraddle but since price is between strikes and stock has bullish bias on earnings,
Bought $SKX 35/35.5 strangle for 4.15. Need a 12.5% move in either direction to breakeven. Avg move on stock has been 16.2%.
AXP dub cal
#Earnings Bought to Open $AXP Apr18/Apr26 112 #DoubleCalendar for .48.
Also looking at a Dub Cal for $HON and a #LongStraddle on $SKX
HON earnings analysis
#Earnings $HON reports tomorrow morning. Below are details on earnings one-day moves over the last 12 quarters.
Feb. 1, 2019 BO +0.75%
Oct. 19, 2018 BO -1.10%
July 20, 2018 BO +3.78% Biggest UP
April 20, 2018 BO +1.64%
Jan. 26, 2018 BO +1.94%
Oct. 20, 2017 BO +1.20%
July 21, 2017 BO +1.03%
April 21, 2017 BO +2.67%
Jan. 27, 2017 BO +0.38%
Oct. 21, 2016 BO +0.75%
July 22, 2016 BO -2.57% Biggest DOWN
April 22, 2016 BO -0.65%
Avg (+ or -) 1.54%
Bias 0.82%, positive bias on earnings.
With stock at 163.00 the data suggests these ranges:
Based on current IV (expected move into Friday per TOS): 158.33 to 167.67
Based on AVERAGE move over last 12 quarters: 160.49 to 165.51
Based on MAXIMUM move over last 12 Q’s (3.8%): 156.84 to 169.16
Based on DOWN max only (-2.6%): 158.81
Open to requests for other symbols.
SKX earnings analysis
#Earnings $SKX reports tomorrow morning. Below are details on earnings one-day moves over the last 12 quarters.
Feb. 7, 2019 AC +15.19%
Oct. 18, 2018 AC +13.78%
July 19, 2018 AC -20.99%
April 19, 2018 AC -27.04% Biggest DOWN
Feb. 8, 2018 AC +7.54%
Oct. 19, 2017 AC +41.44% Biggest UP
July 20, 2017 AC +0.67%
April 20, 2017 AC -2.56%
Feb. 9, 2017 AC +19.32%
Oct. 20, 2016 AC -17.26%
July 21, 2016 AC -22.34%
April 21, 2016 AC +6.26%
Avg (+ or -) 16.20%
Bias 1.17%, slight positive bias on earnings.
With stock at 35.20 the data suggests these ranges:
Based on current IV (expected move into Friday per TOS): 30.85 to 39.55
Based on AVERAGE move over last 12 quarters: 29.50 to 40.90
Based on MAXIMUM move over last 12 Q’s (41.4%): 20.61 to 49.79
Based on DOWN max only (-27.0%): 25.68
Open to requests for other symbols.
AXP earnings analysis
#Earnings $AXP reports tomorrow morning. Below are details on earnings one-day moves over the last 12 quarters.
Jan. 17, 2019 AC +0.99%
Oct. 18, 2018 AC +3.78%
July 18, 2018 AC -2.72% Biggest DOWN
April 18, 2018 AC +7.58%
Jan. 18, 2018 AC -1.83%
Oct. 18, 2017 AC -0.19%
July 19, 2017 AC -0.67%
April 19, 2017 AC +5.91%
Jan. 19, 2017 AC -0.63%
Oct. 19, 2016 AC +9.02% Biggest UP
July 20, 2016 AC -1.62%
April 20, 2016 AC +0.90%
Avg (+ or -) 2.99%
Bias 1.71%, positive bias on earnings.
With stock at 111.50 the data suggests these ranges:
Based on current IV (expected move into Friday per TOS): 107.89 to 115.11
Based on AVERAGE move over last 12 quarters: 108.17 to 114.83
Based on MAXIMUM move over last 12 Q’s (9.0%): 101.44 to 121.56
Based on DOWN max only (-2.7%): 108.47
Open to requests for other symbols.
SPX 0-dte
#SPX1dte A little confusing with this being monthly expiration week but Friday a holiday. The monthly options stop trading today at the close and are settled at the open tomorrow. Then the weeklys, that normally settle at Friday’s close, will settle at Thursday’s close. So to get a piece of each series, I sold the monthlys now as a same-day trade, and I’ll sell the weeklys before the close today.
Sold to Open $SPX April 17th (monthlys) 2855/2875-2930/2950 condors for .75. I may look to close today to avoid gap risk. (IV 12.5%, SPX: 2907)
NFLX closed
#Earnings Bought to close $NFLX 345/355-365/375 #IronCondor for 4.15 and 4.16. Sold yesterday for 8.35. With price at dead center, taking profit and running as NFLX may still move big. Can’t Truss It.
SPX 1-dte
#SPX1dte Sold $SPX Apr 17th 2865/2885-2930/2950 condors for .80. (IV: 8.05%, SPX: 2908)
NFLX tight condor
#Earnings Sold to Open $NFLX Apr 18th 345/355-365/375 #IronCondor for 8.35.
Risking 1.65 to make 5.00-7.00. Max win is about 8.35 but that’s only if I wait for expiration on Thursday. I’ll look to close this when (and if) stock price gets close enough to my 10-point center range for a profit.
NFLX often gaps big, but then sometimes will fade for the rest of the day (or two days). This is a smaller position as probability is lower and I don’t want to lose the max on a large position.
IBM dub cal
#Earnings Bought to open $IBM Apr18/Apr26 145 #DoubleCalendar for .40. Surprised I was filled below mid price… partial fill, may have to raise bid to fulfill my full position.
This has a 5% average move… tomorrow’s breakevens are showing to be precisely at 5%. So this has an even chance of working, but also an additional day to fade any large move.
IBM earnings analysis
#Earnings $IBM reports tonight. Below are details on earnings one-day moves over the last 12 quarters.
Jan. 22, 2019 AC +8.46%
Oct. 16, 2018 AC -7.62% Biggest DOWN
July 18, 2018 AC +3.26%
April 17, 2018 AC -7.53%
Jan. 18, 2018 AC -3.99%
Oct. 17, 2017 AC +8.86% Biggest UP
July 18, 2017 AC -4.20%
April 18, 2017 AC -4.91%
Jan. 19, 2017 AC +2.24%
Oct. 17, 2016 AC -2.61%
July 18, 2016 AC -0.17%
April 18, 2016 AC -5.59%
Avg (+ or -) 4.95%
Bias -1.15%, negative bias on earnings.
With stock at 144.00 the data suggests these ranges:
Based on current IV (expected move into Friday per TOS): 136.68 to 151.32
Based on AVERAGE move over last 12 quarters: 136.87 to 151.13
Based on MAXIMUM move over last 12 Q’s (8.9%): 131.24 to 156.76
Based on DOWN max only (-7.6%): 133.03
Open to requests for other symbols.
NFLX earnings analysis
#Earnings $NFLX reports tonight. Below are details on earnings one-day moves over the last 12 quarters.
Jan. 17, 2019 AC -3.98%
Oct. 16, 2018 AC +5.28%
July 16, 2018 AC -5.24%
April 16, 2018 AC +9.18%
Jan. 22, 2018 AC +9.97%
Oct. 16, 2017 AC -1.57%
July 17, 2017 AC +13.54%
April 17, 2017 AC -2.64%
Jan. 18, 2017 AC +3.86%
Oct. 17, 2016 AC +19.02% Biggest UP
July 18, 2016 AC -13.12%
April 18, 2016 AC -12.97% Biggest DOWN
Avg (+ or -) 8.36%
Bias 1.78%, positive bias on earnings.
With stock at 354.00 the data suggests these ranges:
Based on current IV (expected move into Friday per TOS): 328.02 to 379.98
Based on AVERAGE move over last 12 quarters: 324.39 to 383.61
Based on MAXIMUM move over last 12 Q’s (19.0%): 286.67 to 421.33
Based on DOWN max only (-13.1%): 307.56
Open to requests for other symbols.
SPX 15-dte
#SPX1dte Sold another roll: $SPX Apr 30th 2790/2810/2950/2970 condors for 3.80. (IV: 10.85% SPX: 2902)
SPX 1-dte
#SPX1dte BTC $SPX April 17th 2725/2750-2940/2965 condors for .50. Sold for 2.85 as a roll on April 1st.
UNH earnings analysis
#Earnings $UNH reports tomorrow morning. Below are details on earnings one-day moves over the last 12 quarters.
Jan. 15, 2019 BO +3.55%
Oct. 16, 2018 BO +4.73%
July 17, 2018 BO -2.60% Biggest DOWN
April 17, 2018 BO +3.57%
Jan. 16, 2018 BO +4.28%
Oct. 17, 2017 BO +5.53%
July 18, 2017 BO +0.26%
April 18, 2017 BO +0.84%
Jan. 17, 2017 BO -0.70%
Oct. 18, 2016 BO +6.90% Biggest UP
July 19, 2016 BO +1.30%
April 19, 2016 BO +2.10%
Avg (+ or -) 3.03%
Bias 2.48%, strongly positive bias on earnings.
With stock at 227.50 the data suggests these ranges:
Based on current IV (expected move into Friday per TOS): 215.83 to 239.17
Based on AVERAGE move over last 12 quarters: 220.61 to 234.39
Based on MAXIMUM move over last 12 Q’s (6.9%): 211.80 to 243.20
Based on DOWN max only (-2.6%): 221.59
Open to requests for other symbols.
SPX 9-dte
#SPX1-dte Sold $SPX Apr 24th 2900/2875 put spreads for 6.95. Aggressive ATM position in response to minor upside warning that fired Friday. If index has not moved higher by Wednesday, I will consider rolling.
(IV 10%, SPX: 2903)
JNJ earnings analysis
#Earnings $JNJ reports tomorrow morning. Below are details on earnings one-day moves over the last 12 quarters.
Jan. 22, 2019 BO -1.44%
Oct. 16, 2018 BO +1.94%
July 17, 2018 BO +3.54%
April 17, 2018 BO -0.92%
Jan. 23, 2018 BO -4.25% Biggest DOWN
Oct. 17, 2017 BO +3.43% Biggest UP
July 18, 2017 BO +1.74%
April 18, 2017 BO -3.10%
Jan. 24, 2017 BO -1.88%
Oct. 18, 2016 BO -2.59%
July 19, 2016 BO +1.71%
April 19, 2016 BO +1.57%
Avg (+ or -) 2.34%
Bias -0.02%, no significant bias on earnings.
With stock at 136.25 the data suggests these ranges:
Based on current IV (expected move into Friday per TOS): 131.62 to 140.88
Based on AVERAGE move over last 12 quarters: 133.06 to 139.44
Based on MAXIMUM move over last 12 Q’s (4.3%): 130.46 to 142.04
Based on DOWN max only (+3.5%): 141.07
Open to requests for other symbols.
SPX 0-dte
#SPX1dte Sold $SPX Apr 15th 2865/2885-2915/2925 condors for 1.00. Expire today (IV: 7.66%, SPX: 2904)
Minor Upside Warning
#VIXIndicator fired this at the close. Last one we got was on March 13th, and it was good for a 1.75% move up from that day’s close to intraday high 6 days later, before we stalled and pulled back a little.
PNC up and out
#Earnings I played this one exactly right… slightly bearish lean. Today’s +3.1% day is the highest one-day move up after earnings since January 2013. So, expiring with 3.00 exercise cost, $PNC #IronCondor, sold yesterday for 2.00.
SPX 1-dte
#SPX1dte Closed $SPX Apr 15th 2850/2830 put spreads and 2920 short calls for 1.40 total. Sold yesterday for 1.25. Leaving the 2940 long calls. Upside warning being reinstated today (VIX lowest since early October) and traded within expected move, so I’m out. May try to sell another same-day on Monday morning. The one from today is expiring:
SPX Apr 12th 2860/2880-2920/2935, sold for .80 this morning.


