
SPX 1-dte

#SPX1dte Stopped out $SPX March 16th 2895/2905 call spreads for 3.05. Condors sold yesterday for 1.20.

Another #CondorRoll, same strikes as I sold earlier for May 31st, but this time a week earlier:

Sold $SPX 2815/2840-2960/2985 condors for 4.55.

SPX smashed

#SPX1dte The biggest up days in history are all during times of market volatility. On a percentage basis, the Fall of 2008 contains five of the top 10 biggest moves UP; a period in which the market was only starting its fall to lose over half its value.

So it is fitting a call spread I could have closed at yesterday’s open for about .45 I now had to stop out for 8.00. Today’s action has provided no pullback opportunities, although I imagine there’ll be one now that I was finally forced out.

BTC $SPX May 17th 2890/2915 call spreads for 8.00. Sold for 2.10 on Monday.

#CondorRoll Sold $SPX May 31st 2815/2840/2960/2985 condors for 6.65

I’m also going to take a loss on today’s monthly condor call side. I cannot risk overnight gap risk on the 2895 short calls.

DE bullish play

#Earnings I was looking at a #DoubleCalendar, ATM going for about 1.50, but didn’t want the risk as I think a bigger than average move may be possible. Market is crazy bullish at the moment, entirely Trade-War driven. So I looked at an OTM call calendar at 160. The front calls don’t even have a bid, so, I just went with the “buy” half of the Calendar…

Bought to open $DE May 24th 160 calls for .18.

Looking at the daily chart, DE was close to 170 just a couple weeks ago. Unless the report is bad, I believe it has a good shot at a large move tomorrow, or even a further drift upward into next week, when these expire. It is a much better risk/reward play in an uncertain market. Needs any move up to be profitable, and about a 9% move up to be ATM.

NVDA butterfly

#Earnings Bought to Open $NVDA May 17th 155/160/162.5 #BrokenWingButterfly for 1.49. Bullish trade with no upside risk.

DE earnings analysis

#Earnings $DE reports tomorrow morning. Below are details on earnings one-day moves over the last 12 quarters.

Feb. 15, 2019 BO -2.11%
Nov. 21, 2018 BO +2.42%
Aug. 17, 2018 BO +2.35%
May 18, 2018 BO +5.74%
Feb. 16, 2018 BO +1.57%
Nov. 22, 2017 BO +4.32%
Aug. 18, 2017 BO -5.37%
May 19, 2017 BO +7.30%
Feb. 17, 2017 BO +1.00%
Nov. 23, 2016 BO +11.04%
Aug. 19, 2016 BO +13.49% Biggest UP
May 20, 2016 BO -5.48% Biggest DOWN

Avg (+ or -) 5.18%
Bias 3.02%, strongly positive bias on earnings.

With stock at 146.00 the data suggests these ranges:
Based on current IV (expected move into Friday per TOS): 140.45 to 151.55
Based on AVERAGE move over last 12 quarters: 138.43 to 153.57
Based on MAXIMUM move over last 12 Q’s (13.5%): 126.30 to 165.70
Based on DOWN Max only (-5.5%): 138.00

Open to requests for other symbols.

NVDA earnings analysis

#Earnings $NVDA reports tonight. Below are details on earnings one-day moves over the last 12 quarters.

Feb. 14, 2019 AC +1.81%
Nov. 15, 2018 AC -18.75% Biggest DOWN
Aug. 16, 2018 AC -4.90%
May 10, 2018 AC -2.15%
Feb. 8, 2018 AC +6.69%
Nov. 9, 2017 AC +5.26%
Aug. 10, 2017 AC -5.32%
May 9, 2017 AC +17.82%
Feb. 9, 2017 AC -2.37%
Nov. 10, 2016 AC +29.80% Biggest UP
Aug. 11, 2016 AC +5.59%
May 12, 2016 AC +15.20%

Avg (+ or -) 9.64%
Bias 4.06%, strongly positive bias on earnings.

With stock at 159.00 the data suggests these ranges:
Based on current IV (expected move into Friday per TOS): 147.20 to 170.80
Based on AVERAGE move over last 12 quarters: 143.68 to 174.32
Based on MAXIMUM move over last 12 Q’s (29.8%): 111.62 to 206.38
Based on DOWN Max only (-18.8%): 129.19

Open to requests for other symbols.

BIDU earnings analysis

#Earnings $BIDU reports tonight. Below are details on earnings one-day moves over the last 12 quarters.

Feb. 21, 2019 AC -2.70%
Oct. 30, 2018 AC +3.64%
July 31, 2018 AC -7.73%
April 26, 2018 AC +5.54%
Feb. 13, 2018 AC +4.56%
Oct. 26, 2017 AC -8.15% Biggest DOWN
July 27, 2017 AC +9.45% Biggest UP
April 27, 2017 AC -4.06%
Feb. 23, 2017 AC -5.12%
Oct. 27, 2016 AC +2.56%
July 28, 2016 AC -3.64%
April 28, 2016 AC +4.45%

Avg (+ or -) 5.13%
Bias -0.10%, no significant bias on earnings.

With stock at 152.50 the data suggests these ranges:
Based on current IV (expected move into Friday per TOS): 145.46 to 159.54
Based on AVERAGE move over last 12 quarters: 144.67 to 160.33
Based on MAXIMUM move over last 12 Q’s (9.5%): 138.09 to 166.91
Based on DOWN Max only (-8.2%): 140.07

Open to requests for other symbols.

SPX 1-dte

#SPX1dte Sold $SPX May 16th (monthlys) 2775/2795/2895/2915 condors for 1.20. (IV 16.47%, SPX 2856)
These stop trading tomorrow at the close but will settle with Friday morning’s opening.

Expiring, May 15th 2770/2790/2885/2905 condors, sold yesterday for 1.15

Trading by Tweet

https://platform.twitter.com/widgets.js

NTES earnings analysis

#Earnings $NTES reports tonight. Below are details on earnings one-day moves over the last 12 quarters.

Feb. 20, 2019 AC -5.88%
Nov. 14, 2018 AC +5.31%
Aug. 8, 2018 AC -10.96% Biggest DOWN
May 16, 2018 AC -7.45%
Feb. 7, 2018 AC -6.27%
Nov. 15, 2017 AC +7.85%
Aug. 9, 2017 AC -9.77%
May 10, 2017 AC -0.82%
Feb. 15, 2017 AC +14.08% Biggest UP
Nov. 9, 2016 AC -9.22%
Aug. 17, 2016 AC -2.67%
May 11, 2016 AC +0.43%

Avg (+ or -) 6.73%
Bias -2.11%, negative bias on earnings.

With stock at 262.50 the data suggests these ranges:
Based on current IV (expected move into Friday per TOS): 245.55 to 279.45
Based on AVERAGE move over last 12 quarters: 244.84 to 280.16
Based on MAXIMUM move over last 12 Q’s (14.1%): 225.54 to 299.46
Based on DOWN Max only (-11.0%): 233.73

Open to requests for other symbols.

SPX 1-dte

#SPX1dte Sold to Open $SPX May 15th 2770/2790-2885/2905 condors for 1.15 (IV: 15.16%, SPX 2850)

M earnings analysis

#Earnings $M reports tomorrow morning. Below are details on earnings one-day moves over the last 12 quarters.

Feb. 26, 2019 BO +1.47%
Nov. 14, 2018 BO -7.18%
Aug. 15, 2018 BO -15.94%
May 16, 2018 BO +10.82%
Feb. 27, 2018 BO +3.46%
Nov. 9, 2017 BO +10.98%
Aug. 10, 2017 BO -10.24%
May 11, 2017 BO -17.00% Biggest DOWN
Feb. 21, 2017 BO -0.03%
Nov. 10, 2016 BO +5.60%
Aug. 11, 2016 BO +17.08% Biggest UP
May 11, 2016 BO -15.16%

Avg (+ or -) 9.58%
Bias -1.35%, negative bias on earnings.

With stock at 21.75 the data suggests these ranges:
Based on current IV (expected move into Friday per TOS): 19.68 to 23.82
Based on AVERAGE move over last 12 quarters: 19.67 to 23.83
Based on MAXIMUM move over last 12 Q’s (17.1%): 18.04 to 25.46

Open to requests for other symbols.

GOOGL out

#Earnings Looks like I picked the wrong week for a #RevengeTrade.

After losing on an earnings condor I sold the $GOOGL ITM May 17th 1220/1120 put spread for 7.75 on May 3rd. I managed to get out for 8.55 by legging out, which I can assure you is not a relaxing endeavor with options that cost 80.00. I will look to take advantage of the next bull run, but not gonna mess with it now.

BABA earnings analysis

#Earnings $BABA reports tomorrow morning. Below are details on earnings one-day moves over the last 12 quarters.

Jan. 30, 2019 BO +6.33% Biggest UP
Nov. 2, 2018 BO -2.41%
Aug. 23, 2018 BO -3.15%
May 4, 2018 BO +3.52%
Feb. 1, 2018 BO -5.90% Biggest DOWN
Nov. 2, 2017 BO -0.68%
Aug. 17, 2017 BO +2.77%
May 18, 2017 BO +0.45%
Jan. 24, 2017 BO +3.06%
Nov. 2, 2016 BO -2.60%
Aug. 11, 2016 BO +5.08%
May 5, 2016 BO +3.96%

Avg (+ or -) 3.33%
Bias 0.87%, positive bias on earnings.

With stock at 172.50 the data suggests these ranges:
Based on current IV (expected move into Friday per TOS): 163.16 to 181.84
Based on AVERAGE move over last 12 quarters: 166.76 to 178.24
Based on MAXIMUM move over last 12 Q’s (6.3%): 161.58 to 183.42
Based on DOWN Max only (-5.9%): 162.32

Open to requests for other symbols.

SPX 4-dte

#SPX1-dte As another short term trade, replacing call spreads closed Friday,
Sold $SPX March 17th (weeklys) 2890/2915 call spreads for 2.95.

Also, closed today’s 2790/2770 put spreads for .30. Hovering between 1.00 and 4.00 all day, finally got out. I had to close the call spread at Friday’s close, unfortunately; it would not have been a concern today!

VXX longs adding

#VXXGame Bought more $VXX Jan 2020 20 puts for 1.40. Adding to first batch I bought for 1.75 on Jan 22nd.

The 2021 puts are still too expensive, but I’m watching.

Stopped already

#SPX1dte After selling the condor, SPX moved up from 2868 to top out at 2891, which was within the expected move for Monday. So I had to stop out of the call side for 1.40.

I may sell a same day condor on Monday if the open in quiet, but otherwise this one’s s small loss.

TQQQ rolls

#SyntheticCoveredCalls Earlier: BTC $TQQQ May 17th 68.5 calls for .12. Sold for 1.26 on Monday.

Now: Sold TQQQ May 31st 65 calls for 1.25

SPX 1-dte

#SPX1dte Sold $SPX May 13th 2770/2790-2920/2940 condors for 1.15. (IV: 14.08%, SPX 2868)

Also, closed SPX May 17th 2960/2985 call spreads for .40. Sold on Monday for 3.15.

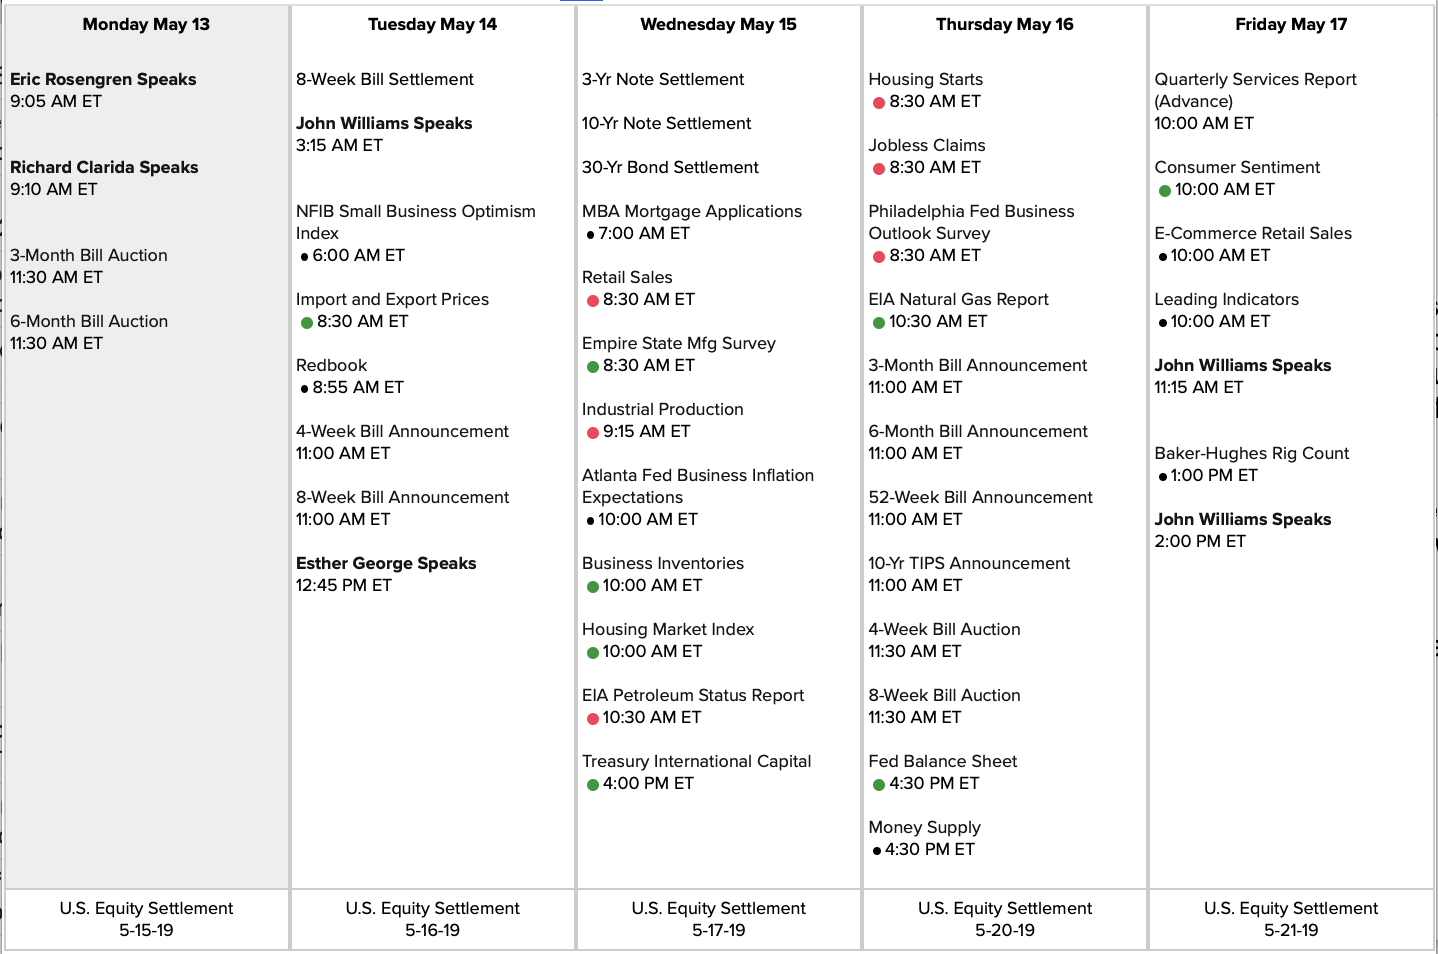
Econ Calendar for week of 5/13/19

Nothing big on the schedule but we’ll still have this trade mess. My prediction: no deal, yet, and will stretch into at least June.

Screen Shot 2019-05-10 at 11.31.55 AM

Link to calendar: https://us.econoday.com/byweek.asp?day=13&month=5&year=2019&cust=us&lid=0

YELP closing

#Earnings Sold some 39.5 long puts for 3.75, but now waiting as it looks to want to drop more. #LongStrangle bought yesterday for 4.37.

Filled on next batch for 4.50 and 4.75.

SPX closed

#SPX1dte $SPX May 10th 2760/2780-2920/2940 condors closed for .30. Sold yesterday for 2.05. Super high premium paid off on pretty much the expected news on trade talks: “not yet.”

YELP strangle

#Earnings Bought to open $YELP May 10th 39.5/40 #LongStrangle for 4.37. I need an 11.8% move for breakeven. Avg move on earnings is 15.2%.

SPX 1-dte

#SPX1dte Sold $SPX May 10th 2760/2780-2920/2940 condors for 2.05. (IV 25.92%, SPX 2864)

A little more aggressive than normal from a delta standpoint, .08 on both sides rather than .06. But in quiet IV times I have gone as high as .10 to get enough premium, and these strikes are decently OTM. Puts 2.9% away and Calls 2.0% away. Yes, it’s possible, and if we get super big news tonight, I may get stopped out tomorrow.

Z earnings analysis

#Earnings $Z reports tonight. Below are details on earnings one-day moves over the last 12 quarters.

Feb. 21, 2019 AC +26.36% Biggest UP
Nov. 6, 2018 AC -26.92% Biggest DOWN
Aug. 6, 2018 AC -14.77%
May 7, 2018 AC -1.44%
Feb. 8, 2018 AC -2.67%
Nov. 7, 2017 AC +2.67%
Aug. 8, 2017 AC -9.05%
May 4, 2017 AC +9.29%
Feb. 7, 2017 AC -6.37%
Nov. 1, 2016 AC +6.32%
Aug. 4, 2016 AC -4.73%
May 3, 2016 AC +12.05%

Avg (+ or -) 10.22%
Bias -0.77%, small negative bias on earnings.

With stock at 34.00 the data suggests these ranges:
Based on current IV (expected move into Friday per TOS): 29.83 to 38.17
Based on AVERAGE move over last 12 quarters: 30.53 to 37.47
Based on MAXIMUM move over last 12 Q’s (26.9%): 24.85 to 43.14

Open to requests for other symbols.

YELP earnings analysis

#Earnings $YELP reports tonight. Below are details on earnings one-day moves over the last 12 quarters.

Feb. 13, 2019 AC -0.70%
Nov. 8, 2018 AC -26.59% Biggest DOWN
Aug. 8, 2018 AC +26.65%
May 10, 2018 AC -7.81%
Feb. 7, 2018 AC -14.04%
Nov. 1, 2017 AC -0.10%
Aug. 3, 2017 AC +27.66% Biggest UP
May 9, 2017 AC -18.35%
Feb. 9, 2017 AC -13.64%
Nov. 2, 2016 BO +9.94%
Aug. 9, 2016 AC +12.83%
May 5, 2016 AC +23.71%

Avg (+ or -) 15.17%
Bias 1.63%, small positive bias on earnings.

With stock at 39.60 the data suggests these ranges:
Based on current IV (expected move into Friday per TOS): 35.04 to 44.16
Based on AVERAGE move over last 12 quarters: 33.59 to 45.61
Based on MAXIMUM move over last 12 Q’s (27.7%): 28.65 to 50.55
Based on DOWN max only (-26.6%): 29.07

Open to requests for other symbols.

WYNN earnings analysis

#Earnings $WYNN reports tonight. Below are details on earnings one-day moves over the last 12 quarters.

Jan. 30, 2019 AC +2.09%
Nov. 7, 2018 AC -13.13% Biggest DOWN
Aug. 1, 2018 AC -6.53%
April 24, 2018 AC -3.74%
Jan. 22, 2018 BO +8.67% Biggest UP
Oct. 26, 2017 AC -1.50%
July 25, 2017 AC -5.02%
April 25, 2017 AC +5.89%
Jan. 26, 2017 AC +7.93%
Nov. 2, 2016 AC -9.31%
July 28, 2016 AC -6.41%
May 5, 2016 AC +1.77%

Avg (+ or -) 6.00%
Bias -1.61%, negative bias on earnings.

With stock at 132.00 the data suggests these ranges:
Based on current IV (expected move into Friday per TOS): 123.53 to 140.47
Based on AVERAGE move over last 12 quarters: 124.08 to 139.92
Based on MAXIMUM move over last 12 Q’s (13.1%): 114.67 to 149.33
Based on UP max only (8.7%): 143.44

Open to requests for other symbols.

STMP’d out

$STMP tanking again… oh, to have been short!

SPX expires

#SPX1dte Expiring: $SPX May 8th 2780/2800/2930/2950 condors, sold yesterday for 1.05.

WYNN earnings

TOS is confirming tomorrow after the close. These guys are always a guessing game until last minute.

TQQQ calls

#SyntheticCoveredCalls #LongLEAPs I’m still at it, selling weekly calls against my Jan 2020 66.67 long calls. I have been underwater and ITM on them for a few weeks, but the pullback allowed me to escape. I mistakenly forgot to close some ITM calls expiring Friday, so Monday’s gap down was super fortunate and allowed me to finally get above water.

Monday: Sold $TQQQ May 17th 68.5 calls for 1.26 (and covered short stock assigned Friday)
Today: Sold TQQQ May 24th 67.5 calls for 1.23

STMP earnings analysis

#Earnings $STMP reports tonight. Below are details on earnings one-day moves over the last 12 quarters.

Feb. 21, 2019 AC -57.76% Biggest DOWN
Oct. 31, 2018 AC -9.74%
Aug. 1, 2018 AC +8.43%
May 3, 2018 AC +3.91%
Feb. 21, 2018 AC +11.00%
Nov. 2, 2017 AC -22.59%
Aug. 2, 2017 AC +35.88% Biggest UP
May 3, 2017 AC -0.40%
Feb. 23, 2017 AC -1.60%
Nov. 3, 2016 AC +6.63%
July 28, 2016 AC -6.22%
May 9, 2016 AC -5.32%

Avg (+ or -) 14.12%
Bias -3.15%, negative bias on earnings.

With stock at 84.00 the data suggests these ranges:
Based on current IV (expected move into Friday per TOS): 71.94 to 96.06
Based on AVERAGE move over last 12 quarters: 72.14 to 95.86
Based on MAXIMUM move over last 12 Q’s (57.8%): 35.48 to 132.52
Based on UP max only (35.9%): 114.14

Open to requests for other symbols.

ROKU earnings analysis

#Earnings $ROKU reports tonight. Below are details on earnings one-day moves over the last 6 quarters, which accounts for its full history of earnings.

Feb. 21, 2019 AC +25.23%
Nov. 7, 2018 AC -22.29% Biggest DOWN
Aug. 8, 2018 AC +21.31%
May 9, 2018 AC -1.71%
Feb. 21, 2018 AC -17.71%
Nov. 8, 2017 AC +54.93% Biggest UP

Avg (+ or -) 23.86%
Bias 9.96%, positive bias on earnings.

With stock at 64.50 the data suggests these ranges:
Based on current IV (expected move into Friday per TOS): 55.66 to 73.34
Based on AVERAGE move over last 12 quarters: 49.11 to 79.89
Based on MAXIMUM move over last 12 Q’s (54.9%): 29.07 to 99.93
Based on DOWN max only (-22.3%): 50.12

Open to requests for other symbols.

BUD closed

#Earnings Sold to close $BUD May10/May17 87.5 #DoubleCalendar for .55. Bought for .44 on Monday. It will be worth more if stock price continues to go higher, but not trusting the market to help.

Downside Warning

#VIXIndicator A Downside Warning is now in effect… look for continued drop, at least in the short term.

SPX extra

#SPX1dte An extra bearish trade since that seems to be the new black:
Sold $SPX May 17th (weeklys) 2960/2985 call spreads for 3.15.

SPX 1-dte

#SPX1dte — nice to have some volatility again, allowing for wider condor.

Sold $SPX May 8th 2780/2800-2930/2950 condors for 1.05, IV: 20.7%, SPX 2873.

EA earnings analysis

#Earnings $EA reports tonight. Below are details on earnings one-day moves over the last 12 quarters.

Feb. 5, 2019 AC -13.30% Biggest DOWN
Oct. 30, 2018 AC -4.05%
July 26, 2018 AC -5.70%
May 8, 2018 AC +5.74%
Jan. 30, 2018 AC +6.95%
Oct. 31, 2017 AC -4.28%
July 27, 2017 AC +0.55%
May 9, 2017 AC +12.65%
Jan. 31, 2017 AC -0.51%
Nov. 1, 2016 AC +1.64%
Aug. 2, 2016 AC +2.40%
May 10, 2016 AC +13.69% Biggest UP

Avg (+ or -) 5.96%
Bias 1.32%, positive bias on earnings.

With stock at 92.50 the data suggests these ranges:
Based on current IV (expected move into Friday per TOS): 84.80 to 100.20
Based on AVERAGE move over last 12 quarters: 86.99 to 98.01
Based on MAXIMUM move over last 12 Q’s (13.7%): 79.84 to 105.16
Based on DOWN max only (-13.3%): 80.20

Open to requests for other symbols.

SPX stopped

#SPX1dte Bought to close $SPX May 6th 2905/2885 put spreads for 1.85. Condors sold for .80 on low-volatility Friday.

Not a good morning to wake up to an ITM spread, but with such a large gap it seemed the move would be faded. Now it looks to have run out of steam, so not taking the chance of a collapse into the close.

BUD earnings trade and analysis

#Earnings $BUD reports tomorrow morning. Below are details on earnings one-day moves over the last 12 quarters.

Bought to Open BUD May10/May17 87.5 #DoubleCalendar for .42 & .44

Feb. 28, 2019 BO +4.60%
Oct. 25, 2018 BO -9.37% Biggest DOWN
July 26, 2018 BO -5.02%
May 9, 2018 BO -0.31%
March 1, 2018 BO +3.07%
Oct. 26, 2017 BO -0.94%
July 27, 2017 BO +6.16% Biggest UP
May 4, 2017 BO +5.68%
March 2, 2017 BO -3.72%
Oct. 28, 2016 BO -3.80%
July 29, 2016 BO +2.79%
May 4, 2016 BO -1.53%

Avg (+ or -) 3.92%
Bias -0.20%, no significant bias on earnings.

With stock at 87.50 the data suggests these ranges:
Based on current IV (expected move into Friday per TOS): 83.43 to 91.57
Based on AVERAGE move over last 12 quarters: 84.07 to 90.93
Based on MAXIMUM move over last 12 Q’s (9.4%): 79.30 to 95.70
Based on UP max only (+6.2%): 92.89

Open to requests for other symbols.

HTZ earnings analysis

#Earnings $HTZ reports tomorrow morning. Below are details on earnings one-day moves over the last 12 quarters.

Feb. 25, 2019 AC +4.04%
Nov. 8, 2018 AC +19.15%
Aug. 6, 2018 AC +24.63% Biggest UP
May 7, 2018 AC -18.72%
Feb. 27, 2018 AC -5.55%
Nov. 10, 2017 BO -2.24%
Aug. 8, 2017 AC +23.03%
May 8, 2017 AC -14.15%
Feb. 28, 2017 BO +13.59%
Nov. 7, 2016 AC -22.49% Biggest DOWN
Aug. 8, 2016 AC -4.96%
May 9, 2016 AC +0.22%

Avg (+ or -) 12.73%
Bias 1.38%, slight positive bias on earnings.

With stock at 19.75 the data suggests these ranges:
Based on current IV (expected move into Friday per TOS): 17.31 to 22.19
Based on AVERAGE move over last 4 quarters: 17.24 to 22.26
Based on MAXIMUM move over last 4 Q’s (24.6%): 14.89 to 24.61
Based on DOWN max only (-22.6%): 15.31

Open to requests for other symbols.

REGN earnings analysis

#Earnings $REGN reports tomorrow morning. Below are details on earnings one-day moves over the last 12 quarters.

Feb. 6, 2019 BO -3.43%
Nov. 6, 2018 BO +0.75%
Aug. 2, 2018 BO +6.99% Biggest UP
May 3, 2018 BO -1.25%
Feb. 8, 2018 BO -3.58% Biggest DOWN
Nov. 8, 2017 BO +2.66%
Aug. 3, 2017 BO -2.03%
May 4, 2017 BO +6.70%
Feb. 9, 2017 BO +1.91%
Nov. 4, 2016 BO +1.60%
Aug. 4, 2016 BO -1.80%
May 5, 2016 BO +4.73%

Avg (+ or -) 3.12%
Bias 1.10%, positive bias on earnings.

With stock at 335.00 the data suggests these ranges:
Based on current IV (expected move into Friday per TOS): 315.64 to 354.36
Based on AVERAGE move over last 4 quarters: 325.52 to 346.48
Based on MAXIMUM move over last 4 Q’s (7.0%): 312.51 to 359.49
Based on DOWN max only (-3.6%): 323.97

Open to requests for other symbols.

VIX Indicator

#VIXIndicator, needless to say, the minor upside warning was canceled this morning with a $VIX high of 18.80 (we only needed 16.09). Any close at 16.09 or higher will mean a Downside Warning.

Almost escaped

#SPX1dte SPX ended the day right on the line…. my 2945 short calls will likely settle with a debit of 19 to 50 dollars. Condors sold yesterday for .80.

#spx

GOOGL it

#Earnings #Rolling #revengetrade
Sold $GOOGL May 17th 1220/1210 put spreads for 7.75. Replacing my fully ITM spread of the same strikes expiring today.

SPX 1-dte

#SPX1dte Sold to Open $SPX May 6th 2885/2905/2970/2985 condors for .80. (IV: 6.77%, SPX 2944)

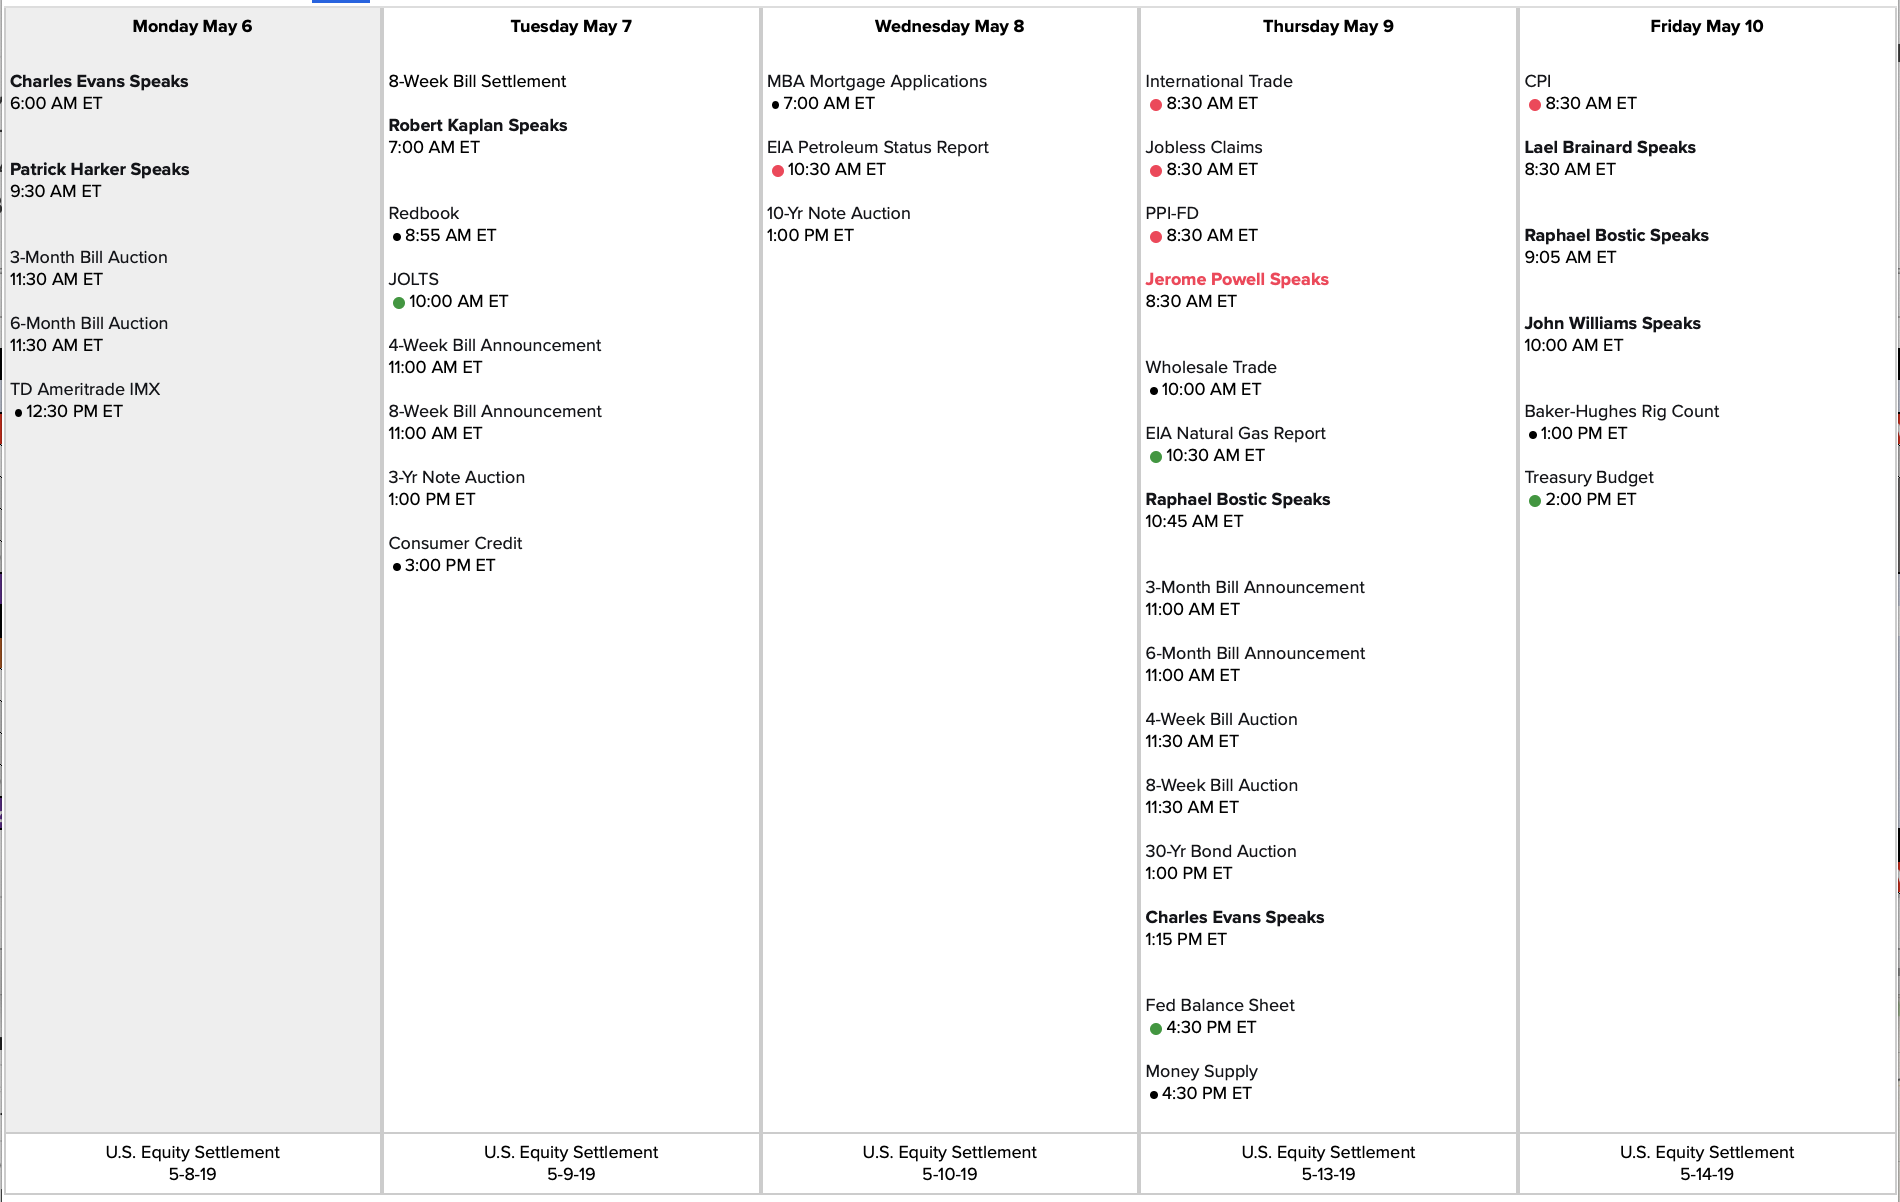
Econ Calendar for week of 5/6/19

More yapping from Jerome Powell on Wednesday morning.

Screen Shot 2019-05-03 at 11.14.13 AM

Link to calendar: https://us.econoday.com/byweek.asp?day=6&month=5&year=2019&cust=us&lid=0

SPX 7-dte

#SPX1dter – tempting fate, Sold $SPX May 10th 2970/2995 call spreads for 3.50.

Never mind

Volatility this week was too minor to disrupt upside warning. Yesterday’s VIX high was 4% shy of canceling the bullish signal, so apparently we are still full steam higher.

Calendars missed

#Earnings Good trades last week followed by a couple misses this week:
Sold to close $MNST 58 #DoubleCalendar for .08. Bought yesterday for .29.
Paid .04 to close $CLX 157.5 put side of #DoubleCalendar. Bought Tuesday for .74

April Jobs Report

#Jobs Another great month; lowest UE since 1969

+263,000 non-farm payroll jobs, vs. 190K expected
Unemployment at 3.6%, down by 0.2, a 49-year low
U6 unemployment at 7.3%, unchanged
Wages up 0.2%, 3.2% year over year
Labor force participation 62.8%, down by 0.2

March revised down from 196K to 189K
February revised up from 33K to 56K

SPX 1-dte

#SPX1dte Sold $SPX May 3rd 2850/2870-2945/2965 condors for .80 (IV: 12.84%, SPX 2914)

MNST of a trade

#Earnings Bought to Open $MNST May03/May10 58 #DoubleCalendar for .29.

SPX stopped

#SPX1dte Stopped $SPX May 8th 2890/2865 put spread for 5.80. Condor sold for 4.55 on Monday. Been getting whipsawed on these medium-term condors. Small losses but certainly annoying. The 1-day jobbers are easier.

Here comes the drop

Are we really that scared of interest rates?

MNST earnings analysis – trying again

#Earnings $MNST reports tonight. Below are details on earnings one-day moves over the last 12 quarters.

Tried for a dbl cal last quarter but the big move shut me out. However, it is such a cheap play that I’ll try again.

Feb. 27, 2019 AC +8.66%
Nov. 7, 2018 AC -3.16%
Aug. 8, 2018 AC +2.65%
May 8, 2018 AC -7.47%
Feb. 28, 2018 AC -14.43% Biggest DOWN
Nov. 8, 2017 AC +1.17%
Aug. 8, 2017 AC -1.14%
May 4, 2017 AC +3.30%
March 1, 2017 AC +12.75%
Nov. 3, 2016 AC -3.55%
Aug. 4, 2016 AC +2.47%
April 29, 2016 BO +12.81% Biggest UP

Avg (+ or -) 6.13%
Bias 1.17%, positive bias on earnings.

With stock at 57.50 the data suggests these ranges:
Based on current IV (expected move into Friday per TOS): 53.57 to 61.43
Based on AVERAGE move over last 4 quarters: 53.98 to 61.02
Based on MAXIMUM move over last 4 Q’s (14.4%): 49.20 to 65.80
Based on UP max only (12.8%): 64.87

Open to requests for other symbols.

OLED earnings analysis – big mover

#Earnings $OLED reports tonight. Below are details on earnings one-day moves over the last 12 quarters.

Feb. 21, 2019 AC +23.03%
Nov. 1, 2018 AC -20.50% Biggest DOWN
Aug. 9, 2018 AC +13.54%
May 3, 2018 AC +12.43%
Feb. 22, 2018 AC -15.81%
Nov. 2, 2017 AC +9.52%
Aug. 3, 2017 AC -1.30%
May 4, 2017 AC +23.87% Biggest UP
Feb. 23, 2017 AC +20.08%
Nov. 3, 2016 AC +2.98%
Aug. 4, 2016 AC -8.01%
May 5, 2016 AC -0.76%

Avg (+ or -) 12.65%
Bias 4.92%, positive bias on earnings.

With stock at 161.50 the data suggests these ranges:
Based on current IV (expected move into Friday per TOS): 143.24 to 179.7682
Based on AVERAGE move over last 4 quarters: 141.07 to 181.93
Based on MAXIMUM move over last 4 Q’s (23.9%): 122.95 to 200.05
Based on DOWN max only (-20.5%): 128.39

Open to requests for other symbols.

Expiring in the nick of time

#SPX1dte 2890/2910-2965/2980 condors, sold yesterday for 1.10. If the market had another 30 minutes the put side might be in trouble. Pretty sharp drop into the close, after notching a new intraday all-time high earlier today.

W earnings analysis

#Earnings $W reports tomorrow morning. Below are details on earnings one-day moves over the last 12 quarters.

Feb. 22, 2019 BO +27.85% Biggest UP
Nov. 1, 2018 BO -12.81%
Aug. 2, 2018 BO +7.54%
May 2, 2018 BO +13.65%
Feb. 22, 2018 BO -22.71% Biggest DOWN
Nov. 2, 2017 BO -15.54%
Aug. 8, 2017 BO -6.26%
May 9, 2017 BO +20.73%
Feb. 23, 2017 BO -6.49%
Nov. 8, 2016 BO -4.13%
Aug. 9, 2016 BO -19.58%
May 9, 2016 BO +10.16%

Avg (+ or -) 13.95%
Bias -0.63%, tiny negative bias on earnings.

With stock at 165.00 the data suggests these ranges:
Based on current IV (expected move into Friday per TOS): 145.60 to 184.40
Based on AVERAGE move over last 4 quarters: 141.98 to 188.02
Based on MAXIMUM move over last 4 Q’s (27.9%): 119.05 to 210.95
Based on DOWN max only (-22.7%): 127.53

Open to requests for other symbols.

SQ earnings analysis

#Earnings $SQ reports tonight. Below are details on earnings one-day moves over the last 12 quarters.

Feb. 27, 2019 AC +2.42%
Nov. 7, 2018 AC -9.02%
Aug. 1, 2018 AC +8.65%
May 2, 2018 AC +1.13%
Feb. 27, 2018 AC +0.30%
Nov. 8, 2017 AC +3.40%
Aug. 2, 2017 AC -4.68%
May 3, 2017 AC +8.86%
Feb. 22, 2017 AC +14.02% Biggest UP
Nov. 1, 2016 AC +6.41%
Aug. 3, 2016 AC +8.42%
May 5, 2016 AC -21.68% Biggest DOWN

Avg (+ or -) 7.42%
Bias 1.52%, positive bias on earnings.

With stock at 74.00 the data suggests these ranges:
Based on current IV (expected move into Friday per TOS): 69.18 to 78.82
Based on AVERAGE move over last 4 quarters: 68.51 to 79.49
Based on MAXIMUM move over last 4 Q’s (21.7%): 57.96 to 90.04
Based on UP max only (+14.0%): 84.37

Open to requests for other symbols.

SPX 1-dte

#SPX1dte Sold to Open $SPX May 1st 2890/2910-2965/2980 condors for 1.10. (IV: 9.61%, SPX: 2942)

CLX dub cal

#Earnings Bought to open $CLX May03/May10 157.5 put calendars and 160 call calendars .74 total. So this is a split-strike #DoubleCalendar, a bit lower max profit but a wider profit range.

CLX earnings analysis

#Earnings $CLX reports tomorrow morning. Below are details on earnings one-day moves over the last 12 quarters.

Considering a #DoubleCalendar

Feb. 4, 2019 BO +5.68%
Oct. 31, 2018 BO -2.85%
Aug. 2, 2018 BO +6.17% Biggest UP
May 2, 2018 BO -0.70%
Feb. 2, 2018 BO -6.71% Biggest DOWN
Nov. 1, 2017 BO +1.17%
Aug. 3, 2017 BO +2.09%
May 3, 2017 BO +0.85%
Feb. 3, 2017 BO +4.07%
Nov. 2, 2016 BO -3.19%
Aug. 3, 2016 BO +0.99%
May 3, 2016 BO +1.94%

Avg (+ or -) 3.03%
Bias 0.79%, positive bias on earnings.

With stock at 158.50 the data suggests these ranges:
Based on current IV (expected move into Friday per TOS): 152.89 to 164.11
Based on AVERAGE move over last 4 quarters: 153.84 to 163.46
Based on MAXIMUM move over last 4 Q’s (6.7%): 148.00 to 169.30
Based on UP max only (+6.2%): 168.44

Open to requests for other symbols.

SPX stopped out

#SPX1dte BTC $SPX Apr 30th 2920/2900 put spreads for 1.95. Condors sold yesterday for .80.

TNDM earnings analysis

#Earnings $TNDM reports tonight. Below are details on earnings one-day moves over the last 12 quarters.

Pretty crazy stock. Topped out above 300 in 2009 and again in 2014, but was trading below 3.00 early last year.

Feb. 26, 2019 AC +25.19% Biggest UP
Nov. 1, 2018 AC -1.62%
July 30, 2018 AC +10.95%
April 26, 2018 AC -2.37%
March 1, 2018 AC +14.75%
Oct. 26, 2017 AC -6.25%
July 27, 2017 AC -10.16%
April 27, 2017 AC -9.52%
March 8, 2017 AC -11.62%
Nov. 1, 2016 AC -58.87% Biggest DOWN
July 28, 2016 AC -14.78%
April 28, 2016 AC +2.29%

Avg (+ or -) 14.03%
Bias -5.17%, negative bias on earnings.

With stock at 63.00 the data suggests these ranges:
Based on current IV (expected move into Friday per TOS): 55.47 to 70.53
Based on AVERAGE move over last 4 quarters: 54.16 to 71.84
Based on MAXIMUM move over last 4 Q’s (58.9%): 25.91 to 100.09
Based on UP max only (+25.2%): 78.87

Open to requests for other symbols.

SPOT off

#Earnings BTC $SPOT May 3rd 127/129-145/147 #IronCondor for .25. Sold Friday for .95

AAPL earnings analysis

#Earnings $AAPL reports tonight. Below are details on earnings one-day moves over the last 12 quarters.

Jan. 29, 2019 AC +6.83% Biggest UP
Nov. 1, 2018 AC -6.63% Biggest DOWN
July 31, 2018 AC +5.89%
May 1, 2018 AC +4.41%
Feb. 1, 2018 AC -4.33%
Nov. 2, 2017 AC +2.61%
Aug. 1, 2017 AC +4.72%
May 2, 2017 AC -0.30%
Jan. 31, 2017 AC +6.09%
Oct. 25, 2016 AC -2.24%
July 26, 2016 AC +6.49%
April 26, 2016 AC -6.25%

Avg (+ or -) 4.73%
Bias 1.44%, positive bias on earnings.

With stock at 202.00 the data suggests these ranges:
Based on current IV (expected move into Friday per TOS): 192.37 to 211.63
Based on AVERAGE move over last 4 quarters: 192.44 to 211.56
Based on MAXIMUM move over last 4 Q’s (6.8%): 188.20 to 215.80
Based on DOWN max only (-6.6%): 188.61

Open to requests for other symbols.
GOOGL down

Alphabet is going to open with its biggest earnings move DOWN since January 2012.

SPX 1-dter

#SPX1dte We get an extra series this week, since the EOM (end-of-month) options expire on Tuesday.

Sold to Open $SPX Apr 30th 2900/2920-2970/2985 condors for .80. (IV: 8.73%, SPX: 2948)

SPX rolling

#SPX1dte BTC $SPX Apr 30th 2950/2970 call spreads for 4.05. Sold condors for 3.80 on Apr 15th. Too close for comfort.

#Rolling Sold SPX May 8th 2865/2890/2985/3010 condors for 4.55. My first 3,000+ strike!

Also, BTC Today’s 2955 calls for .10. Sold in the call spread this morning for .75.

GOOGL condor

#Earnings Sold to Open $GOOGL May 3rd 1210/1220-1340/1350 #IronCondor for 2.15.

WDC earnings analysis

#Earnings $WDC reports tonight. Below are details on earnings one-day moves over the last 12 quarters.

Jan. 24, 2019 AC +7.52% Biggest UP
Oct. 25, 2018 AC -18.18% Biggest DOWN
July 26, 2018 AC -7.73%
April 26, 2018 AC -7.99%
Jan. 25, 2018 AC +1.82%
Oct. 26, 2017 AC -2.53%
July 27, 2017 AC -7.54%
April 27, 2017 AC +3.92%
Jan. 25, 2017 AC -1.93%
Oct. 26, 2016 AC +5.41%
July 28, 2016 AC -11.52%
April 28, 2016 AC -11.28%

Avg (+ or -) 7.28%
Bias -4.17%, negative bias on earnings.

The FIVE-day outlook is more bearish, with a downside max of -23%.

With stock at 51.00 the data suggests these ranges:
Based on current IV (expected move into Friday per TOS): 46.50 to 55.50
Based on AVERAGE move over last 4 quarters: 47.29 to 54.71
Based on MAXIMUM move over last 4 Q’s (18.2%): 41.73 to 60.27
Based on UP max only (7.5%): 54.84

Open to requests for other symbols.
SPX 1-dte

#SPX1dte Since I closed today’s call spread on Friday, I moved it up 5-points and sold one again:

Sold $SPX Apr 29th 2955/2965 call spreads for .75.

GOOGL earnings analysis

#Earnings $GOOGL reports tonight. Below are details on earnings one-day moves over the last 12 quarters.

Feb. 4, 2019 AC +0.91%
Oct. 25, 2018 AC -1.79%
July 23, 2018 AC +3.89%
April 23, 2018 AC -4.76%
Feb. 1, 2018 AC -5.28% Biggest DOWN
Oct. 26, 2017 AC +4.26% Biggest UP
July 24, 2017 AC -2.93%
April 27, 2017 AC +3.71%
Jan. 26, 2017 AC -1.39%
Oct. 27, 2016 AC +0.27%
July 28, 2016 AC +3.32%
April 21, 2016 AC -5.41%

Avg (+ or -) 3.16%
Bias -0.43%, negative bias on earnings.

The FIVE-day outlook is more bearish, with a downside max of -8%.

With stock at 1,275.00 the data suggests these ranges:
Based on current IV (expected move into Friday per TOS): 1,227.78 TO 1,322.22
Based on AVERAGE move over last 4 quarters: 1,234.71 TO 1,315.29
Based on MAXIMUM move over last 4 Q’s (5.4%): 1,206.02 TO 1,343.98
Based on UP max only (4.3%): 1,329.32

Open to requests for other symbols.

SBUX closed

#Earnings Closed last batch for .95