
#SPX1dte Closed $SPX June 20th (monthlys) 2970/2990 call spreads for 1.75. Condors sold yesterday for 1.00. Cannot allow this to sit overnight as settlement on monthlys is Friday morning’s open. I’ll let the put side expire then.
Author Archives: Jeff
Good morning
All things hinge on the Fed… finally getting the VIX drop that just would not come.
SPX 1-dte
#SPX1dte Sold $SPX June 20th (monthly) 2845/2865-2970/2990 condors for 1.00, IV: 16.31%, SPX 2922.
Get out the way
#SPX1dte Closing call side on a couple condors before the FOMC report. I see the possibility of a strong rally if rates cut, but not a huge dive if they are not. Even so, I have a lot of room to downside in the put sides; call sides were tighter.
BTC $SPX june 19th 2965/2985 call spreads for .20. Condors sold yesterday for 1.00.
BTC June 20th (monthlys) 2960/2980 call spreads for 1.90. Condors sold for 2.50 on June 12th.
ORCL earnings analysis
#Earnings $ORCL reports tonight. Below are details on earnings one-day moves over the last 12 quarters.
March 14, 2019 AC -0.20%
Dec. 17, 2018 AC +0.26%
Sept. 17, 2018 AC -0.30%
June 19, 2018 AC -7.45%
March 19, 2018 AC -9.43% Biggest DOWN
Dec. 14, 2017 AC -3.76%
Sept. 14, 2017 AC -7.67%
June 21, 2017 AC +8.56% Biggest UP
March 15, 2017 AC +6.22%
Dec. 15, 2016 AC -4.30%
Sept. 15, 2016 AC -4.74%
June 16, 2016 AC +2.69%
Avg (+ or -) 4.63%
Bias -1.68%, negative bias on earnings.
With stock at 52.50 the data suggests these ranges:
Based on current IV (expected move into Friday per TOS): 49.84 to 55.16
Based on AVERAGE move over last 12 quarters: 50.07 to 54.93
Based on MAXIMUM move over last 12 Q’s (9.4%): 47.55 to 57.45
Based on UP Max only (+8.6%): 56.99
Open to requests for other symbols.
SPX 1-dte
#SPX1dte Sold $SPX June 19th 2845/2865-2965/2985 condors for 1.00. IV: 15.24%, SPX 2920.
IV has spiked due to Fed announcement tomorrow. Manage risk and watch your positions for the 2pm ET release.
ADBE earnings analysis
#Earnings $ADBE reports tonight. Below are details on earnings one-day moves over the last 12 quarters.
March 14, 2019 AC -3.95%
Dec. 13, 2018 AC -7.28% Biggest DOWN
Sept. 13, 2018 AC +2.29%
June 14, 2018 AC -2.43%
March 15, 2018 AC +3.05%
Dec. 14, 2017 AC +1.43%
Sept. 19, 2017 AC -4.24%
June 20, 2017 AC +2.36%
March 16, 2017 AC +3.80%
Dec. 15, 2016 AC -1.47%
Sept. 20, 2016 AC +7.11% Biggest UP
June 21, 2016 AC -5.72%
Avg (+ or -) 3.76%
Bias -0.42%, slight negative bias on earnings.
With stock at 278.50 the data suggests these ranges:
Based on current IV (expected move into Friday per TOS): 266.34 to 290.66
Based on AVERAGE move over last 12 quarters: 268.03 to 288.97
Based on MAXIMUM move over last 12 Q’s (7.3%): 258.23 to 298.77
Based on UP Max only (+7.1%): 298.30
Open to requests for other symbols.
Closed AVGO
FOMC decision on rate cut is tomorrow
2pm ET
SPX 9-dte
#SPX1dte Happy Summer Solstice Week, everyone!
Building back some of the hits I took on the screaming run higher:
Sold $SPX June 26th 2770/2795-2960/2985 condors for 3.00.
Smaller account i sold the 5-wide with same shorts for .75
AVGO roll
#Earnings #Rolling Sold $AVGO June 21st 267.5/262.5 put spreads for 2.40.
I have the 270/267.5 put spread expiring today, so at the moment it will be max loss of 2.50. So I rolled to next week, going down ne stark and also widening to 5.
But it is rallying now so loss may be less than 2.50. I wanted to sell the roll before its price dropped much more.
SPX 1-dte
#SPX1dte Sold $SPX June 17th 2830/2850-2915/2935 condors for .90. (IV 7.28%, SPX 2887)
Expiring today: June 14th 2825/2845-2915/2935 condors, sold yesterday for 1.00
Econ Calendar for week of 6/24/19
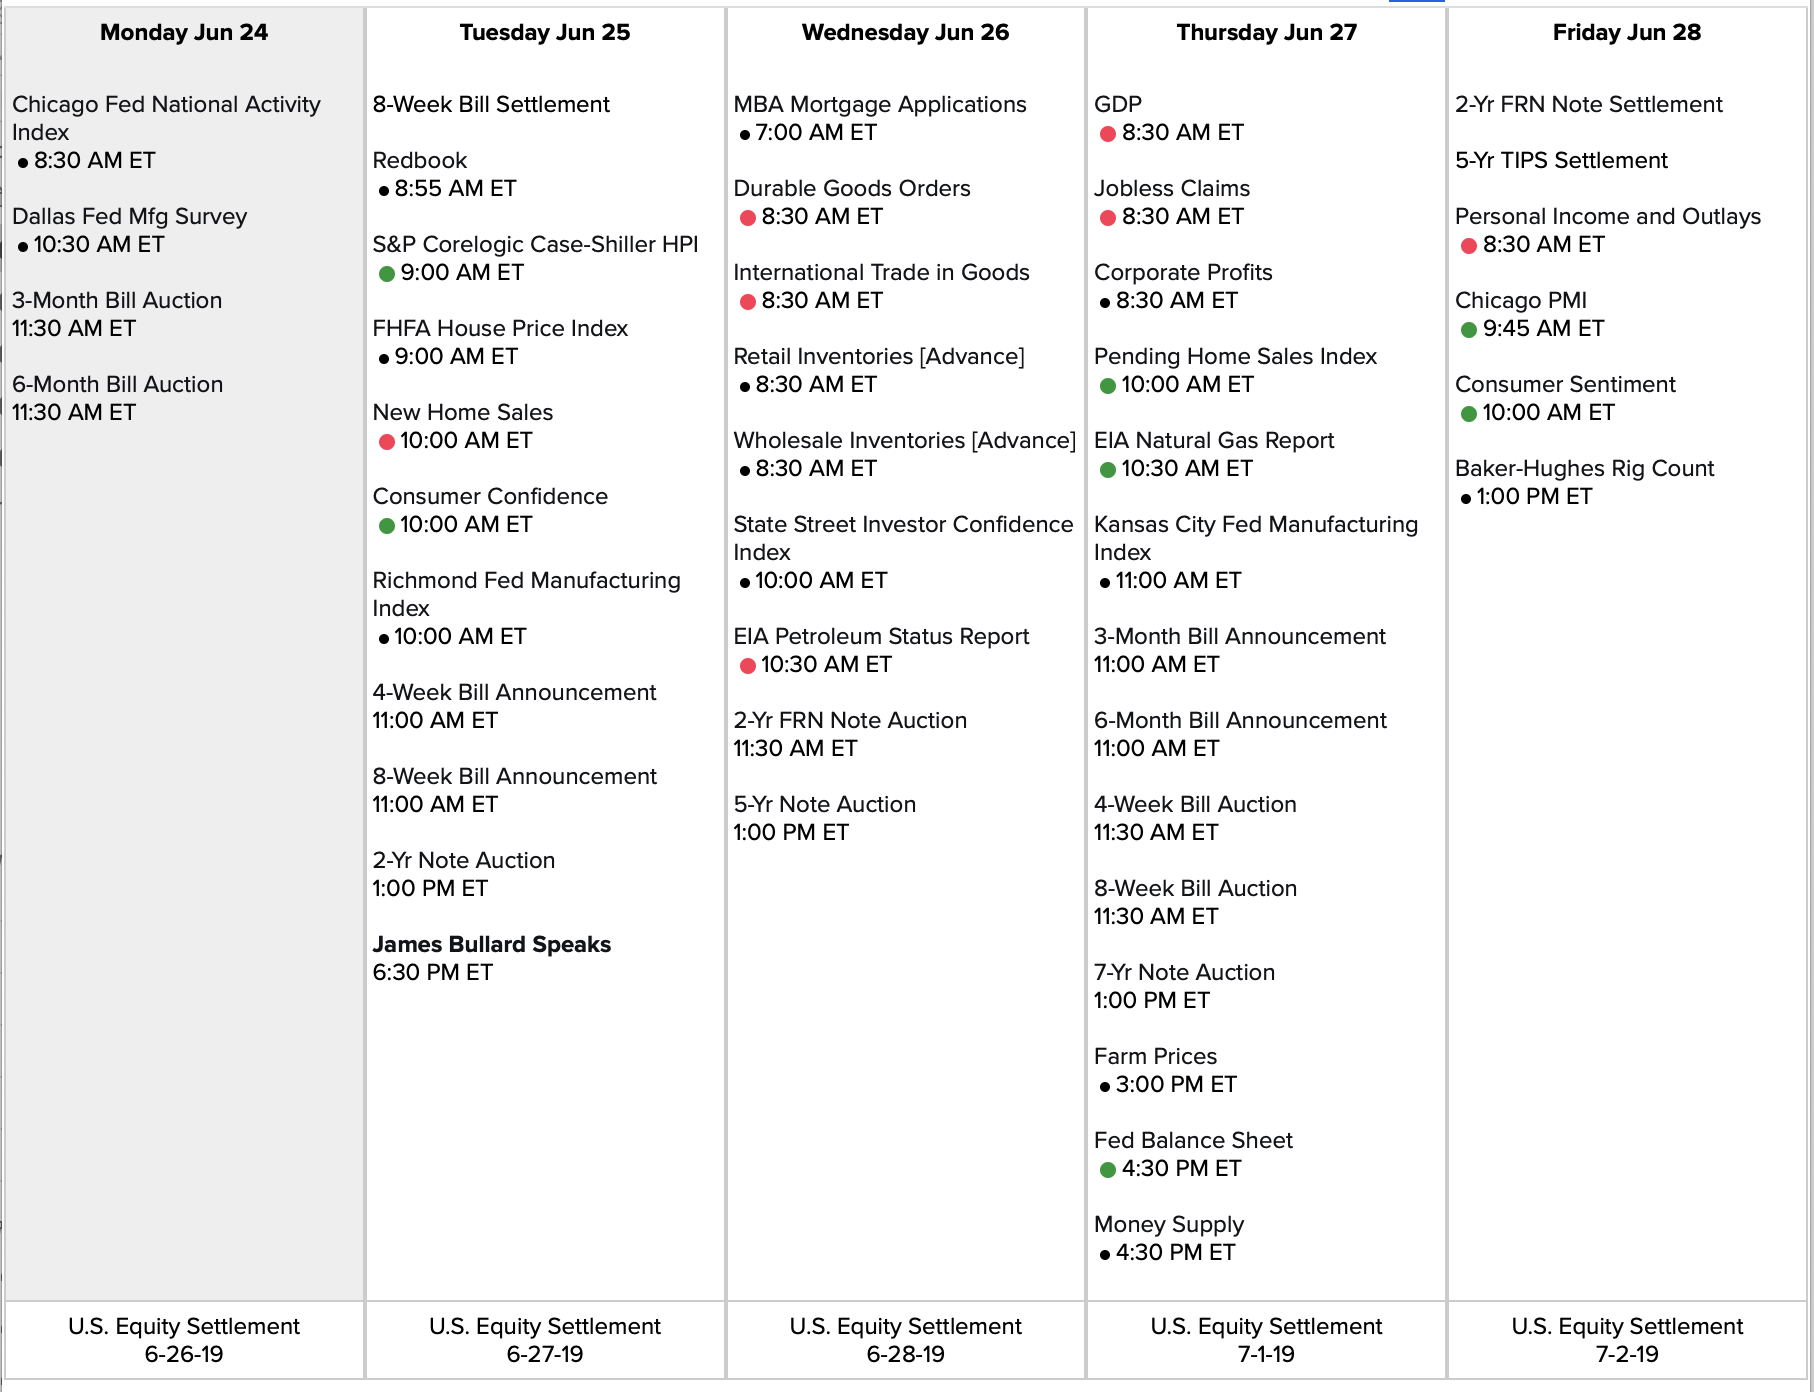

Link to calendar: https://us.econoday.com/byweek.asp?day=24&month=6&year=2019&cust=us&lid=0
SPX 1-dte
#SPX1dte Sold to Open $SPX June 14th 2825/2845-2915/2935 condors for 1.00. (IV: 11.41%, SPX 2882)
AVGO condor
#Earnings Sold $AVGO 267.5/270/290/292.5 #IronCondor for 1.35. Better than 1:1, with a bullish lean.
AVGO earnings analysis
#Earnings $AVGO reports tonight. Below are details on earnings one-day moves over the last 12 quarters.
March 14, 2019 AC +8.23% Biggest UP
Dec. 6, 2018 AC +0.58%
Sept. 6, 2018 AC +7.69%
June 7, 2018 AC -2.53%
March 15, 2018 AC -4.81% Biggest DOWN
Dec. 6, 2017 AC 0.00%
Aug. 24, 2017 AC -3.70%
June 1, 2017 AC +8.49%
March 1, 2017 AC +0.99%
Dec. 8, 2016 AC +4.90%
Sept. 1, 2016 AC -2.24%
June 2, 2016 AC +4.93%
Avg (+ or -) 4.09%
Bias 1.88%, positive bias on earnings.
With stock at 282.50 the data suggests these ranges:
Based on current IV (expected move into Friday per TOS): 265.11 to 299.89
Based on AVERAGE move over last 12 quarters: 270.94 to 294.06
Based on MAXIMUM move over last 12 Q’s (8.5%): 258.52 to 306.48
Based on DOWN Max only (-4.8%): 268.91
Open to requests for other symbols.
SPX 1-dte
#SPX1dte BTC $SPX June 14th 2815/2790 put spreads for .25. Sold for 2.50 on Friday.
Expired: June 12th 2825/2845/2920/2940, sold yesterday for .95.
RH earnings analysis
#Earnings $RH reports tonight. Below are details on earnings one-day moves over the last 12 quarters.
March 28, 2019 AC -21.96%
Dec. 3, 2018 AC +10.90%
Sept. 4, 2018 AC -13.06%
June 11, 2018 AC +30.54%
March 27, 2018 AC +22.48%
Dec. 5, 2017 AC +0.79%
Sept. 6, 2017 AC +44.75% Biggest UP
June 1, 2017 AC -25.69% Biggest DOWN
March 28, 2017 AC +14.94%
Dec. 8, 2016 AC -18.13%
Sept. 8, 2016 AC +3.08%
June 8, 2016 AC -21.23%
Avg (+ or -) 18.96%
Bias 2.28%, positive bias on earnings.
With stock at 93.50 the data suggests these ranges:
Based on current IV (expected move into Friday per TOS): 78.98 to 108.02
Based on AVERAGE move over last 12 quarters: 75.77 to 111.23
Based on MAXIMUM move over last 12 Q’s (44.8%): 51.66 to 135.34
Based on DOWN Max only (-25.7%): 69.48
Open to requests for other symbols.
LULU earnings analysis
#Earnings $LULU reports tonight. Below are details on earnings one-day moves over the last 12 quarters.
March 27, 2019 AC +14.12%
Dec. 6, 2018 AC -13.36%
Aug. 30, 2018 AC +13.08%
May 31, 2018 AC +16.31% Biggest UP
March 27, 2018 AC +9.21%
Dec. 6, 2017 AC +6.42%
Aug. 31, 2017 AC +7.19%
June 1, 2017 AC +11.54%
March 29, 2017 AC -23.43% Biggest DOWN
Dec. 7, 2016 AC +15.04%
Sept. 1, 2016 AC -10.55%
June 8, 2016 BO +4.90%
Avg (+ or -) 12.10%
Bias 4.21%, positive bias on earnings.
With stock at 171.00 the data suggests these ranges:
Based on current IV (expected move into Friday per TOS): 154.13 to 187.87
Based on AVERAGE move over last 12 quarters: 150.32 to 191.68
Based on MAXIMUM move over last 12 Q’s (23.4%): 130.93 to 211.07
Based on UP Max only (+16.3%): 198.89
Open to requests for other symbols.
SPX roll
SPX 1-dte
#SPX1dte Sold $SPX June 12th 2825/2845-2920/2940 condors for .95. (IV 11.85%, SPX 2881)
SPXpire
#SPX1dte No trades today… but this expired:
$SPX June 10th 2805/2825-2920/2940 condors, sold Friday for 1.00.
Expiring
#OptionsExpiration #Earnings #IronCondor
$FIVE 117/120-138/141 condors, sold Wednesday for 1.31
Have a good weekend all!
SPX 1-dte
#SPX1dte Sold to open $SPX June 10th 2805/2825-2920/2940 condors for 1.00. IV: 10.4%, SPX 2875.
Last Friday I sold the 2820/2800… but they were the CALL side.
Econ Calendar for week of 6/10/19
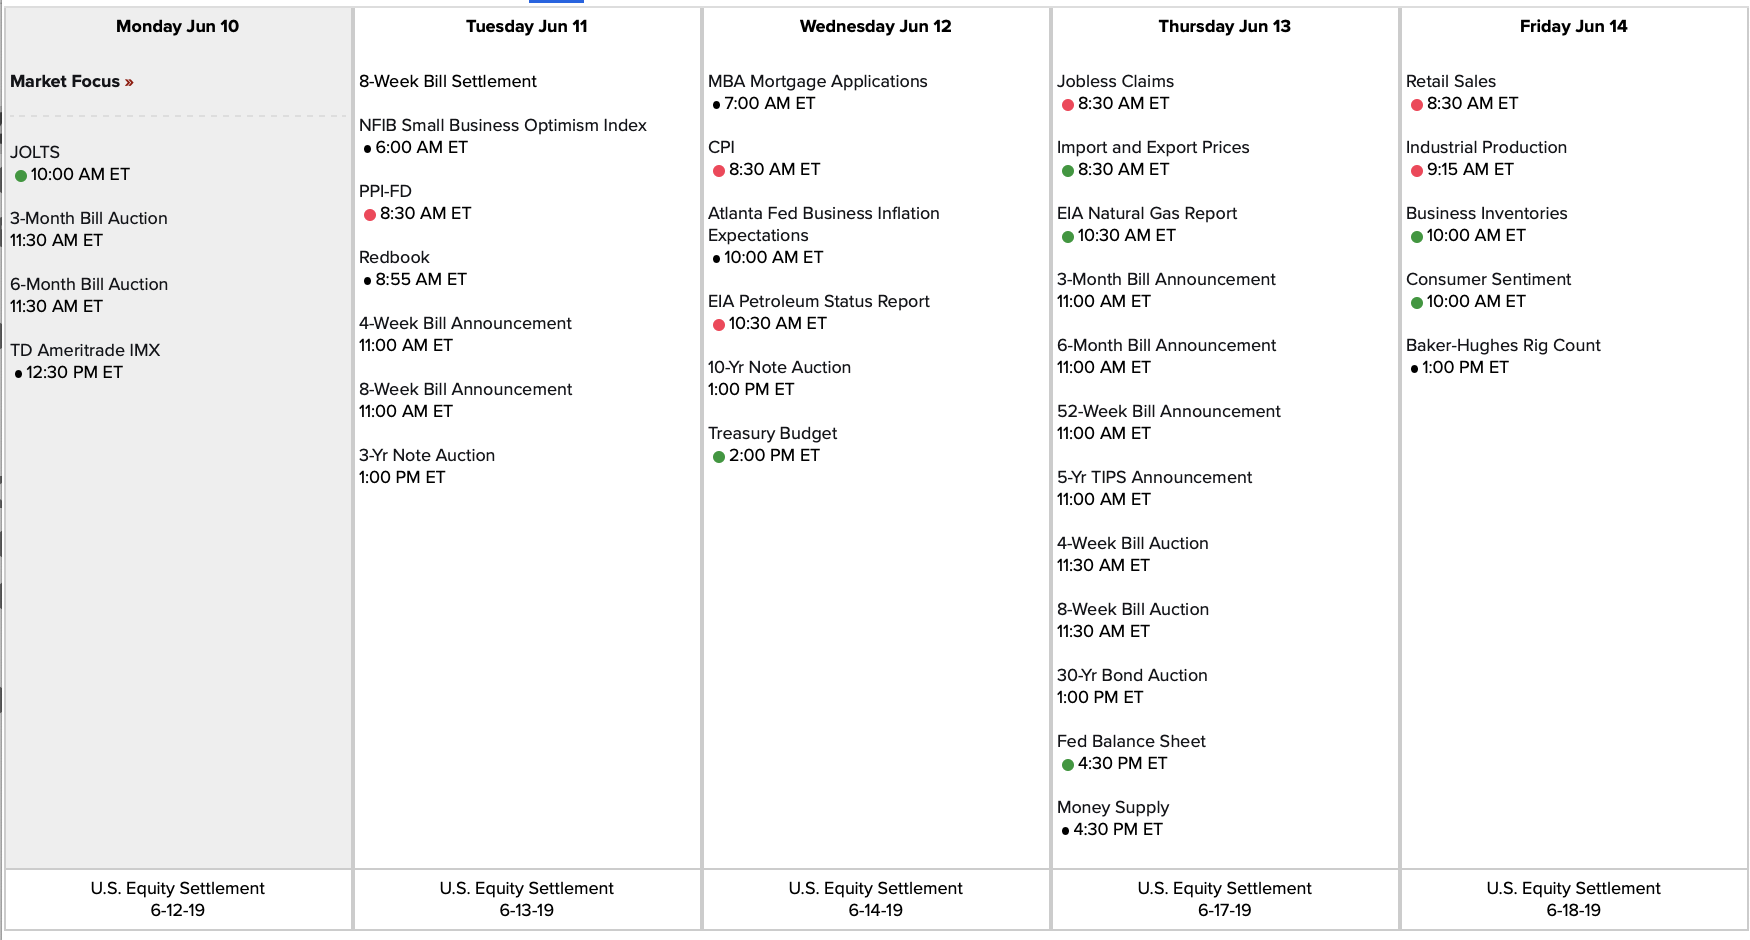
Link to calendar: https://us.econoday.com/byweek.asp?day=10&month=6&year=2019&cust=us&lid=0
Euphoria and fear
#Market The Indices continuing a searingly bullish week, but the $VIX is spiking today as well.
I got filled on this trade as the market was going UP…
Sold $SPX June 14th 2815/2790 put spreads for 2.50. (SPX 2877)
SPX stopped
#SPX1dte Closed the call spread I sold yesterday… bullish action not stopping. Still a couple points above the 13.67 VIX level that would cancel the Downside Warning. But given the action, I have to stop selling call spreads. Will look to try some put spreads on any minor pullback.
Stopped $SPX June 10th 2870/2895 call spreads for 5.25. Sold yesterday for 2.50.
Also watching June 14th 2890/2915 calls, which have a current stop point of 2867.
May Jobs Report
#Jobs — big drop from April’s blowout
+75,000 non-farm payroll jobs, vs. 180K expected
Unemployment at 3.6%, unchanged
U6 unemployment at 7.1%, down by 0.2
Wages up 0.2%, 3.1% year over year
Labor force participation 62.8%, unchanged
April revised down from 263K to 224K
March revised down from 189K to 153K
SPX 5-dte roll
#SPX1dte Tempting fate, I know. Sold $SPX June 10th (Monday) 2870/2895 call spreads for 2.50.
Commissions
I’m working on a spreadsheet and I’d like to know the various commission structures that you all have (or have had in the past). Can everyone reading this give me a brief explanation in the comments? I will start with what I get from Interactive Brokers. If someone else has already commented with the same structure you have or have had, please don’t repeat it.
I am not looking for dollar amounts (although it is fine if you include them). I mainly need the structure; i.e., if there is a ticket charge, if per option price goes down with higher quantity, if there are set prices on all options or if index/ETF/ etc have different prices, etc.
Thanks!
SPX 9-dte
#SPX1dte Too much bullish action not to sell something.
Sold $SPX June 14th 2890/2915 call spreads for 2.00, IV 14.39%, SPX 2826
FIVE condor
#Earnings Selling this with a bullish lean based on its history… -3.2% on downside, +11.3% on upside
Sold $FIVE June 7th 117/120-138/141 #IronCondor for 1.31.
UBER roll
#Earnings #StrangleRoll #ThatDidntTakeLong
Sold this strangle Friday as a roll from losing #LongStraddle. Already breached, so rolling. Fortunately, the ATM options are not much more than the strangle sold for.
BTC $UBER June 14th 37/43 #ShortStrangle for 1.40. Sold for 1.00 on Friday.
STO $UBER June 21st 40/46 #ShortStrangle for 1.05
SFIX earnings analysis
#Earnings $SFIX reports tonight. Below are details on earnings one-day moves over the last 6 quarters, its entire history on the exchange.
March 11, 2019 AC +25.20%
Dec. 10, 2018 AC -20.90%
Oct. 1, 2018 AC -35.15% Biggest DOWN
June 7, 2018 AC +26.48% Biggest UP
March 12, 2018 AC -3.60%
Dec. 19, 2017 AC -9.77%
Avg (+ or -) 20.18%
Bias -2.96%, slightly negative bias on earnings.
With stock at 23.50 the data suggests these ranges:
Based on current IV (expected move into Friday per TOS): 19.80 to 27.20
Based on AVERAGE move over last 12 quarters: 18.76 to 28.24
Based on MAXIMUM move over last 12 Q’s (35.2%): 15.24 to 31.76
Based on UP Max only (+26.5%): 29.72
Open to requests for other symbols.
FIVE earnings analysis
#Earnings $FIVE reports tonight. Below are details on earnings one-day moves over the last 12 quarters.
March 27, 2019 AC +8.15%
Dec. 6, 2018 BO -2.66%
Sept. 6, 2018 AC +13.31%
June 6, 2018 AC +21.86% Biggest UP
March 21, 2018 AC +4.20%
Nov. 30, 2017 AC -0.46%
Aug. 30, 2017 AC -3.45% Biggest DOWN
June 1, 2017 AC +0.50%
March 22, 2017 AC +10.80%
Dec. 1, 2016 AC +9.87%
Aug. 31, 2016 AC -1.14%
June 2, 2016 AC +2.07%
Avg (+ or -) 6.54%
Bias 5.25%, Strongly positive bias on earnings.
With stock at 124.00 the data suggests these ranges:
Based on current IV (expected move into Friday per TOS): 113.86 to 134.14
Based on AVERAGE move over last 12 quarters: 115.89 to 132.11
Based on MAXIMUM move over last 12 Q’s (21.9%): 96.89 to 151.11
Based on DOWN Max only (-3.4%): 119.72
Open to requests for other symbols.
Calls closed
#LongLEAPs #SyntheticCoveredCalls Both sets sold yesterday breached. Waiting before I roll.
BTC $TQQQ June 14th 52 calls for 1.90. Sold for 1.15 yesterday.
BTC $SQ June 14th 64 calls for 1.92. Sold for .97 yesterday.
SPX stops
#SPX1dte Euphoria has gripped the markets! Buy everything!
Took the morning pullback to close my 1-day trade and another one I should have closed yesterday.
BTC $SPX June 5th 2830 calls for 2.10. Will hold short 2840 long calls for more. Condors sold yesterday for .95.
BTC June 7th 2810/2835 call spreads for 11.40. Sold for 2.55 on Monday. Will take a few rolls to recoup this one.
SPX 1-dte
Sold to Open $SPX June 5th 2730/2750-2830/2840 condors for .95, IV: 13.53%, SPX 2800.
What a face-ripping day for shorts.
Long Leaps still kicking
#LongLEAPs #SyntheticCoveredCalls Still holding long leaps, both underwater but cost basis now about zero after all these calls I have sold. I also ended up long some TQQQ stock at 58.00, which I will hold for the eventual recovery.
Sold $TQQQ June 14th 52 calls for 1.15.
Sold $SQ June 14th 64 calls for .97
AMBA earnings analysis
#Earnings $AMBA reports tonight. Below are details on earnings one-day moves over the last 12 quarters.
March 5, 2019 AC +3.74%
Nov. 29, 2018 AC +18.48% Biggest UP
Aug. 30, 2018 AC -3.62%
June 5, 2018 AC -12.93%
March 1, 2018 AC +13.46%
Nov. 30, 2017 AC +14.29%
Aug. 31, 2017 AC -22.35% Biggest DOWN
June 6, 2017 AC -10.24%
Feb. 28, 2017 AC -4.42%
Dec. 1, 2016 AC -11.27%
Sept. 1, 2016 AC -6.67%
June 2, 2016 AC +9.39%
Avg (+ or -) 10.91%
Bias -1.01%, negative bias on earnings.
With stock at 40.00 the data suggests these ranges:
Based on current IV (expected move into Friday per TOS): 36.00 to 44.00
Based on AVERAGE move over last 12 quarters: 35.64 to 44.36
Based on MAXIMUM move over last 12 Q’s (22.4%): 31.06 to 48.94
Based on UP Max only (+18.5%): 47.39
Open to requests for other symbols.
SPX puts closed
#SPX1-dte Two extra roll spreads closed:
BTC $SPX June 5th 2700/2675 put spread for .25. Sold for 2.70 last Wednesday.
BTC $SPX June 7th 2675/2650 put spreads for .60. Sold yesterday for 3.10.
June 7th call spread at 2810 under pressure, but not too worries yet. This is a bear trend rally; at least until it isn’t.
CRM earnings analysis
#Earnings $CRM reports tonight. Below are details on earnings one-day moves over the last 12 quarters.
March 4, 2019 AC -0.96%
Nov. 27, 2018 AC +10.27% Biggest UP
Aug. 29, 2018 AC -1.71%
May 29, 2018 AC +1.90%
Feb. 28, 2018 AC +2.73%
Nov. 21, 2017 AC -1.81%
Aug. 22, 2017 AC +0.12%
May 18, 2017 AC -0.39%
Feb. 28, 2017 AC +3.02%
Nov. 17, 2016 AC +3.43%
Aug. 31, 2016 AC -4.41% Biggest DOWN
May 18, 2016 AC +4.13%
Avg (+ or -) 2.91%
Bias 1.36%, positive bias on earnings.
With stock at 145.00 the data suggests these ranges:
Based on current IV (expected move into Friday per TOS): 136.15 to 153.85
Based on AVERAGE move over last 12 quarters: 141.76 to 150.24
Based on MAXIMUM move over last 12 Q’s (10.3%): 131.01 to 160.99
Based on DOWN Max only (-4.4%): 139.56
Open to requests for other symbols.
SPX put spread sold to…
SPX put spread sold to offset calls sold this morning.
Sold $SPX Jun 7th 2675/2650 put spreads for 3.10
TIF earnings analysis
#Earnings $TIF reports tomorrow morning. Below are details on earnings one-day moves over the last 12 quarters.
March 22, 2019 BO +3.14%
Nov. 28, 2018 BO -11.82% Biggest DOWN
Aug. 28, 2018 BO +0.99%
May 23, 2018 BO +23.28% Biggest UP
March 16, 2018 BO -5.06%
Nov. 29, 2017 BO -1.58%
Aug. 24, 2017 BO -1.31%
May 24, 2017 BO -8.70%
March 17, 2017 BO +2.71%
Nov. 29, 2016 BO +3.14%
Aug. 25, 2016 BO +6.40%
May 25, 2016 BO +0.06%
Avg (+ or -) 5.68%
Bias 0.94%, positive bias on earnings.
With stock at 90.00 the data suggests these ranges:
Based on current IV (expected move into Friday per TOS): 83.84 to 96.16
Based on AVERAGE move over last 12 quarters: 84.89 to 95.11
Based on MAXIMUM move over last 12 Q’s (23.3%): 69.05 to 110.95
Based on DOWN Max only (-11.8%): 79.36
Open to requests for other symbols.
SPX 4-dte
#SPX1dte Replacing the call spread that closed this morning:
Sold $SPX June 7th 2810/2835 call spreads for 2.55.
SPX 1-dte
#SPX1dte Closed at the open: $SPX Jun 3rd 2690/2670 put spreads for .10. Condors sold for 1.35 on Friday. I’ll let the 2890 call side expire.
Closed in the pre-market on GTC order: June 5th 2845/2870 call spreads for .25. Sold for 2.80 on Thursday.
Econ Calendar for week of 6/3/19
#Jobs report for May is Friday at 8:30am ET
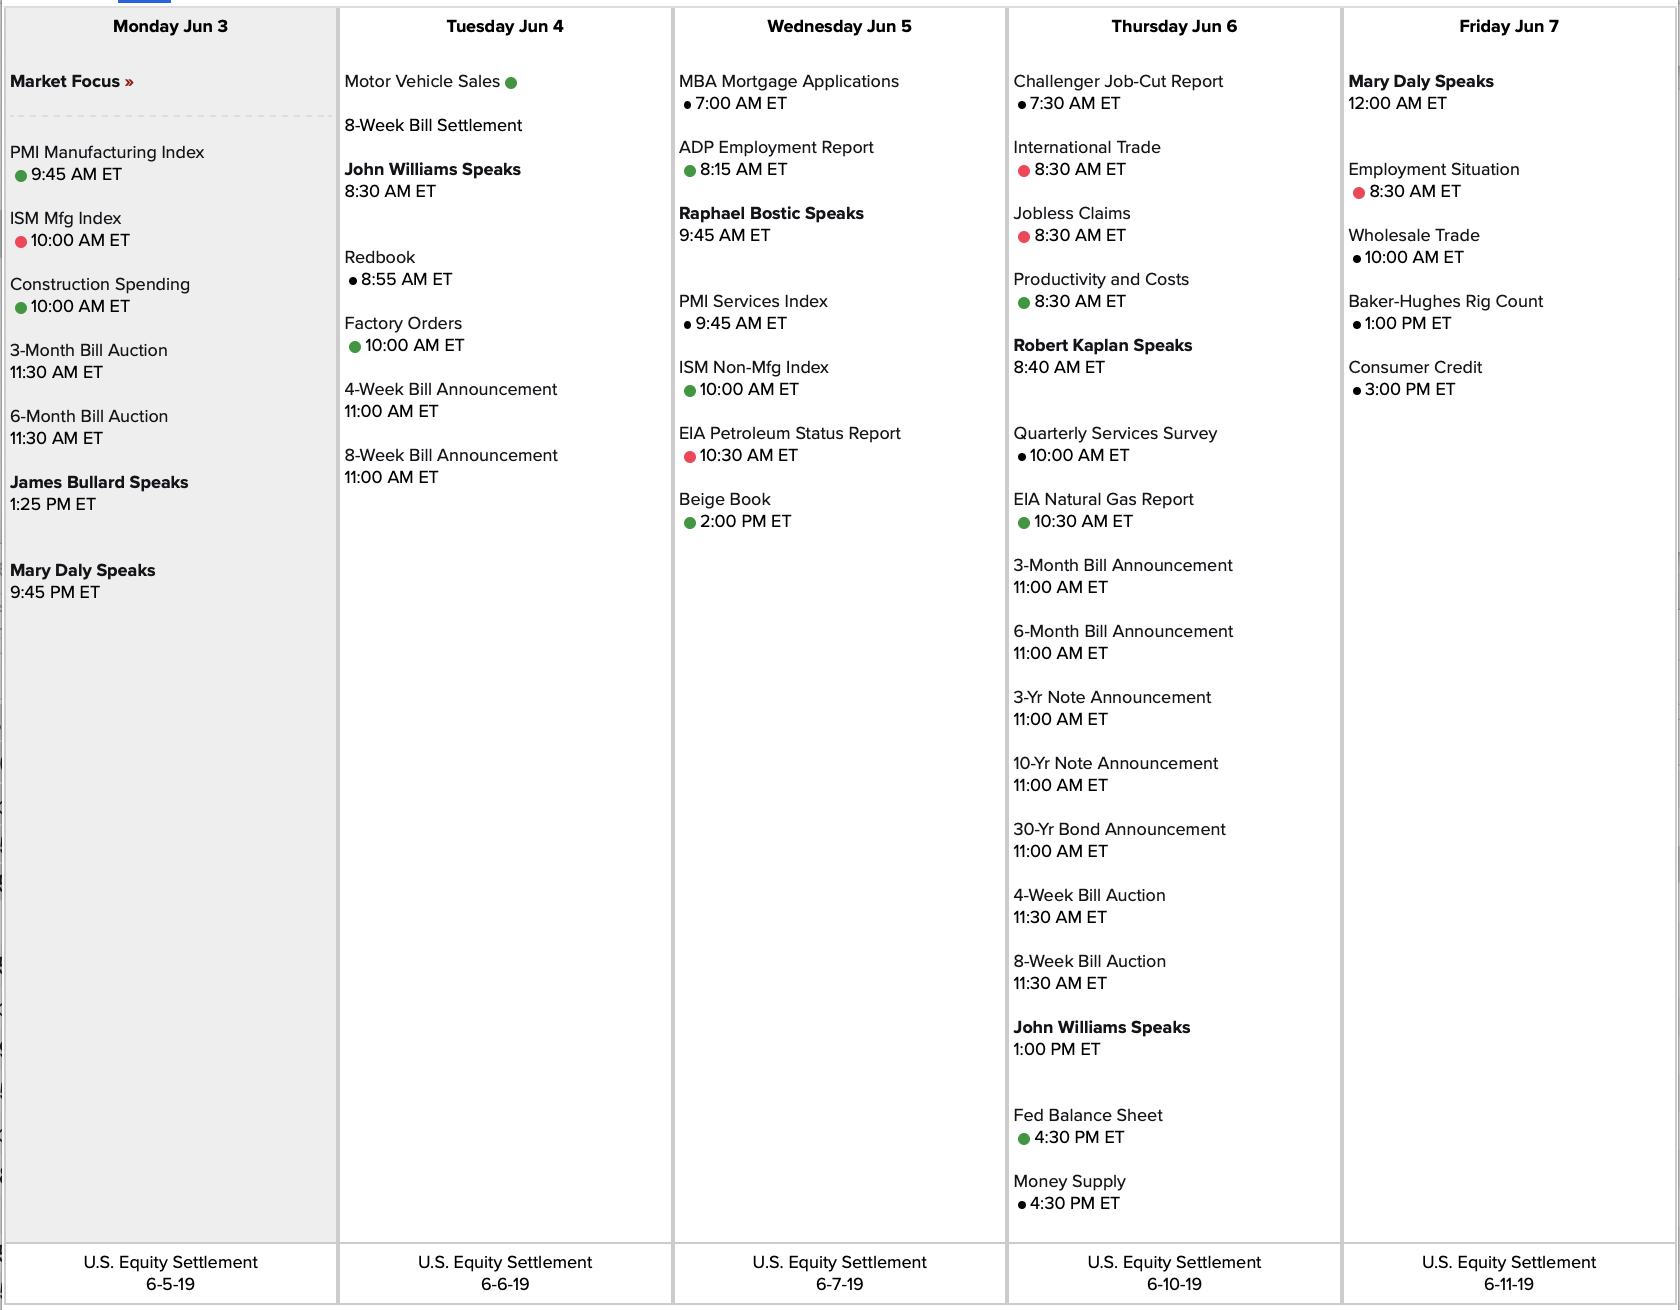
Link to calendar: https://us.econoday.com/byweek.asp?day=3&month=6&year=2019&cust=us&lid=0
SPX 1-dte
#SPX1dte Sold to Open June 3rd $SPX 2670/2690-2800/2820 condors for 1.35. (IV 13.37%, SPX 2756)
UBER bad
#Earnings So much for my speculative play of a #LongStraddle. Seem like the stock really likes 40. Nonetheless it did bounce around today but was unable to sell at the best times because other commitments had me running around the house and town too much.
Sold $UBER 40 straddle for .45. Bought yesterday for 3.15
#Rolling: Sold $UBER Jun 14th 37/43 #ShortStrangle for 1.00. See if I can work that three times and get back the losses.
That loss erases my decent win on $ANF straddle, leaving me flat for the week.
Also, Sold to close $DG call calendar for .10. Bought #DoubleCalendar for .39 on Wednesday. Long 118 put as lottery ticket for next week.
SPX 1-dte
#SPX1dte Somehow I plum forgot to put this on, so I did it after the bell.
Sold $SPX May 31st 2720/2740-2825/2845 condors for 1.10. (IV 14.3%, SPX 2788).
UBER straddle
#Earnings This is speculative because $UBER has not previously posted earnings, but my guess is this stock will move more than $3.00 (7.5%) on earnings. $LYFT moved over 10% on its first report.
So I’m buying a #LongStraddle. I’m going to try to leg in, which is often a mistake for me, but trying any way.
Just now bought $UBER May 31st 40 call for 1.45.
Order in to buy 40 put for 1.50, banking that stock will rise a bit from here. If not, I’ll buy the 39.5 put instead.
SPX 1-dte rolls
SPX1dte Sold to Open $SPX June 5th 2845/2870 call spreads for 2.80. Offsetting put spreads sold yesterday.
BTC May 31st 2725/2700 put spreads for .35. Sold for 2.10 on May 21.
ULTA earnings analysis
#Earnings $ULTA reports tonight. Below are details on earnings one-day moves over the last 12 quarters.
March 14, 2019 AC +8.28%
Dec. 6, 2018 AC -13.12% Biggest DOWN
Aug. 30, 2018 AC +6.37%
May 31, 2018 AC -0.71%
March 15, 2018 AC +7.63%
Nov. 30, 2017 AC -4.11%
Aug. 24, 2017 AC -9.13%
May 25, 2017 AC +3.19%
March 9, 2017 AC +4.62%
Dec. 1, 2016 AC -1.56%
Aug. 25, 2016 AC -6.11%
May 26, 2016 AC +9.10% Biggest UP
Avg (+ or -) 6.16%
Bias 0.37%, tiny positive bias on earnings.
With stock at 325.00 the data suggests these ranges:
Based on current IV (expected move into Friday per TOS): 300.92 to 349.08
Based on AVERAGE move over last 12 quarters: 304.98 to 345.02
Based on MAXIMUM move over last 12 Q’s (13.1%): 282.36 to 367.64
Based on UP Max only (+9.1%): 354.58
Open to requests for other symbols.
COST earnings analysis
#Earnings $COST reports tonight. Below are details on earnings one-day moves over the last 12 quarters.
March 7, 2019 AC +5.08% Biggest UP
Dec. 13, 2018 AC -8.58% Biggest DOWN
Oct. 4, 2018 AC -5.55%
May 31, 2018 AC -0.55%
March 7, 2018 AC -0.89%
Dec. 14, 2017 AC +3.32%
Oct. 5, 2017 AC -5.97%
May 25, 2017 AC +1.79%
March 2, 2017 AC -4.33%
Dec. 7, 2016 AC +2.43%
Sept. 29, 2016 AC +3.40%
May 25, 2016 AC +3.57%
Avg (+ or -) 3.79%
Bias -0.52%, negative bias on earnings.
With stock at 242.50 the data suggests these ranges:
Based on current IV (expected move into Friday per TOS): 232.65 to 252.35
Based on AVERAGE move over last 12 quarters: 233.31 to 251.69
Based on MAXIMUM move over last 12 Q’s (8.6%): 221.69 to 263.31
Based on UP Max only (+5.1%): 254.82
Open to requests for other symbols.
UBER earnings
#Earnings $UBER reports its first earnings tomorrow after the bell. Expected move +/- 2.82 by Friday.
DG dub cal
#Earnings Bought to Open $DG May31/Jun07 118 #DoubleCalendar for .38 & .39.
DG earnings analysis
#Earnings $DG reports tomorrow morning. Below are details on earnings one-day moves over the last 12 quarters.
March 14, 2019 BO -7.49%
Dec. 4, 2018 BO -6.80%
Aug. 30, 2018 BO -0.97%
May 31, 2018 BO -9.36%
March 15, 2018 BO +4.75%
Dec. 7, 2017 BO +2.77%
Aug. 31, 2017 BO -5.43%
June 1, 2017 BO +6.54% Biggest UP
March 16, 2017 BO +0.53%
Dec. 1, 2016 BO -4.96%
Aug. 25, 2016 BO -17.62% Biggest DOWN
May 26, 2016 BO +4.61%
Avg (+ or -) 5.99%
Bias -2.79%, negative bias on earnings.
With stock at 119.00 the data suggests these ranges:
Based on current IV (expected move into Friday per TOS): 112.81 to 125.19
Based on AVERAGE move over last 12 quarters: 111.88 to 126.12
Based on MAXIMUM move over last 12 Q’s (17.6%): 98.03 to 139.97
Based on UP Max only (+6.5%): 126.78
Open to requests for other symbols.
SPX duck, stop and roll
DLTR earnings analysis
#Earnings $DLTR reports tomorrow morning. Below are details on earnings one-day moves over the last 12 quarters.
March 6, 2019 BO +5.11%
Nov. 29, 2018 BO +6.13%
Aug. 30, 2018 BO -15.54% Biggest DOWN
May 31, 2018 BO -14.28%
March 7, 2018 BO -14.47%
Nov. 21, 2017 BO +2.41%
Aug. 24, 2017 BO +5.62%
May 25, 2017 BO +0.92%
March 1, 2017 BO +0.20%
Nov. 22, 2016 BO +8.15%
Aug. 25, 2016 BO -9.93%
May 26, 2016 BO +12.77% Biggest UP
Avg (+ or -) 7.96%
Bias -1.08%, negative bias on earnings.
With stock at 96.50 the data suggests these ranges:
Based on current IV (expected move into Friday per TOS): 89.87 to 103.13
Based on AVERAGE move over last 12 quarters: 88.82 to 104.18
Based on MAXIMUM move over last 12 Q’s (15.5%): 81.50 to 111.50
Based on UP Max only (+12.8%): 108.82
Open to requests for other symbols.
PANW earnings analysis
#Earnings $PANW reports tonight. Below are details on earnings one-day moves over the last 12 quarters.
Feb. 26, 2019 AC +8.20%
Nov. 29, 2018 AC -1.76%
Sept. 6, 2018 AC +3.28%
June 4, 2018 BO -0.52%
Feb. 26, 2018 AC +2.31%
Nov. 20, 2017 AC +4.82%
Aug. 31, 2017 AC +10.53%
May 31, 2017 AC +17.20% Biggest UP
Feb. 28, 2017 AC -24.15% Biggest DOWN
Nov. 21, 2016 AC -13.24%
Aug. 30, 2016 AC -7.16%
May 26, 2016 AC -12.36%
Avg (+ or -) 8.79%
Bias -1.07%, negative bias on earnings.
With stock at 212.50 the data suggests these ranges:
Based on current IV (expected move into Friday per TOS): 194.69 to 230.31
Based on AVERAGE move over last 12 quarters: 193.81 to 231.19
Based on MAXIMUM move over last 12 Q’s (24.2%): 161.18 to 263.82
Based on UP Max only (+17.2%): 249.05
Open to requests for other symbols.
ANF closing
#Earnings Sold to close first batch of $ANF May 31st 25 puts for 5.25. #LongStraddle bought yesterday for 3.23.
SPX calls closed
#SPX1dte Closing right at the bell on GTC order: $SPX May 31st 2885/2910 call spreads for .25. Sold on Friday for 2.75.
ANF straddle
#Earnings Bought to open $ANF May 31st 25 #LongStraddle for 3.23. Needs a 12.9% move. Avg has been 16.1%
SPX 1-dte
#SPX1dte sold $SPX May 29th 2750/2770-2850/2865 condors for 1.05 (IV 13.88%, SPX 2812.
Also, in smaller account sold 2765/2770-2850/2855 condors for .45.
CPRI earnings analysis
#Earnings $CPRI (formerly $KORS) reports tomorrow morning. Below are details on earnings one-day moves over the last 12 quarters. Feb 2019 is from symbol CPRI, and the remainder are under symbol KORS.
Feb. 6, 2019 BO +11.29%
Nov. 7, 2018 BO -14.62% Biggest DOWN
Aug. 8, 2018 BO +6.72%
May 30, 2018 BO -11.44%
Feb. 7, 2018 BO +1.02%
Nov. 6, 2017 BO +14.69%
Aug. 8, 2017 BO +21.54% Biggest UP
May 31, 2017 BO -8.51%
Feb. 7, 2017 BO -10.80%
Nov. 10, 2016 AC -3.97%
Aug. 10, 2016 BO -2.79%
June 1, 2016 BO +6.62%
Avg (+ or -) 9.50%
Bias 0.81%, slightly positive bias on earnings.
With stock at 39.00 the data suggests these ranges:
Based on current IV (expected move into Friday per TOS): 34.65 to 43.35
Based on AVERAGE move over last 12 quarters: 35.29 to 42.71
Based on MAXIMUM move over last 12 Q’s (21.5%): 30.60 to 47.40
Based on DOWN Max only (-14.6%): 33.30
Open to requests for other symbols.
ANF earnings analysis
#Earnings $ANF reports tomorrow morning. Below are details on earnings one-day moves over the last 12 quarters.
March 6, 2019 BO +20.37%
Nov. 29, 2018 BO +20.91%
Aug. 30, 2018 BO -17.15%
June 1, 2018 BO -8.72%
March 7, 2018 BO +11.90%
Nov. 17, 2017 BO +23.90% Biggest UP
Aug. 24, 2017 BO +17.06%
May 25, 2017 BO +8.99%
March 2, 2017 BO +13.94%
Nov. 18, 2016 BO -13.76%
Aug. 30, 2016 BO -20.30% Biggest DOWN
May 26, 2016 BO -15.66%
Avg (+ or -) 16.06%
Bias 3.46%, positive bias on earnings.
With stock at 25.25 the data suggests these ranges:
Based on current IV (expected move into Friday per TOS): 21.96 to 28.54
Based on AVERAGE move over last 12 quarters: 21.20 to 29.30
Based on MAXIMUM move over last 12 Q’s (23.9%): 19.22 to 31.28
Based on DOWN Max only (-20.3%): 20.12
Open to requests for other symbols.
SPX 1-dte closed
#SPX1dte Closed $SPX May 28th 2775 puts for .10. Condors sold for 1.10 on Friday. Nice to have risk off so early.
SPX 1-dte
#SPX1dte Sold $SPX May 28th 2755/2775-2870/2885 condors for 1.10. (IV: 10.17%, SPX 2828)
Econ Calendar for week of 5/27/19
GDP report on Thursday morning.

Link to calendar: https://us.econoday.com/byweek.asp?day=27&month=5&year=2019&cust=us&lid=0
SPX 1-dte
#SPX1dte Sold $SPX May 31st 2885/2910 call spreads for 2.60. Rotated one of these this week, so selling another, offset by the 2725/2700 put spread.
INTU closed
#Earnings Sold to close $INTU 245 #DoubleCalendar for 1.35, small loss. Opened yesterday for 1.525.
There was a chance to close with a profit this morning, but I thought the morning weakness would drag it down. But it keeps going higher, so I’m bailing. Often a tough call closing these trades..
SPX 1-dte leg out
#SPX1dte For a refreshing change, legging out worked for me today.
Bought to close $SPX May 24th 2840/2815 put spreads for 5.20. Sold in a condor for 4.55 on 5/16.
Barring disaster, expiring today: May 24th 2735/2755-2860/2880 condors, sold yesterday for .90
CTRP closed
#Earnings Closed second half of $CTRP May24/May31 38 calendar for .75. Opened for .26 on Wednesday, closed for .58, avg price. A small double, but a double nonetheless.
SPX 1-dte
#SPX1dte Sold to Open $SPX May 24th 2735/2755-2860/2880 condors for .90 (IV: 16.11%, SPX 2820)
Dub Cal updates
#Earnings Paid .02 to close the 110 put calendar on $LOW. It’s too low. Bought for .50 on Tuesday.
Sold to close half of the $CTRP May24/May31 38 #DoubleCalendar for .40. Bought yesterday for .26. Looking to close the rest when price drifts a bit higher, today or tomorrow.
Filled on more of the $INTU dub cal at 1.55. Still only partial fill, but I’m not going to go any higher.
I want to play $SPLK bullish but the market isn’t cooperating with my confidence.

