
Sold to Open $SPX June 5th 2730/2750-2830/2840 condors for .95, IV: 13.53%, SPX 2800.
What a face-ripping day for shorts.
Sold to Open $SPX June 5th 2730/2750-2830/2840 condors for .95, IV: 13.53%, SPX 2800.
What a face-ripping day for shorts.
#LongLEAPs #SyntheticCoveredCalls Still holding long leaps, both underwater but cost basis now about zero after all these calls I have sold. I also ended up long some TQQQ stock at 58.00, which I will hold for the eventual recovery.
Sold $TQQQ June 14th 52 calls for 1.15.
Sold $SQ June 14th 64 calls for .97
#Earnings $AMBA reports tonight. Below are details on earnings one-day moves over the last 12 quarters.
March 5, 2019 AC +3.74%
Nov. 29, 2018 AC +18.48% Biggest UP
Aug. 30, 2018 AC -3.62%
June 5, 2018 AC -12.93%
March 1, 2018 AC +13.46%
Nov. 30, 2017 AC +14.29%
Aug. 31, 2017 AC -22.35% Biggest DOWN
June 6, 2017 AC -10.24%
Feb. 28, 2017 AC -4.42%
Dec. 1, 2016 AC -11.27%
Sept. 1, 2016 AC -6.67%
June 2, 2016 AC +9.39%
Avg (+ or -) 10.91%
Bias -1.01%, negative bias on earnings.
With stock at 40.00 the data suggests these ranges:
Based on current IV (expected move into Friday per TOS): 36.00 to 44.00
Based on AVERAGE move over last 12 quarters: 35.64 to 44.36
Based on MAXIMUM move over last 12 Q’s (22.4%): 31.06 to 48.94
Based on UP Max only (+18.5%): 47.39
Open to requests for other symbols.
#SPX1-dte Two extra roll spreads closed:
BTC $SPX June 5th 2700/2675 put spread for .25. Sold for 2.70 last Wednesday.
BTC $SPX June 7th 2675/2650 put spreads for .60. Sold yesterday for 3.10.
June 7th call spread at 2810 under pressure, but not too worries yet. This is a bear trend rally; at least until it isn’t.
#Earnings $CRM reports tonight. Below are details on earnings one-day moves over the last 12 quarters.
March 4, 2019 AC -0.96%
Nov. 27, 2018 AC +10.27% Biggest UP
Aug. 29, 2018 AC -1.71%
May 29, 2018 AC +1.90%
Feb. 28, 2018 AC +2.73%
Nov. 21, 2017 AC -1.81%
Aug. 22, 2017 AC +0.12%
May 18, 2017 AC -0.39%
Feb. 28, 2017 AC +3.02%
Nov. 17, 2016 AC +3.43%
Aug. 31, 2016 AC -4.41% Biggest DOWN
May 18, 2016 AC +4.13%
Avg (+ or -) 2.91%
Bias 1.36%, positive bias on earnings.
With stock at 145.00 the data suggests these ranges:
Based on current IV (expected move into Friday per TOS): 136.15 to 153.85
Based on AVERAGE move over last 12 quarters: 141.76 to 150.24
Based on MAXIMUM move over last 12 Q’s (10.3%): 131.01 to 160.99
Based on DOWN Max only (-4.4%): 139.56
Open to requests for other symbols.
SPX put spread sold to offset calls sold this morning.
Sold $SPX Jun 7th 2675/2650 put spreads for 3.10
#Earnings $TIF reports tomorrow morning. Below are details on earnings one-day moves over the last 12 quarters.
March 22, 2019 BO +3.14%
Nov. 28, 2018 BO -11.82% Biggest DOWN
Aug. 28, 2018 BO +0.99%
May 23, 2018 BO +23.28% Biggest UP
March 16, 2018 BO -5.06%
Nov. 29, 2017 BO -1.58%
Aug. 24, 2017 BO -1.31%
May 24, 2017 BO -8.70%
March 17, 2017 BO +2.71%
Nov. 29, 2016 BO +3.14%
Aug. 25, 2016 BO +6.40%
May 25, 2016 BO +0.06%
Avg (+ or -) 5.68%
Bias 0.94%, positive bias on earnings.
With stock at 90.00 the data suggests these ranges:
Based on current IV (expected move into Friday per TOS): 83.84 to 96.16
Based on AVERAGE move over last 12 quarters: 84.89 to 95.11
Based on MAXIMUM move over last 12 Q’s (23.3%): 69.05 to 110.95
Based on DOWN Max only (-11.8%): 79.36
Open to requests for other symbols.
#SPX1dte Replacing the call spread that closed this morning:
Sold $SPX June 7th 2810/2835 call spreads for 2.55.
#SPX1dte Closed at the open: $SPX Jun 3rd 2690/2670 put spreads for .10. Condors sold for 1.35 on Friday. I’ll let the 2890 call side expire.
Closed in the pre-market on GTC order: June 5th 2845/2870 call spreads for .25. Sold for 2.80 on Thursday.
#Jobs report for May is Friday at 8:30am ET
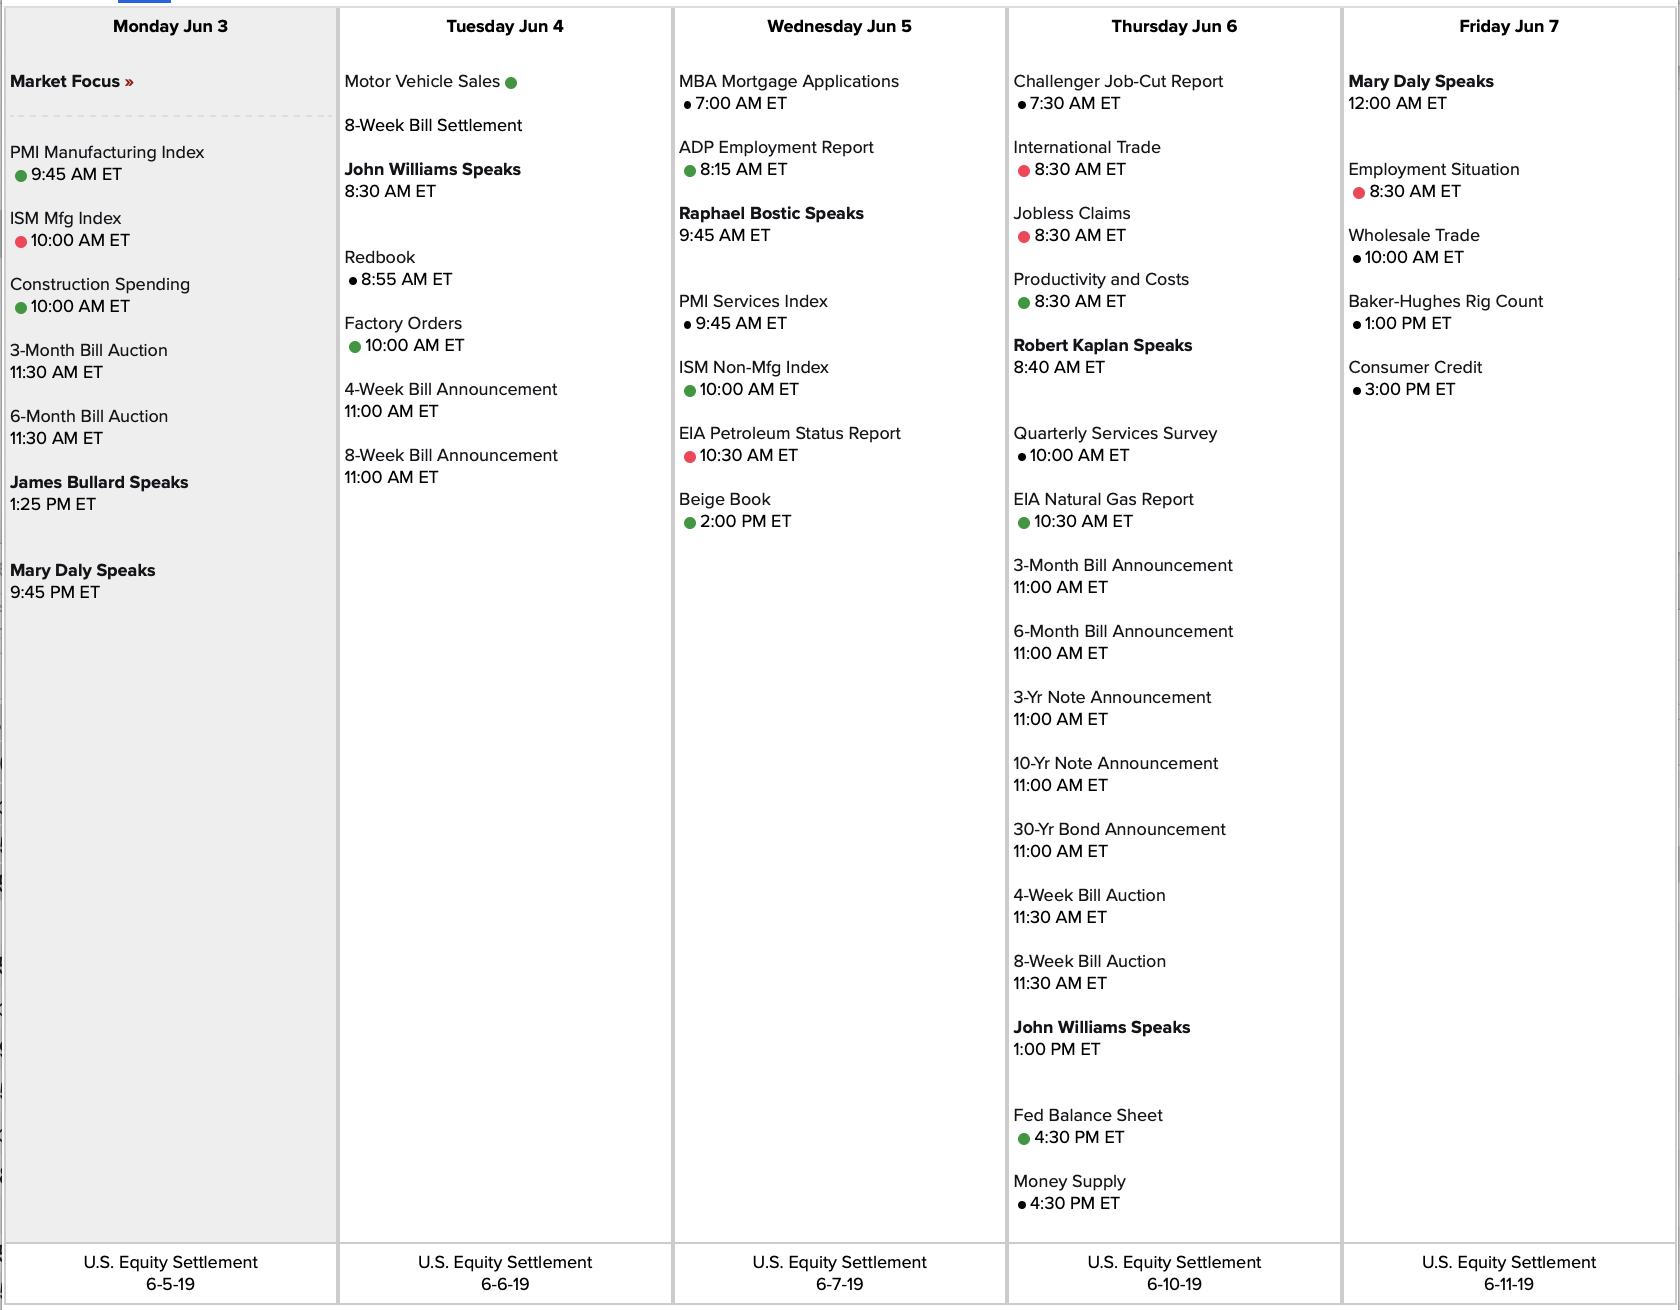

Link to calendar: https://us.econoday.com/byweek.asp?day=3&month=6&year=2019&cust=us&lid=0
#SPX1dte Sold to Open June 3rd $SPX 2670/2690-2800/2820 condors for 1.35. (IV 13.37%, SPX 2756)
#Earnings So much for my speculative play of a #LongStraddle. Seem like the stock really likes 40. Nonetheless it did bounce around today but was unable to sell at the best times because other commitments had me running around the house and town too much.
Sold $UBER 40 straddle for .45. Bought yesterday for 3.15
#Rolling: Sold $UBER Jun 14th 37/43 #ShortStrangle for 1.00. See if I can work that three times and get back the losses.
That loss erases my decent win on $ANF straddle, leaving me flat for the week.
Also, Sold to close $DG call calendar for .10. Bought #DoubleCalendar for .39 on Wednesday. Long 118 put as lottery ticket for next week.
#SPX1dte Somehow I plum forgot to put this on, so I did it after the bell.
Sold $SPX May 31st 2720/2740-2825/2845 condors for 1.10. (IV 14.3%, SPX 2788).
#Earnings This is speculative because $UBER has not previously posted earnings, but my guess is this stock will move more than $3.00 (7.5%) on earnings. $LYFT moved over 10% on its first report.
So I’m buying a #LongStraddle. I’m going to try to leg in, which is often a mistake for me, but trying any way.
Just now bought $UBER May 31st 40 call for 1.45.
Order in to buy 40 put for 1.50, banking that stock will rise a bit from here. If not, I’ll buy the 39.5 put instead.
SPX1dte Sold to Open $SPX June 5th 2845/2870 call spreads for 2.80. Offsetting put spreads sold yesterday.
BTC May 31st 2725/2700 put spreads for .35. Sold for 2.10 on May 21.
#Earnings $ULTA reports tonight. Below are details on earnings one-day moves over the last 12 quarters.
March 14, 2019 AC +8.28%
Dec. 6, 2018 AC -13.12% Biggest DOWN
Aug. 30, 2018 AC +6.37%
May 31, 2018 AC -0.71%
March 15, 2018 AC +7.63%
Nov. 30, 2017 AC -4.11%
Aug. 24, 2017 AC -9.13%
May 25, 2017 AC +3.19%
March 9, 2017 AC +4.62%
Dec. 1, 2016 AC -1.56%
Aug. 25, 2016 AC -6.11%
May 26, 2016 AC +9.10% Biggest UP
Avg (+ or -) 6.16%
Bias 0.37%, tiny positive bias on earnings.
With stock at 325.00 the data suggests these ranges:
Based on current IV (expected move into Friday per TOS): 300.92 to 349.08
Based on AVERAGE move over last 12 quarters: 304.98 to 345.02
Based on MAXIMUM move over last 12 Q’s (13.1%): 282.36 to 367.64
Based on UP Max only (+9.1%): 354.58
Open to requests for other symbols.
#Earnings $COST reports tonight. Below are details on earnings one-day moves over the last 12 quarters.
March 7, 2019 AC +5.08% Biggest UP
Dec. 13, 2018 AC -8.58% Biggest DOWN
Oct. 4, 2018 AC -5.55%
May 31, 2018 AC -0.55%
March 7, 2018 AC -0.89%
Dec. 14, 2017 AC +3.32%
Oct. 5, 2017 AC -5.97%
May 25, 2017 AC +1.79%
March 2, 2017 AC -4.33%
Dec. 7, 2016 AC +2.43%
Sept. 29, 2016 AC +3.40%
May 25, 2016 AC +3.57%
Avg (+ or -) 3.79%
Bias -0.52%, negative bias on earnings.
With stock at 242.50 the data suggests these ranges:
Based on current IV (expected move into Friday per TOS): 232.65 to 252.35
Based on AVERAGE move over last 12 quarters: 233.31 to 251.69
Based on MAXIMUM move over last 12 Q’s (8.6%): 221.69 to 263.31
Based on UP Max only (+5.1%): 254.82
Open to requests for other symbols.
#Earnings $UBER reports its first earnings tomorrow after the bell. Expected move +/- 2.82 by Friday.
#Earnings Bought to Open $DG May31/Jun07 118 #DoubleCalendar for .38 & .39.
#Earnings $DG reports tomorrow morning. Below are details on earnings one-day moves over the last 12 quarters.
March 14, 2019 BO -7.49%
Dec. 4, 2018 BO -6.80%
Aug. 30, 2018 BO -0.97%
May 31, 2018 BO -9.36%
March 15, 2018 BO +4.75%
Dec. 7, 2017 BO +2.77%
Aug. 31, 2017 BO -5.43%
June 1, 2017 BO +6.54% Biggest UP
March 16, 2017 BO +0.53%
Dec. 1, 2016 BO -4.96%
Aug. 25, 2016 BO -17.62% Biggest DOWN
May 26, 2016 BO +4.61%
Avg (+ or -) 5.99%
Bias -2.79%, negative bias on earnings.
With stock at 119.00 the data suggests these ranges:
Based on current IV (expected move into Friday per TOS): 112.81 to 125.19
Based on AVERAGE move over last 12 quarters: 111.88 to 126.12
Based on MAXIMUM move over last 12 Q’s (17.6%): 98.03 to 139.97
Based on UP Max only (+6.5%): 126.78
Open to requests for other symbols.
#Earnings $DLTR reports tomorrow morning. Below are details on earnings one-day moves over the last 12 quarters.
March 6, 2019 BO +5.11%
Nov. 29, 2018 BO +6.13%
Aug. 30, 2018 BO -15.54% Biggest DOWN
May 31, 2018 BO -14.28%
March 7, 2018 BO -14.47%
Nov. 21, 2017 BO +2.41%
Aug. 24, 2017 BO +5.62%
May 25, 2017 BO +0.92%
March 1, 2017 BO +0.20%
Nov. 22, 2016 BO +8.15%
Aug. 25, 2016 BO -9.93%
May 26, 2016 BO +12.77% Biggest UP
Avg (+ or -) 7.96%
Bias -1.08%, negative bias on earnings.
With stock at 96.50 the data suggests these ranges:
Based on current IV (expected move into Friday per TOS): 89.87 to 103.13
Based on AVERAGE move over last 12 quarters: 88.82 to 104.18
Based on MAXIMUM move over last 12 Q’s (15.5%): 81.50 to 111.50
Based on UP Max only (+12.8%): 108.82
Open to requests for other symbols.
#Earnings $PANW reports tonight. Below are details on earnings one-day moves over the last 12 quarters.
Feb. 26, 2019 AC +8.20%
Nov. 29, 2018 AC -1.76%
Sept. 6, 2018 AC +3.28%
June 4, 2018 BO -0.52%
Feb. 26, 2018 AC +2.31%
Nov. 20, 2017 AC +4.82%
Aug. 31, 2017 AC +10.53%
May 31, 2017 AC +17.20% Biggest UP
Feb. 28, 2017 AC -24.15% Biggest DOWN
Nov. 21, 2016 AC -13.24%
Aug. 30, 2016 AC -7.16%
May 26, 2016 AC -12.36%
Avg (+ or -) 8.79%
Bias -1.07%, negative bias on earnings.
With stock at 212.50 the data suggests these ranges:
Based on current IV (expected move into Friday per TOS): 194.69 to 230.31
Based on AVERAGE move over last 12 quarters: 193.81 to 231.19
Based on MAXIMUM move over last 12 Q’s (24.2%): 161.18 to 263.82
Based on UP Max only (+17.2%): 249.05
Open to requests for other symbols.
#Earnings Sold to close first batch of $ANF May 31st 25 puts for 5.25. #LongStraddle bought yesterday for 3.23.
#SPX1dte Closing right at the bell on GTC order: $SPX May 31st 2885/2910 call spreads for .25. Sold on Friday for 2.75.
#Earnings Bought to open $ANF May 31st 25 #LongStraddle for 3.23. Needs a 12.9% move. Avg has been 16.1%
#SPX1dte sold $SPX May 29th 2750/2770-2850/2865 condors for 1.05 (IV 13.88%, SPX 2812.
Also, in smaller account sold 2765/2770-2850/2855 condors for .45.
#Earnings $CPRI (formerly $KORS) reports tomorrow morning. Below are details on earnings one-day moves over the last 12 quarters. Feb 2019 is from symbol CPRI, and the remainder are under symbol KORS.
Feb. 6, 2019 BO +11.29%
Nov. 7, 2018 BO -14.62% Biggest DOWN
Aug. 8, 2018 BO +6.72%
May 30, 2018 BO -11.44%
Feb. 7, 2018 BO +1.02%
Nov. 6, 2017 BO +14.69%
Aug. 8, 2017 BO +21.54% Biggest UP
May 31, 2017 BO -8.51%
Feb. 7, 2017 BO -10.80%
Nov. 10, 2016 AC -3.97%
Aug. 10, 2016 BO -2.79%
June 1, 2016 BO +6.62%
Avg (+ or -) 9.50%
Bias 0.81%, slightly positive bias on earnings.
With stock at 39.00 the data suggests these ranges:
Based on current IV (expected move into Friday per TOS): 34.65 to 43.35
Based on AVERAGE move over last 12 quarters: 35.29 to 42.71
Based on MAXIMUM move over last 12 Q’s (21.5%): 30.60 to 47.40
Based on DOWN Max only (-14.6%): 33.30
Open to requests for other symbols.
#Earnings $ANF reports tomorrow morning. Below are details on earnings one-day moves over the last 12 quarters.
March 6, 2019 BO +20.37%
Nov. 29, 2018 BO +20.91%
Aug. 30, 2018 BO -17.15%
June 1, 2018 BO -8.72%
March 7, 2018 BO +11.90%
Nov. 17, 2017 BO +23.90% Biggest UP
Aug. 24, 2017 BO +17.06%
May 25, 2017 BO +8.99%
March 2, 2017 BO +13.94%
Nov. 18, 2016 BO -13.76%
Aug. 30, 2016 BO -20.30% Biggest DOWN
May 26, 2016 BO -15.66%
Avg (+ or -) 16.06%
Bias 3.46%, positive bias on earnings.
With stock at 25.25 the data suggests these ranges:
Based on current IV (expected move into Friday per TOS): 21.96 to 28.54
Based on AVERAGE move over last 12 quarters: 21.20 to 29.30
Based on MAXIMUM move over last 12 Q’s (23.9%): 19.22 to 31.28
Based on DOWN Max only (-20.3%): 20.12
Open to requests for other symbols.
#SPX1dte Closed $SPX May 28th 2775 puts for .10. Condors sold for 1.10 on Friday. Nice to have risk off so early.
#SPX1dte Sold $SPX May 28th 2755/2775-2870/2885 condors for 1.10. (IV: 10.17%, SPX 2828)
GDP report on Thursday morning.

Link to calendar: https://us.econoday.com/byweek.asp?day=27&month=5&year=2019&cust=us&lid=0
#SPX1dte Sold $SPX May 31st 2885/2910 call spreads for 2.60. Rotated one of these this week, so selling another, offset by the 2725/2700 put spread.
#Earnings Sold to close $INTU 245 #DoubleCalendar for 1.35, small loss. Opened yesterday for 1.525.
There was a chance to close with a profit this morning, but I thought the morning weakness would drag it down. But it keeps going higher, so I’m bailing. Often a tough call closing these trades..
#SPX1dte For a refreshing change, legging out worked for me today.
Bought to close $SPX May 24th 2840/2815 put spreads for 5.20. Sold in a condor for 4.55 on 5/16.
Barring disaster, expiring today: May 24th 2735/2755-2860/2880 condors, sold yesterday for .90
#Earnings Closed second half of $CTRP May24/May31 38 calendar for .75. Opened for .26 on Wednesday, closed for .58, avg price. A small double, but a double nonetheless.
#SPX1dte Sold to Open $SPX May 24th 2735/2755-2860/2880 condors for .90 (IV: 16.11%, SPX 2820)
#Earnings Paid .02 to close the 110 put calendar on $LOW. It’s too low. Bought for .50 on Tuesday.
Sold to close half of the $CTRP May24/May31 38 #DoubleCalendar for .40. Bought yesterday for .26. Looking to close the rest when price drifts a bit higher, today or tomorrow.
Filled on more of the $INTU dub cal at 1.55. Still only partial fill, but I’m not going to go any higher.
I want to play $SPLK bullish but the market isn’t cooperating with my confidence.
#Earnings Bought $INTU May 24/May31 245 #DoubleCalendar for 1.50. Only a partial fill, and then price seems to be running higher. This is not heavy mover normally. Positioned slightly bullish since everything has pulled back today, and it has a bullish bias on earnings..
#Earnings $INTU reports tonight. Below are details on earnings one-day moves over the last 12 quarters.
Feb. 21, 2019 AC +6.76% Biggest UP
Nov. 19, 2018 AC -2.03%
Aug. 23, 2018 AC +1.96%
May 22, 2018 AC +2.98%
Feb. 22, 2018 AC -0.18%
Nov. 20, 2017 AC -3.79% Biggest DOWN
Aug. 22, 2017 AC -1.90%
May 23, 2017 AC +6.72%
Feb. 23, 2017 AC +6.05%
Nov. 17, 2016 AC +1.91%
Aug. 23, 2016 AC -3.50%
May 24, 2016 AC -2.13%
Avg (+ or -) 3.33%
Bias 1.07%, positive bias on earnings.
With stock at 242.50 the data suggests these ranges:
Based on current IV (expected move into Friday per TOS): 253.87 to 276.61
Based on AVERAGE move over last 12 quarters: 234.43 to 250.57
Based on MAXIMUM move over last 12 Q’s (6.8%): 226.11 to 258.89
Based on maximum DOWN only (-3.8%): 233.31
Open to requests for other symbols.
#Earnings $SPLK reports tonight. Below are details on earnings one-day moves over the last 12 quarters.
Feb. 28, 2019 AC -0.90%
Nov. 29, 2018 AC +9.93%
Aug. 23, 2018 AC +14.81%
May 24, 2018 AC -5.20%
March 1, 2018 AC +9.26%
Nov. 16, 2017 AC +17.89% Biggest UP
Aug. 24, 2017 AC +8.47%
May 25, 2017 AC -6.97%
Feb. 23, 2017 AC -3.23%
Nov. 29, 2016 AC +0.41%
Aug. 25, 2016 AC -10.10% Biggest DOWN
May 26, 2016 AC +2.56%
Avg (+ or -) 7.48%
Bias 3.08%, strongly positive bias on earnings.
With stock at 131.00 the data suggests these ranges:
Based on current IV (expected move into Friday per TOS): 121.63 to 140.37
Based on AVERAGE move over last 12 quarters: 120.28 to 139.72
Based on MAXIMUM move over last 12 Q’s (17.9%): 106.74 to 153.26
Based on max DOWN move only (-10.1%): 116.87
Open to requests for other symbols.
#SPX1dte Closed on GTC order: $SPX May 31st 2920/2945 call spread for .30. Sold Tuesday for 3.00.
#SPX1dte Closed $SPX May 22nd 2825/2805 put spreads for .10. Condors sold yesterday for 1.00. Flirting with a bit too much volatility lately to allow these to expire comfortably.
#Earnings Out of the three candidates this morning, this one had the best Dub-Cal return and lowest average post-earnings move (other two were $BBY and $NTAP). However, it did have its biggest moves in last two quarters.
Bought $CTRP May 24/May31 38 #DoubleCalendar for .25 and .27. Double size since cost is so low.
#Earnings $CTRP reports tonight. Below are details on earnings one-day moves over the last 12 quarters.
March 4, 2019 AC +19.77% Biggest UP
Nov. 7, 2018 AC -19.01% Biggest DOWN
Sept. 5, 2018 AC +5.43%
May 22, 2018 AC +3.98%
March 14, 2018 AC -1.94%
Nov. 1, 2017 AC -2.29%
Aug. 30, 2017 AC -2.40%
May 10, 2017 AC -3.52%
Feb. 22, 2017 AC +1.44%
Nov. 23, 2016 AC +9.80%
Aug. 31, 2016 AC +3.40%
June 15, 2016 AC +1.50%
Avg (+ or -) 6.21%
Bias 1.35%, positive bias on earnings.
With stock at 38.00 the data suggests these ranges:
Based on current IV (expected move into Friday per TOS): 34.33 to 41.67
Based on AVERAGE move over last 12 quarters: 35.64 to 40.36
Based on MAXIMUM move over last 12 Q’s (19.8%): 30.49 to 45.51
Open to requests for other symbols.
#Earnings $BBY reports tomorrow morning. Below are details on earnings one-day moves over the last 12 quarters.
Feb. 27, 2019 BO +14.11%
Nov. 20, 2018 BO +2.13%
Aug. 28, 2018 BO -5.00%
May 24, 2018 BO -6.64%
March 1, 2018 BO +3.94%
Nov. 16, 2017 BO -3.57%
Aug. 29, 2017 BO -11.92% Biggest DOWN
May 25, 2017 BO +21.47% Biggest UP
March 1, 2017 BO -4.50%
Nov. 17, 2016 BO +13.69%
Aug. 23, 2016 BO +19.60%
May 24, 2016 BO -7.42%
Avg (+ or -) 9.50%
Bias 2.99%, positive bias on earnings.
With stock at 69.50 the data suggests these ranges:
Based on current IV (expected move into Friday per TOS): 64.17 to 74.83
Based on AVERAGE move over last 12 quarters: 62.90 to 76.10
Based on MAXIMUM move over last 12 Q’s (21.5%): 54.58 to 84.42
Based on DOWN Max only (-11.9%): 61.22
Open to requests for other symbols.
#SPX1dte Sold to Open $SPX May 22nd 2805/2825-2895/2915 condors for .95
Also, sold a wider condor, legging in…
Yesterday, sold May 31st 2725/2700 put spreads for 2.10
Today, sold May 31st 2920/2945 call spreads for 3.00
#Earnings Bought to Open $LOW May24/May31 110 #DoubleCalendar for .50.
#Earnings $LOW reports tomorrow morning. Below are details on earnings one-day moves over the last 12 quarters.
Feb. 27, 2019 BO +2.46%
Nov. 20, 2018 BO -5.65%
Aug. 22, 2018 BO +5.79%
May 23, 2018 BO +10.42% Biggest UP
Feb. 28, 2018 BO -6.47% Biggest DOWN
Nov. 21, 2017 BO -1.06%
Aug. 23, 2017 BO -3.70%
May 24, 2017 BO -3.02%
March 1, 2017 BO +9.51%
Nov. 16, 2016 BO -2.93%
Aug. 17, 2016 BO -5.64%
May 18, 2016 BO +3.32%
Avg (+ or -) 5.00%
Bias 0.25%, no significant bias on earnings.
With stock at 109.00 the data suggests these ranges:
Based on current IV (expected move into Friday per TOS): 103.05 to 114.95
Based on AVERAGE move over last 12 quarters: 103.55 to 114.45
Based on MAXIMUM move over last 12 Q’s (10.4%): 97.64 to 120.36
Based on DOWN Max only (-6.5%): 101.95
Open to requests for other symbols.
This is the first time I remember seeing this, but the expected move is LESS than the 12-quarter historical move MAXIMUMS. $HD has moved very little on recent earnings, but current IV projects it to move more than it has since Nov 2015.
#Earnings $HD reports tomorrow morning. Below are details on earnings one-day moves over the last 12 quarters.
Feb. 26, 2019 BO -0.88%
Nov. 13, 2018 BO -0.23%
Aug. 14, 2018 BO -0.53%
May 15, 2018 BO -1.62%
Feb. 20, 2018 BO -0.13%
Nov. 14, 2017 BO +1.63% Biggest UP
Aug. 15, 2017 BO -2.65% Biggest DOWN
May 16, 2017 BO +0.59%
Feb. 21, 2017 BO +1.41%
Nov. 15, 2016 BO -2.56%
Aug. 16, 2016 BO -0.60%
May 17, 2016 BO -2.46%
Avg (+ or -) 1.27%
Bias -0.67%, negative bias on earnings.
With stock at 192.00 the data suggests these ranges:
Based on current IV (expected move into Friday per TOS): 185.43 to 198.57
Based on AVERAGE move over last 12 quarters: 189.55 to 194.45
Based on MAXIMUM move over last 12 Q’s (2.7%): 186.91 to 197.09
Based on UP Max only (+1.6%): 195.13
Open to requests for other symbols.
#SPX1dte Tagged my stop level on the opening dip so I’m out with small loss.
BTC $SPX May 20th 2815/2795 put spreads for 1.05. Condors sold for .85 on Friday.
Also, stopped May 31st 2840/2815 put spreads for 8.70. #CondorRoll sold for 6.65 on Thursday.
#Earnings $AZO reports tomorrow morning. Below are details on earnings one-day moves over the last 12 quarters.
Feb. 26, 2019 BO +5.10%
Dec. 4, 2018 BO +6.74% Biggest UP
Sept. 18, 2018 BO -1.97%
May 22, 2018 BO -9.48%
Feb. 27, 2018 BO -11.06%
Dec. 5, 2017 BO +0.42%
Sept. 19, 2017 BO -5.00%
May 23, 2017 BO -11.84% Biggest DOWN
Feb. 28, 2017 BO -0.58%
Dec. 6, 2016 BO +0.43%
Sept. 22, 2016 BO -0.42%
May 24, 2016 BO +2.47%
Avg (+ or -) 4.63%
Bias -2.10%, negative bias on earnings.
With stock at 985.00 the data suggests these ranges:
Based on current IV (expected move into Friday per TOS): 925.51 to 1,044.49
Based on AVERAGE move over last 12 quarters: 939.44 to 1,030.56
Based on MAXIMUM move over last 12 Q’s (11.8%): 868.38 to 1,101.62
Based on UP Max only (+6.7%): 1,051.39
Open to requests for other symbols.
#Earnings So the trade headline killed my trade… as usual, legging out is a very bad idea for me. Some accounts now have a loss in this trade, while others will breakeven.
Sold $NVDA long 155 calls for 1.48.
“Sources” say trade talks have stalled. Is this really news? How can anyone suddenly be surprised and start selling? Answer: no one can… the computers do it.
#SPX1dte Sold $SPX May 20th 2795/2815-2910/2925 condors for .85. (IV: 10.04%, SPX 2873)
Expiring: May 17th 2810/2830-2910/2930 condors, sold yesterday for 1.30.
#Earnings On this minor dip I bought to close all of the short 160 calls for .46. Now I will wait for a drift higher to sell the long 155 calls, and get a few cents for the 162.5 calls as well.
Meanwhile, $DE trade was a miss, but a super cheap one. And I have 160 calls as a lottery ticket for next week.
FOMC minutes on Wednesday

Link to calendar: https://us.econoday.com/byweek.asp?day=20&month=5&year=2019&cust=us&lid=0
#Earnings Closed first few $NVDA 155/160/162.5 call #BrokenWingButterfly lots for 3.00. Bought yesterday for 1.49.
Since we are hovering around the center strike I will wait to try for higher prices on the remainder.
#SPX1dte Sold to Open $SPX March 17th 2810/2830/2910/2930 condors for 1.30. (IV 13.71%, SPX 2879).
#SPX1dte Stopped out $SPX March 16th 2895/2905 call spreads for 3.05. Condors sold yesterday for 1.20.
Another #CondorRoll, same strikes as I sold earlier for May 31st, but this time a week earlier:
Sold $SPX 2815/2840-2960/2985 condors for 4.55.
#SPX1dte The biggest up days in history are all during times of market volatility. On a percentage basis, the Fall of 2008 contains five of the top 10 biggest moves UP; a period in which the market was only starting its fall to lose over half its value.
So it is fitting a call spread I could have closed at yesterday’s open for about .45 I now had to stop out for 8.00. Today’s action has provided no pullback opportunities, although I imagine there’ll be one now that I was finally forced out.
BTC $SPX May 17th 2890/2915 call spreads for 8.00. Sold for 2.10 on Monday.
#CondorRoll Sold $SPX May 31st 2815/2840/2960/2985 condors for 6.65
I’m also going to take a loss on today’s monthly condor call side. I cannot risk overnight gap risk on the 2895 short calls.
#Earnings I was looking at a #DoubleCalendar, ATM going for about 1.50, but didn’t want the risk as I think a bigger than average move may be possible. Market is crazy bullish at the moment, entirely Trade-War driven. So I looked at an OTM call calendar at 160. The front calls don’t even have a bid, so, I just went with the “buy” half of the Calendar…
Bought to open $DE May 24th 160 calls for .18.
Looking at the daily chart, DE was close to 170 just a couple weeks ago. Unless the report is bad, I believe it has a good shot at a large move tomorrow, or even a further drift upward into next week, when these expire. It is a much better risk/reward play in an uncertain market. Needs any move up to be profitable, and about a 9% move up to be ATM.
#Earnings Bought to Open $NVDA May 17th 155/160/162.5 #BrokenWingButterfly for 1.49. Bullish trade with no upside risk.
#Earnings $DE reports tomorrow morning. Below are details on earnings one-day moves over the last 12 quarters.
Feb. 15, 2019 BO -2.11%
Nov. 21, 2018 BO +2.42%
Aug. 17, 2018 BO +2.35%
May 18, 2018 BO +5.74%
Feb. 16, 2018 BO +1.57%
Nov. 22, 2017 BO +4.32%
Aug. 18, 2017 BO -5.37%
May 19, 2017 BO +7.30%
Feb. 17, 2017 BO +1.00%
Nov. 23, 2016 BO +11.04%
Aug. 19, 2016 BO +13.49% Biggest UP
May 20, 2016 BO -5.48% Biggest DOWN
Avg (+ or -) 5.18%
Bias 3.02%, strongly positive bias on earnings.
With stock at 146.00 the data suggests these ranges:
Based on current IV (expected move into Friday per TOS): 140.45 to 151.55
Based on AVERAGE move over last 12 quarters: 138.43 to 153.57
Based on MAXIMUM move over last 12 Q’s (13.5%): 126.30 to 165.70
Based on DOWN Max only (-5.5%): 138.00
Open to requests for other symbols.
#Earnings $NVDA reports tonight. Below are details on earnings one-day moves over the last 12 quarters.
Feb. 14, 2019 AC +1.81%
Nov. 15, 2018 AC -18.75% Biggest DOWN
Aug. 16, 2018 AC -4.90%
May 10, 2018 AC -2.15%
Feb. 8, 2018 AC +6.69%
Nov. 9, 2017 AC +5.26%
Aug. 10, 2017 AC -5.32%
May 9, 2017 AC +17.82%
Feb. 9, 2017 AC -2.37%
Nov. 10, 2016 AC +29.80% Biggest UP
Aug. 11, 2016 AC +5.59%
May 12, 2016 AC +15.20%
Avg (+ or -) 9.64%
Bias 4.06%, strongly positive bias on earnings.
With stock at 159.00 the data suggests these ranges:
Based on current IV (expected move into Friday per TOS): 147.20 to 170.80
Based on AVERAGE move over last 12 quarters: 143.68 to 174.32
Based on MAXIMUM move over last 12 Q’s (29.8%): 111.62 to 206.38
Based on DOWN Max only (-18.8%): 129.19
Open to requests for other symbols.
#Earnings $BIDU reports tonight. Below are details on earnings one-day moves over the last 12 quarters.
Feb. 21, 2019 AC -2.70%
Oct. 30, 2018 AC +3.64%
July 31, 2018 AC -7.73%
April 26, 2018 AC +5.54%
Feb. 13, 2018 AC +4.56%
Oct. 26, 2017 AC -8.15% Biggest DOWN
July 27, 2017 AC +9.45% Biggest UP
April 27, 2017 AC -4.06%
Feb. 23, 2017 AC -5.12%
Oct. 27, 2016 AC +2.56%
July 28, 2016 AC -3.64%
April 28, 2016 AC +4.45%
Avg (+ or -) 5.13%
Bias -0.10%, no significant bias on earnings.
With stock at 152.50 the data suggests these ranges:
Based on current IV (expected move into Friday per TOS): 145.46 to 159.54
Based on AVERAGE move over last 12 quarters: 144.67 to 160.33
Based on MAXIMUM move over last 12 Q’s (9.5%): 138.09 to 166.91
Based on DOWN Max only (-8.2%): 140.07
Open to requests for other symbols.
#SPX1dte Sold $SPX May 16th (monthlys) 2775/2795/2895/2915 condors for 1.20. (IV 16.47%, SPX 2856)
These stop trading tomorrow at the close but will settle with Friday morning’s opening.
Expiring, May 15th 2770/2790/2885/2905 condors, sold yesterday for 1.15
Stocks, automakers jump as Trump plans to delay auto tariffs by 6 months https://t.co/ngxxAzqHKz pic.twitter.com/lrDdQkIO1r
— CNBC Now (@CNBCnow) May 15, 2019
#Earnings $NTES reports tonight. Below are details on earnings one-day moves over the last 12 quarters.
Feb. 20, 2019 AC -5.88%
Nov. 14, 2018 AC +5.31%
Aug. 8, 2018 AC -10.96% Biggest DOWN
May 16, 2018 AC -7.45%
Feb. 7, 2018 AC -6.27%
Nov. 15, 2017 AC +7.85%
Aug. 9, 2017 AC -9.77%
May 10, 2017 AC -0.82%
Feb. 15, 2017 AC +14.08% Biggest UP
Nov. 9, 2016 AC -9.22%
Aug. 17, 2016 AC -2.67%
May 11, 2016 AC +0.43%
Avg (+ or -) 6.73%
Bias -2.11%, negative bias on earnings.
With stock at 262.50 the data suggests these ranges:
Based on current IV (expected move into Friday per TOS): 245.55 to 279.45
Based on AVERAGE move over last 12 quarters: 244.84 to 280.16
Based on MAXIMUM move over last 12 Q’s (14.1%): 225.54 to 299.46
Based on DOWN Max only (-11.0%): 233.73
Open to requests for other symbols.
#SPX1dte Sold to Open $SPX May 15th 2770/2790-2885/2905 condors for 1.15 (IV: 15.16%, SPX 2850)
#Earnings $M reports tomorrow morning. Below are details on earnings one-day moves over the last 12 quarters.
Feb. 26, 2019 BO +1.47%
Nov. 14, 2018 BO -7.18%
Aug. 15, 2018 BO -15.94%
May 16, 2018 BO +10.82%
Feb. 27, 2018 BO +3.46%
Nov. 9, 2017 BO +10.98%
Aug. 10, 2017 BO -10.24%
May 11, 2017 BO -17.00% Biggest DOWN
Feb. 21, 2017 BO -0.03%
Nov. 10, 2016 BO +5.60%
Aug. 11, 2016 BO +17.08% Biggest UP
May 11, 2016 BO -15.16%
Avg (+ or -) 9.58%
Bias -1.35%, negative bias on earnings.
With stock at 21.75 the data suggests these ranges:
Based on current IV (expected move into Friday per TOS): 19.68 to 23.82
Based on AVERAGE move over last 12 quarters: 19.67 to 23.83
Based on MAXIMUM move over last 12 Q’s (17.1%): 18.04 to 25.46
Open to requests for other symbols.
#Earnings Looks like I picked the wrong week for a #RevengeTrade.
After losing on an earnings condor I sold the $GOOGL ITM May 17th 1220/1120 put spread for 7.75 on May 3rd. I managed to get out for 8.55 by legging out, which I can assure you is not a relaxing endeavor with options that cost 80.00. I will look to take advantage of the next bull run, but not gonna mess with it now.
#Earnings $BABA reports tomorrow morning. Below are details on earnings one-day moves over the last 12 quarters.
Jan. 30, 2019 BO +6.33% Biggest UP
Nov. 2, 2018 BO -2.41%
Aug. 23, 2018 BO -3.15%
May 4, 2018 BO +3.52%
Feb. 1, 2018 BO -5.90% Biggest DOWN
Nov. 2, 2017 BO -0.68%
Aug. 17, 2017 BO +2.77%
May 18, 2017 BO +0.45%
Jan. 24, 2017 BO +3.06%
Nov. 2, 2016 BO -2.60%
Aug. 11, 2016 BO +5.08%
May 5, 2016 BO +3.96%
Avg (+ or -) 3.33%
Bias 0.87%, positive bias on earnings.
With stock at 172.50 the data suggests these ranges:
Based on current IV (expected move into Friday per TOS): 163.16 to 181.84
Based on AVERAGE move over last 12 quarters: 166.76 to 178.24
Based on MAXIMUM move over last 12 Q’s (6.3%): 161.58 to 183.42
Based on DOWN Max only (-5.9%): 162.32
Open to requests for other symbols.
#SPX1-dte As another short term trade, replacing call spreads closed Friday,
Sold $SPX March 17th (weeklys) 2890/2915 call spreads for 2.95.
Also, closed today’s 2790/2770 put spreads for .30. Hovering between 1.00 and 4.00 all day, finally got out. I had to close the call spread at Friday’s close, unfortunately; it would not have been a concern today!
#VXXGame Bought more $VXX Jan 2020 20 puts for 1.40. Adding to first batch I bought for 1.75 on Jan 22nd.
The 2021 puts are still too expensive, but I’m watching.
#SPX1dte After selling the condor, SPX moved up from 2868 to top out at 2891, which was within the expected move for Monday. So I had to stop out of the call side for 1.40.
I may sell a same day condor on Monday if the open in quiet, but otherwise this one’s s small loss.
#SyntheticCoveredCalls Earlier: BTC $TQQQ May 17th 68.5 calls for .12. Sold for 1.26 on Monday.
Now: Sold TQQQ May 31st 65 calls for 1.25
