
Expiring $TSLA 7/19/2019 275/265//190/200 IC. Legged into this on 6/18. Put side was sold @1.7, the calls @1.32.
BTC $LULU 8/16/2019 165/175 #Bups @.67. was STO 7/9 @1.40.
Expiring $TSLA 7/19/2019 275/265//190/200 IC. Legged into this on 6/18. Put side was sold @1.7, the calls @1.32.
BTC $LULU 8/16/2019 165/175 #Bups @.67. was STO 7/9 @1.40.
#Earnings Never got another rally so out on the rest for small loss, 4.10.
#SPX1dte Sold $SPX July 22nd 2920/2940-3010/3030 for .85, IV 7.53%, SPX 2984
Expiring today: July 19th 2940/2960-3015/3035 condors, sold yesterday for .85
#CoveredCalls – Not sure where this Iran thing is headed so selling ITM for a little extra downside help.
Bought to Close TNA JUL 19 2019 61.5 Call @ .01 (sold for 2.10)
Sold TNA AUG 02 2019 60.0 Call @ 2.52
Bought to close Aug. 16, 55/62.50 strangle for .91, sold, sold for 1.33 on July 10.
#shortputs
$HIIQ BTC 7/19 28 put and STO 8/16 27 put for added .33 credit.
$HIIQ BTC 7/19 26 put and STO 8/16 25 put for added .70 credit. Stock at 22.84
#coveredcalls
$BYND BTC 7/19 175 call and STO 7/26 177.50 call for 1.80 added credit. Stock at 177.52
#Earnings $HAL reports Monday morning. Below are details on earnings one-day moves over the last 12 quarters.
April 22, 2019 BO -0.12%
Jan. 22, 2019 BO -3.06%
Oct. 22, 2018 BO -3.03%
July 23, 2018 BO -8.09% Biggest DOWN
April 23, 2018 BO +0.17%
Jan. 22, 2018 BO +6.39% Biggest UP
Oct. 23, 2017 BO -2.51%
July 24, 2017 BO -4.21%
April 24, 2017 BO -0.65%
Jan. 23, 2017 BO -2.92%
Oct. 19, 2016 BO +4.24%
July 20, 2016 BO -1.57%
Avg (+ or -) 3.08%
Bias -1.28%, negative bias on earnings.
With stock at 21.75 the data suggests these ranges:
Based on current IV (expected move into NEXT Friday per TOS): 20.58 to 22.92
Based on AVERAGE one-day move over last 12 quarters: 21.08 to 22.42
Based on MAXIMUM on-day move over last 12 Q’s (8.1%): 19.99 to 23.51
Based on UP Max only (+6.4%): 23.14
Open to requests for other symbols.
BTC $FB 7/26/2019 180/190 #BUPS @1.65. Was STO 7/11 @1.49. Earnings 7/24 after. Taking a small loss and taking some risk off.
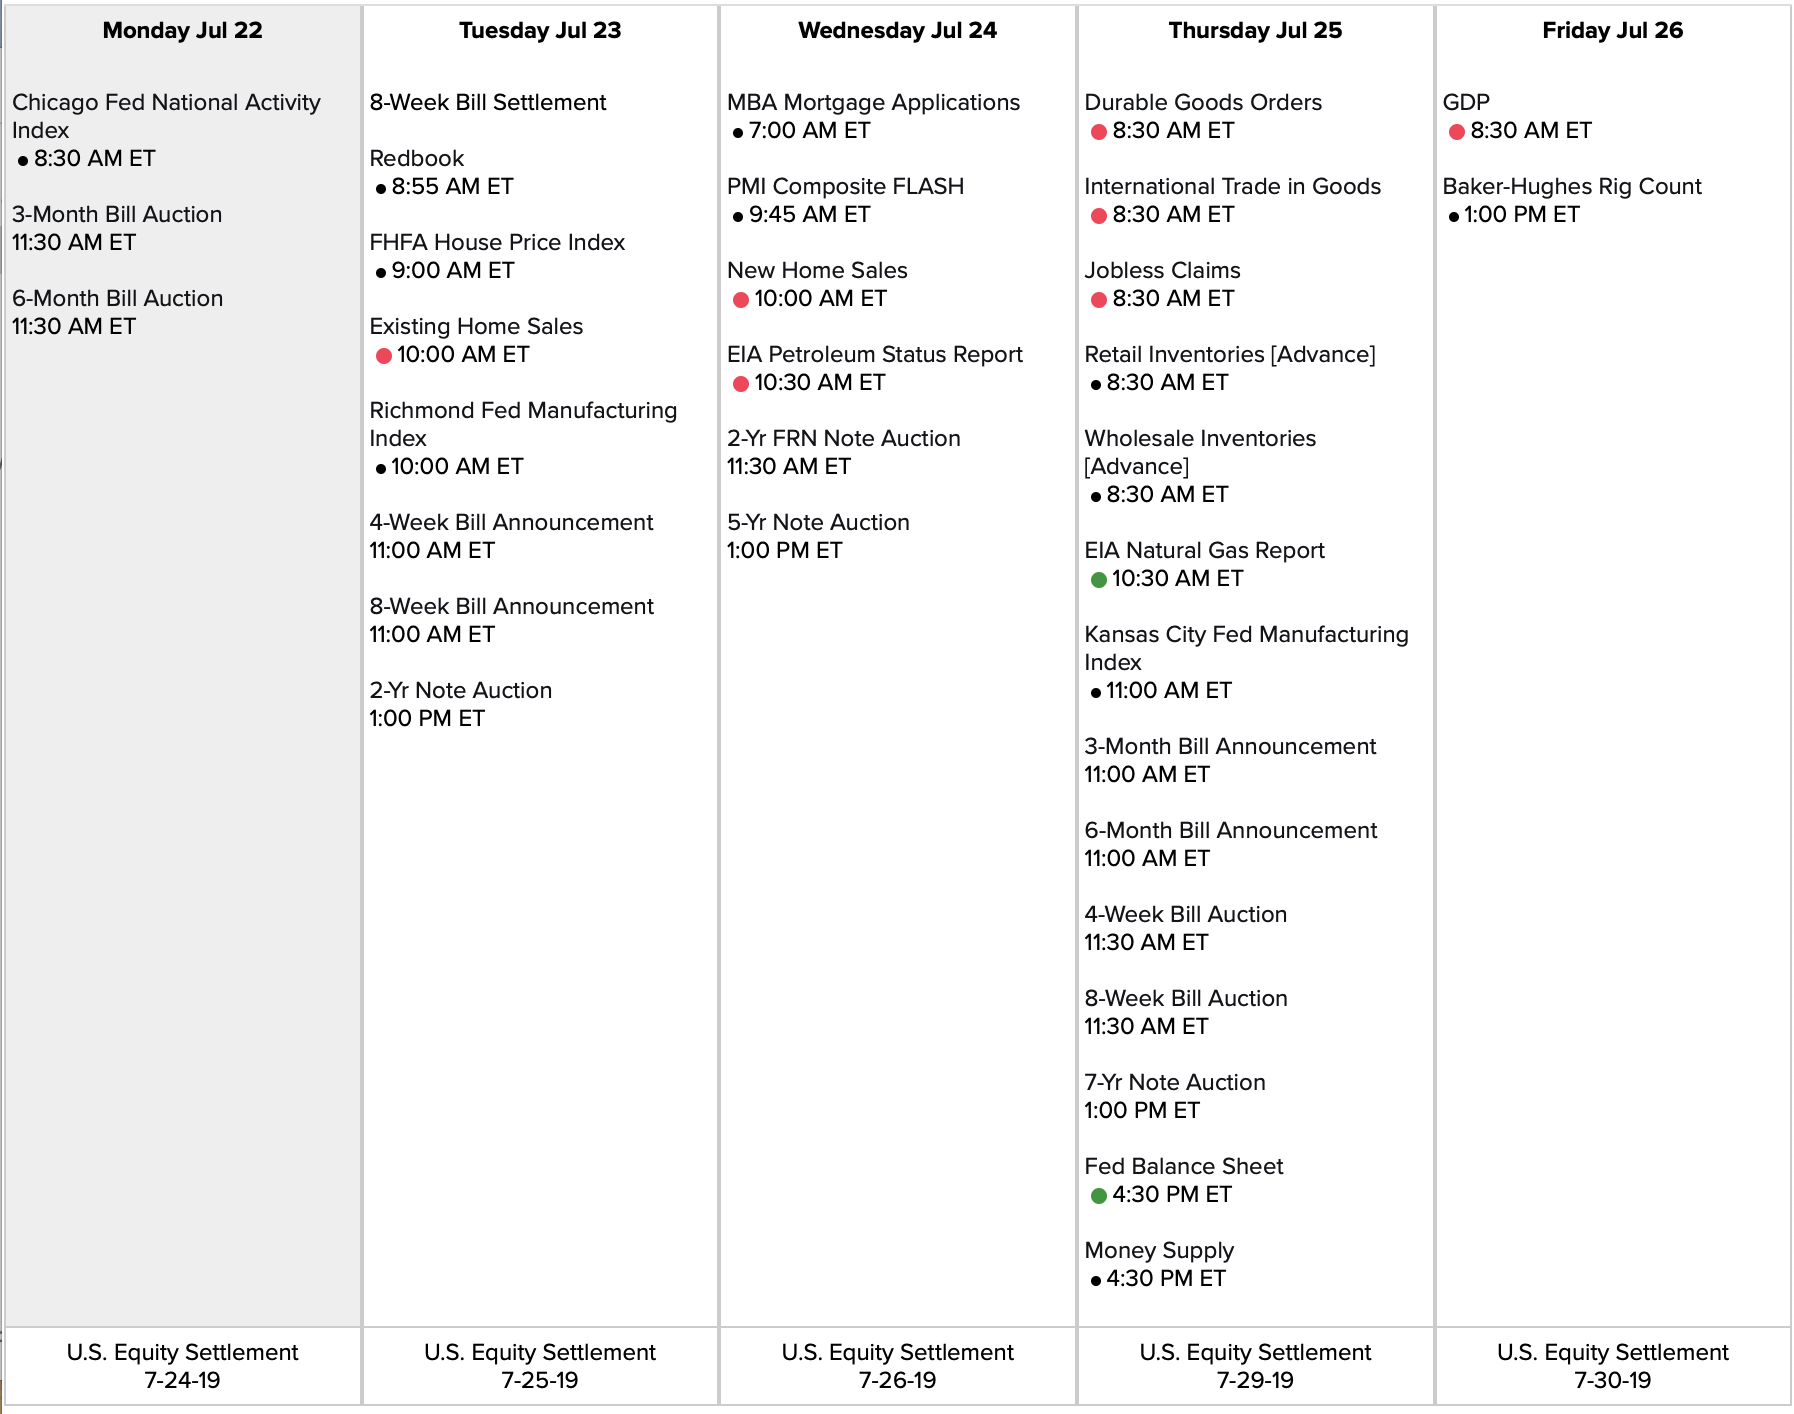

Link to calendar: https://us.econoday.com/byweek.asp?day=22&month=7&year=2019&cust=us&lid=0
#JadeLizards – I’m really liking these Lizards. Safer than playing the typical tastytrade strangles. Seems like I always used to get in trouble to the upside so this eliminates that risk while still bringing in nice premium. Just have to make sure you can take the stock or roll the short put if needed.
Trying another one that’s not an #Earnings play. Put is below nice support below the 200, 100, and 50 day moving averages and outside the expected move.
Sold ISRG AUG 16 2019 500.0/535.0/540.0 Jade Lizard @ 5.93
Jeff do you have data for HAL? TDA has earnings Monday AM. It looks like HAL is around a 10 year low.
Thanks
Bought Aug. 16 125/145 strangle for .77, sold yesterday for 1.40
#ContangoETFs I don’t want to get caught deeply OTM that really hammered me in 2016 with NUGT’s 100-point run higher. So I’m rolling strikes that get breached. For today, closed them on the pullback and will consider how to roll in coming days.
BTC $NUGT Sep 20th 35 calls for 5.00. Sold for 2.06 on Jan 31st.
BTC $NUGT Dec 20th 35 calls for 7.35. Sold for 2.95 on June 20th.
#ShortPuts – Looking weak so taking profits. I’ll keep it on the list for an earnings play later….
Bought to Close ILMN JUL 26 2019 280.0 Put @ .90 (sold for 2.60)
#Earnings Sold to close first $SKX July 19th 35 long calls for 4.80 and 5.20. #LongStrangles bought yesterday for 4.38.
Sold more $CSX stock for 72.30. Cost basis 71.34.
#Earnings #JadeLizards – Nothing goes down anymore but still worked out ok. A small gain on SKX and decent gain on ISRG thanks to legging in even though I had to chase it to get out.
Bought to Close SKX JUL 19 2019 31.0/35.0/36.0 Jade Lizards @ .98 (sold for 1.20)
Bought to Close ISRG JUL 19 2019 505.0/530.0/540.0 Jade Lizard @ 6.14 (sold for 10.25)
#bullputspreads
$ADBE BTC 7/26 280/290 BUPS for .15. STO at 1.46. Thank you @lesserweavil
#spxcampaign
$SPX BTC 7/19 2935/2960 BUPS at .30. STO at 5.50. Thank you @jeffcp66
Sold 125/145 strangle for 1.40. Have sold essentially the same 20 point wide strangle the last 2 earnings.
#Earnings #Assignment Sold some of my CSX stock at 71.50. That amounts to a .16 profit on a losing trade. Will hold the rest for further recovery.
BTC $SPX 2955/2965 #BuPS 7/19/2019 AM @.10. Was STO just before close yesterday @1.0.
Almost makes me even for the day against the $NFLX loss noted earlier. (I’m sure my broker isn’t complaining about the commissions they’ve banked)
#BearCallSpreads – Joining the NUGT fun on the bigly rally. Using spreads out to 2020. Starter position with room to add.
Sold NUGT JAN 17 2020 45.0/50.0 Bear Call Spreads @ .98
#SPX1dte Sold to open $SPX Jul 19th 2940/2960-3015/3035 condors for .85.
The short put is the same one I just closed earlier, on the longer term spread. Oh, well.
#Earnings – Wow. Should’ve just skipped the call side of the lizard and closed the short put prior to earnings. Got some downside room now…LOL Somebody leak some info already?
#SPX1dte Bought to close $SPX July 19th 2960/2935 put spreads for .40. Sold for 5.50 on July 8th.
This sucker was up near 3.00 this morning. Got no reason to push my luck for one more day.
#Earnings #JadeLizards – Playing this slightly to the downside with breakeven below the 50ma and just above the 200ma and slightly outside the expected move. No upside risk if it does breakout higher…
Sold SKX JUL 19 2019 31.0/35.0/36.0 Jade Lizards @ 1.20
#Earnings Sold to Close $HON Jul19/Jul26 172.5 #DoubleCalendar for 1.38. Bought yesterday for .67.
Bought to close 8/9 265 puts @ 1.60. Sold for 3.90 on 7/3.
Thanks again Fuzzy!
Rolled 1 penny July 16 57.50 covered calls to August. 16, 55 calls for 1.83 each, assigned WDC some time ago.
#Earnings Bought to Open $SKX July 19th 34.5/35 #LongStrangles for 4.38.
From current price at 34.75, I need a 13.6% move. Avg move on earnings has been 16.5%.
#ContangoETFs Keeps notching new highs. No strikes breached yet but it could get ugly before it gets better.
Sold $NUGT Jan 2020 55 calls for 3.20. Highest available strike.
OSTK STO 7/19/19 20.0 CALLS @.40 If necessary will cover w/stock. Expires tomorrow.
OSTK STO 7/26/19 21.5 CALLS @48 ” ” “
#Earnings $SKX reports tonight. Below are details on earnings one-day moves over the last 12 quarters.
April 18, 2019 BO -10.43%
Feb. 7, 2019 AC +15.19%
Oct. 18, 2018 AC +13.78%
July 19, 2018 AC -20.99%
April 19, 2018 AC -27.04% Biggest DOWN
Feb. 8, 2018 AC +7.54%
Oct. 19, 2017 AC +41.44% Biggest UP
July 20, 2017 AC +0.67%
April 20, 2017 AC -2.56%
Feb. 9, 2017 AC +19.32%
Oct. 20, 2016 AC -17.26%
July 21, 2016 AC -22.34%
Avg (+ or -) 16.55%
Bias -0.22%, no significant directional bias on earnings, just a big-move bias.
With stock at 34.35 the data suggests these ranges:
Based on current IV (expected move into Friday per TOS): 30.07 to 38.63
Based on AVERAGE move over last 12 quarters: 28.67 to 40.03
Based on MAXIMUM move over last 12 Q’s (41.4%): 20.12 to 48.58
Based on DOWN Max only (-27.0%): 25.06
Open to requests for other symbols.
#BullPutSpreads – @fibwizard – Do you use stops on those 100 point wide spreads? Following along (paper trade) with you on the Aug 2915/2815…
#Earnings – Careful with this one. I show earnings confirmed for Aug 7th. Not tonight…
Sold $NFLX Aug 310/300 BuPS @ 2.60
#Earnings Sold to close $HON Jul19/Jul26 172.5 #DoubleCalendar for 1.65. Bought yesterday for .67.
Filled on most of my order. Still a few out there but should fill when price meanders back toward my strike.
#Earnings $MSFT reports tonight. Below are details on earnings one-day moves over the last 12 quarters.
April 24, 2019 AC +3.31%
Jan. 30, 2019 AC -1.83% Biggest DOWN
Oct. 24, 2018 AC +5.84%
July 19, 2018 AC +1.79%
April 26, 2018 AC +1.65%
Jan. 31, 2018 AC -0.78%
Oct. 26, 2017 AC +6.41% Biggest UP
July 20, 2017 AC -0.57%
April 27, 2017 AC +0.27%
Jan. 26, 2017 AC +2.34%
Oct. 20, 2016 AC +4.20%
July 19, 2016 AC +5.31%
Avg (+ or -) 2.86%
Bias 2.33%, strong positive bias on earnings.
With stock at 136.00 the data suggests these ranges:
Based on current IV (expected move into Friday per TOS): 131.13 to 140.87
Based on AVERAGE move over last 12 quarters: 132.11 to 139.89
Based on MAXIMUM move over last 12 Q’s (6.4%): 127.28 to 144.72
Based on DOWN Max only (-1.8%): 133.51
Open to requests for other symbols.
#ShortPuts – Down after earnings so selling at recent lows. Starter position giving it room out to Sep.
Sold URI SEP 20 2019 110.0 Put @ 2.55
Roll $NFLX 7/19/2019 330/340 #bups for 330/340 8/16/2019 @-1.00. Ouch but not as much ouch as letting this expire ITM.
Short ES at 2990…at 2:50pm CST
Exit at 2977..at 7:30pm….
Profit of +13 points on the ES
#SPX1dte Expiring: $SPX 2965/2975-3025/3035 condors, double-sized position sold yesterday for .45.
I skipped monthly expiration 1-dte due to low premium, the volatility spike, and Friday morning settlement.
\Sold August 16, 295/315/420/440 for 3.09, beyond the 1 day max moves. Thanks Jeff
BTO August 2, 60/70 bull call spread @ 6.98
Aug. 16 expirations
GS yesterday closed GS iron condor for $40 gain
JPM closed strangle for gain of $27
UAL closed strangle for gain of $40
DAL-not cooperating, short call of the strangle is in the money.
Not much premium even in August.
#Earnings Bought $HON Jul19/Jul26 172.5 #DoubleCalendar for .67.
$HON reports tomorrow morning. Below are details on earnings one-day moves over the last 12 quarters.
April 18, 2019 BO +3.78% Biggest UP
Feb. 1, 2019 BO +0.75%
Oct. 19, 2018 BO -1.10%
July 20, 2018 BO +3.78%
April 20, 2018 BO +1.64%
Jan. 26, 2018 BO +1.94%
Oct. 20, 2017 BO +1.20%
July 21, 2017 BO +1.03%
April 21, 2017 BO +2.67%
Jan. 27, 2017 BO +0.38%
Oct. 21, 2016 BO +0.75%
July 22, 2016 BO -2.57% Biggest DOWN
Avg (+ or -) 1.80%
Bias 1.19%, positive bias on earnings.
With stock at 172.50 the data suggests these ranges:
Based on current IV (expected move into Friday per TOS): 166.66 to 178.34
Based on AVERAGE move over last 12 quarters: 169.40 to 175.60
Based on MAXIMUM move over last 12 Q’s (3.8%): 165.98 to 179.02
Based on DOWN Max only (-2.6%): 168.07
Open to requests for other symbols.
#Earnings $NFLX reports tonight. Below are details on earnings one-day moves over the last 12 quarters.
April 16, 2019 AC -1.31%
Jan. 17, 2019 AC -3.98%
Oct. 16, 2018 AC +5.28%
July 16, 2018 AC -5.24%
April 16, 2018 AC +9.18%
Jan. 22, 2018 AC +9.97%
Oct. 16, 2017 AC -1.57%
July 17, 2017 AC +13.54%
April 17, 2017 AC -2.64%
Jan. 18, 2017 AC +3.86%
Oct. 17, 2016 AC +19.02% Biggest UP
July 18, 2016 AC -13.12% Biggest DOWN
Avg (+ or -) 7.39%
Bias 2.75%, positive bias on earnings.
With stock at 365.50 the data suggests these ranges:
Based on current IV (expected move into Friday per TOS): 338.73 to 392.27
Based on AVERAGE move over last 12 quarters: 338.48 to 392.52
Based on MAXIMUM move over last 12 Q’s (19.0%): 295.98 to 435.02
Based on DOWN Max only (-13.1%): 317.55
Open to requests for other symbols.
#Earnings #JadeLizards – Legging into the Lizard on the bounce…
Sold ISRG JUL 19 2019 530.0/540.0 Bear Call Spread @ 3.55
Position is now Friday’s 505.0/530.0/540.0 Jade Lizard @ 10.25
No upside risk and downside breakeven is 10 dollars below the 50ma and 5 dollars outside the expected move…but…could go anywhere. Earnings after the close tomorrow.
#SPX1dte Sold $SPX July 24 2920/2945-3040/3065 condors for 2.85.
#SPX1dte STC $SPX July 19th 3025/3040 long call spreads for 1.30. Bought for 1.80 on the 9th. Small loss, but fortunately all the short spreads are killing it.
#bearcallspreads
$SRPT BTC 7/19 165/175 BECS at .40. STO at 1.45. Put the trade on when stock jumped way up as result of drug trial.
#SPX1dte Premium is low so I went 10-wide, double size:
Sold $SPX 2965/2975-3025/3035 condors for .45, IV 7.57%, SPX 3005
#SPX1dte BTC $SPX July 18th (monthlies) 2935/2960-3040/3065 condors for .90. Sold yesterday for 2.45.
#Earnings Bought $CSX Jul19/Jul26 79.5 #DoubleCalendar for .33 and .34.
$CSX reports tonight. Below are details on earnings one-day moves over the last 12 quarters.
April 16, 2019 AC +4.01%
Jan. 16, 2019 AC -0.44%
Oct. 16, 2018 AC -2.06%
July 17, 2018 AC +7.07%
April 17, 2018 AC +7.84% Biggest UP
Jan. 16, 2018 AC -0.75%
Oct. 17, 2017 BO +2.63%
July 18, 2017 AC -5.06% Biggest DOWN
April 19, 2017 AC +5.60%
Jan. 17, 2017 AC -3.17%
Oct. 12, 2016 AC +3.11%
July 13, 2016 AC +2.97%
Avg (+ or -) 3.73%
Bias 1.81%, positive bias on earnings.
With stock at 79.50 the data suggests these ranges:
Based on current IV (expected move into Friday per TOS): 76.63 to 82.37
Based on AVERAGE move over last 12 quarters: 76.54 to 82.46
Based on MAXIMUM move over last 12 Q’s (7.8%): 73.27 to 85.73
Based on DOWN Max only (-5.1%): 75.48
Open to requests for other symbols.
#Earnings – Normally don’t enter these until the day of earnings but taking a shot with today’s pullback. Might leg into a #JadeLizard on a bounce. Selling the put side down at the 50ma. Hasn’t been a whole lot to do last week or so. Just letting some earlier sales wind down.
Sold ISRG JUL 19 2019 505.0 Put @ 6.70
Sold Aug. 16, 85/105 for .93, thanks Jeff for the data.
Hey Ramie, our dreams of getting out of WDC aren’t looking so good today.
OSTK STO 7/19/19 18.0 CALLS @.85 Trying something new for me anyway, will wait for the stock to get close to 18.85 what I got, in premium, .85, before I cover. An experiment.
#Earnings $UAL reports tonight morning. Below are details on earnings one-day moves over the last 12 quarters.
April 16, 2019 AC +4.77%
Jan. 15, 2019 AC +6.35%
Oct. 16, 2018 AC +5.95%
July 17, 2018 AC +8.78% Biggest UP
April 17, 2018 AC +4.81%
Jan. 23, 2018 AC -11.44%
Oct. 18, 2017 AC -12.07% Biggest DOWN
July 18, 2017 AC -5.90%
April 17, 2017 AC -4.26%
Jan. 17, 2017 AC +0.35%
Oct. 17, 2016 BO -0.31%
July 19, 2016 BO +0.29%
Avg (+ or -) 5.44%
Bias -0.22%, no significant bias on earnings.
With stock at 93.00 the data suggests these ranges:
Based on current IV (expected move into Friday per TOS): 88.53 to 97.47
Based on AVERAGE move over last 12 quarters: 87.94 to 98.06
Based on MAXIMUM move over last 12 Q’s (12.1%): 81.77 to 104.23
Based on UP Max only (+8.8%): 101.17
Open to requests for other symbols.
#coveredcalls
$LABU STO 7/19 49 call at .75
#bucs
$TWLO STC 7/19 130/140 BUCS at 9.50. BTO at 5.20 on 6/5.
#shortputs
$DELL BTC 7/19 62.5 put at 7.80. STO on 6/13 for 9.40. Stock at 55.01. Not sure how I got out.
#bups
$AMZN STO 7/19 1980/1990 BUPS at 2.20. Will this be a Prime deal?
#SPX1dte Expiring today, $SPX July 15th 2960/2980/3030/3050, sold Friday for .85
Bought Aug. 21 +15/-18/-18/+21 for .44
#bups
$AMZN BTC 7/19 1800/1830 BUPS at .10. STO 6/25 for 6.35
$CRM BTC 7/19 145/155 BUPS at .40. STO 6/11 for 4.00
#coveredcalls
$TNDM STO 7/26 68 calls at 1.25. Earnings 7/29
#shortputs
$TNDM STO 7/26 64 puts at 2.60 Earnings still 7/29
$PLAY BTC 7/19 40 put at .40. STO 6/12 at 2.30
Sold August 16, 105/120 strangle for .90. Thanks for the data Jeff.
#futures
6/29 Long /ES at 2915…off the bounce at the 38.1% retracement..
7/15 Closed /ES long today when price hit 3020..which was the Day high then..
105 point gain in /ES for a two week trade….
STO qty 2 Aug 19 SPX BUPS 2815/2915 @ 16.42
Sold July 26th 2935/2915 BuPS @ 1.00
#SPX1dte Sold $SPX July 18th 2935/2960-3040/3065 condors for 2.45
#Earnings $JPM reports tomorrow morning. Below are details on earnings one-day moves over the last 12 quarters.
April 12, 2019 BO +4.68% Biggest UP
Jan. 15, 2019 BO +0.73%
Oct. 12, 2018 BO -1.09%
July 13, 2018 BO -0.45%
April 13, 2018 BO -2.70% Biggest DOWN
Jan. 12, 2018 BO +1.65%
Oct. 12, 2017 BO -0.28%
July 14, 2017 BO -0.91%
April 13, 2017 BO -1.17%
Jan. 13, 2017 BO +0.53%
Oct. 14, 2016 BO -0.32%
July 14, 2016 BO +1.51%
Avg (+ or -) 1.34%
Bias 0.18%, no significant bias on earnings.
NOTE: 5-day results are not significantly different
With stock at 114.00 the data suggests these ranges:
Based on current IV (expected move into Friday per TOS): 110.85 to 117.15
Based on AVERAGE move over last 12 quarters: 112.48 to 115.52
Based on MAXIMUM move over last 12 Q’s (4.7%): 108.66 to 119.34
Based on DOWN Max only (-2.7%): 110.92
Open to requests for other symbols.
STO $ADBE 8/16/2019 285/295 #BuPS @1.40.
#Earnings $GS reports tomorrow morning. Below are details on earnings one-day moves over the last 12 quarters.
April 15, 2019 BO -3.81%
Jan. 16, 2019 BO +9.54% Biggest UP
Oct. 16, 2018 BO +3.01%
July 17, 2018 BO -0.18%
April 17, 2018 BO -1.64%
Jan. 17, 2018 BO -1.86%
Oct. 17, 2017 BO -2.60%
July 18, 2017 BO -2.59%
April 18, 2017 BO -4.71% Biggest DOWN
Jan. 18, 2017 BO -0.61%
Oct. 18, 2016 BO +2.14%
July 19, 2016 BO -1.17%
Avg (+ or -) 2.82%
Bias -0.37%, tiny negative bias on earnings.
NOTE: 5-day results are more positive, with a MAX up move of +12%
With stock at 210.00 the data suggests these ranges:
Based on current IV (expected move into Friday per TOS): 202.02 to 217.98
Based on AVERAGE move over last 12 quarters: 204.07 to 215.93
Based on MAXIMUM move over last 12 Q’s (9.5%): 189.97 to 230.03
Based on DOWN Max only (-4.7%): 200.11
Open to requests for other symbols.
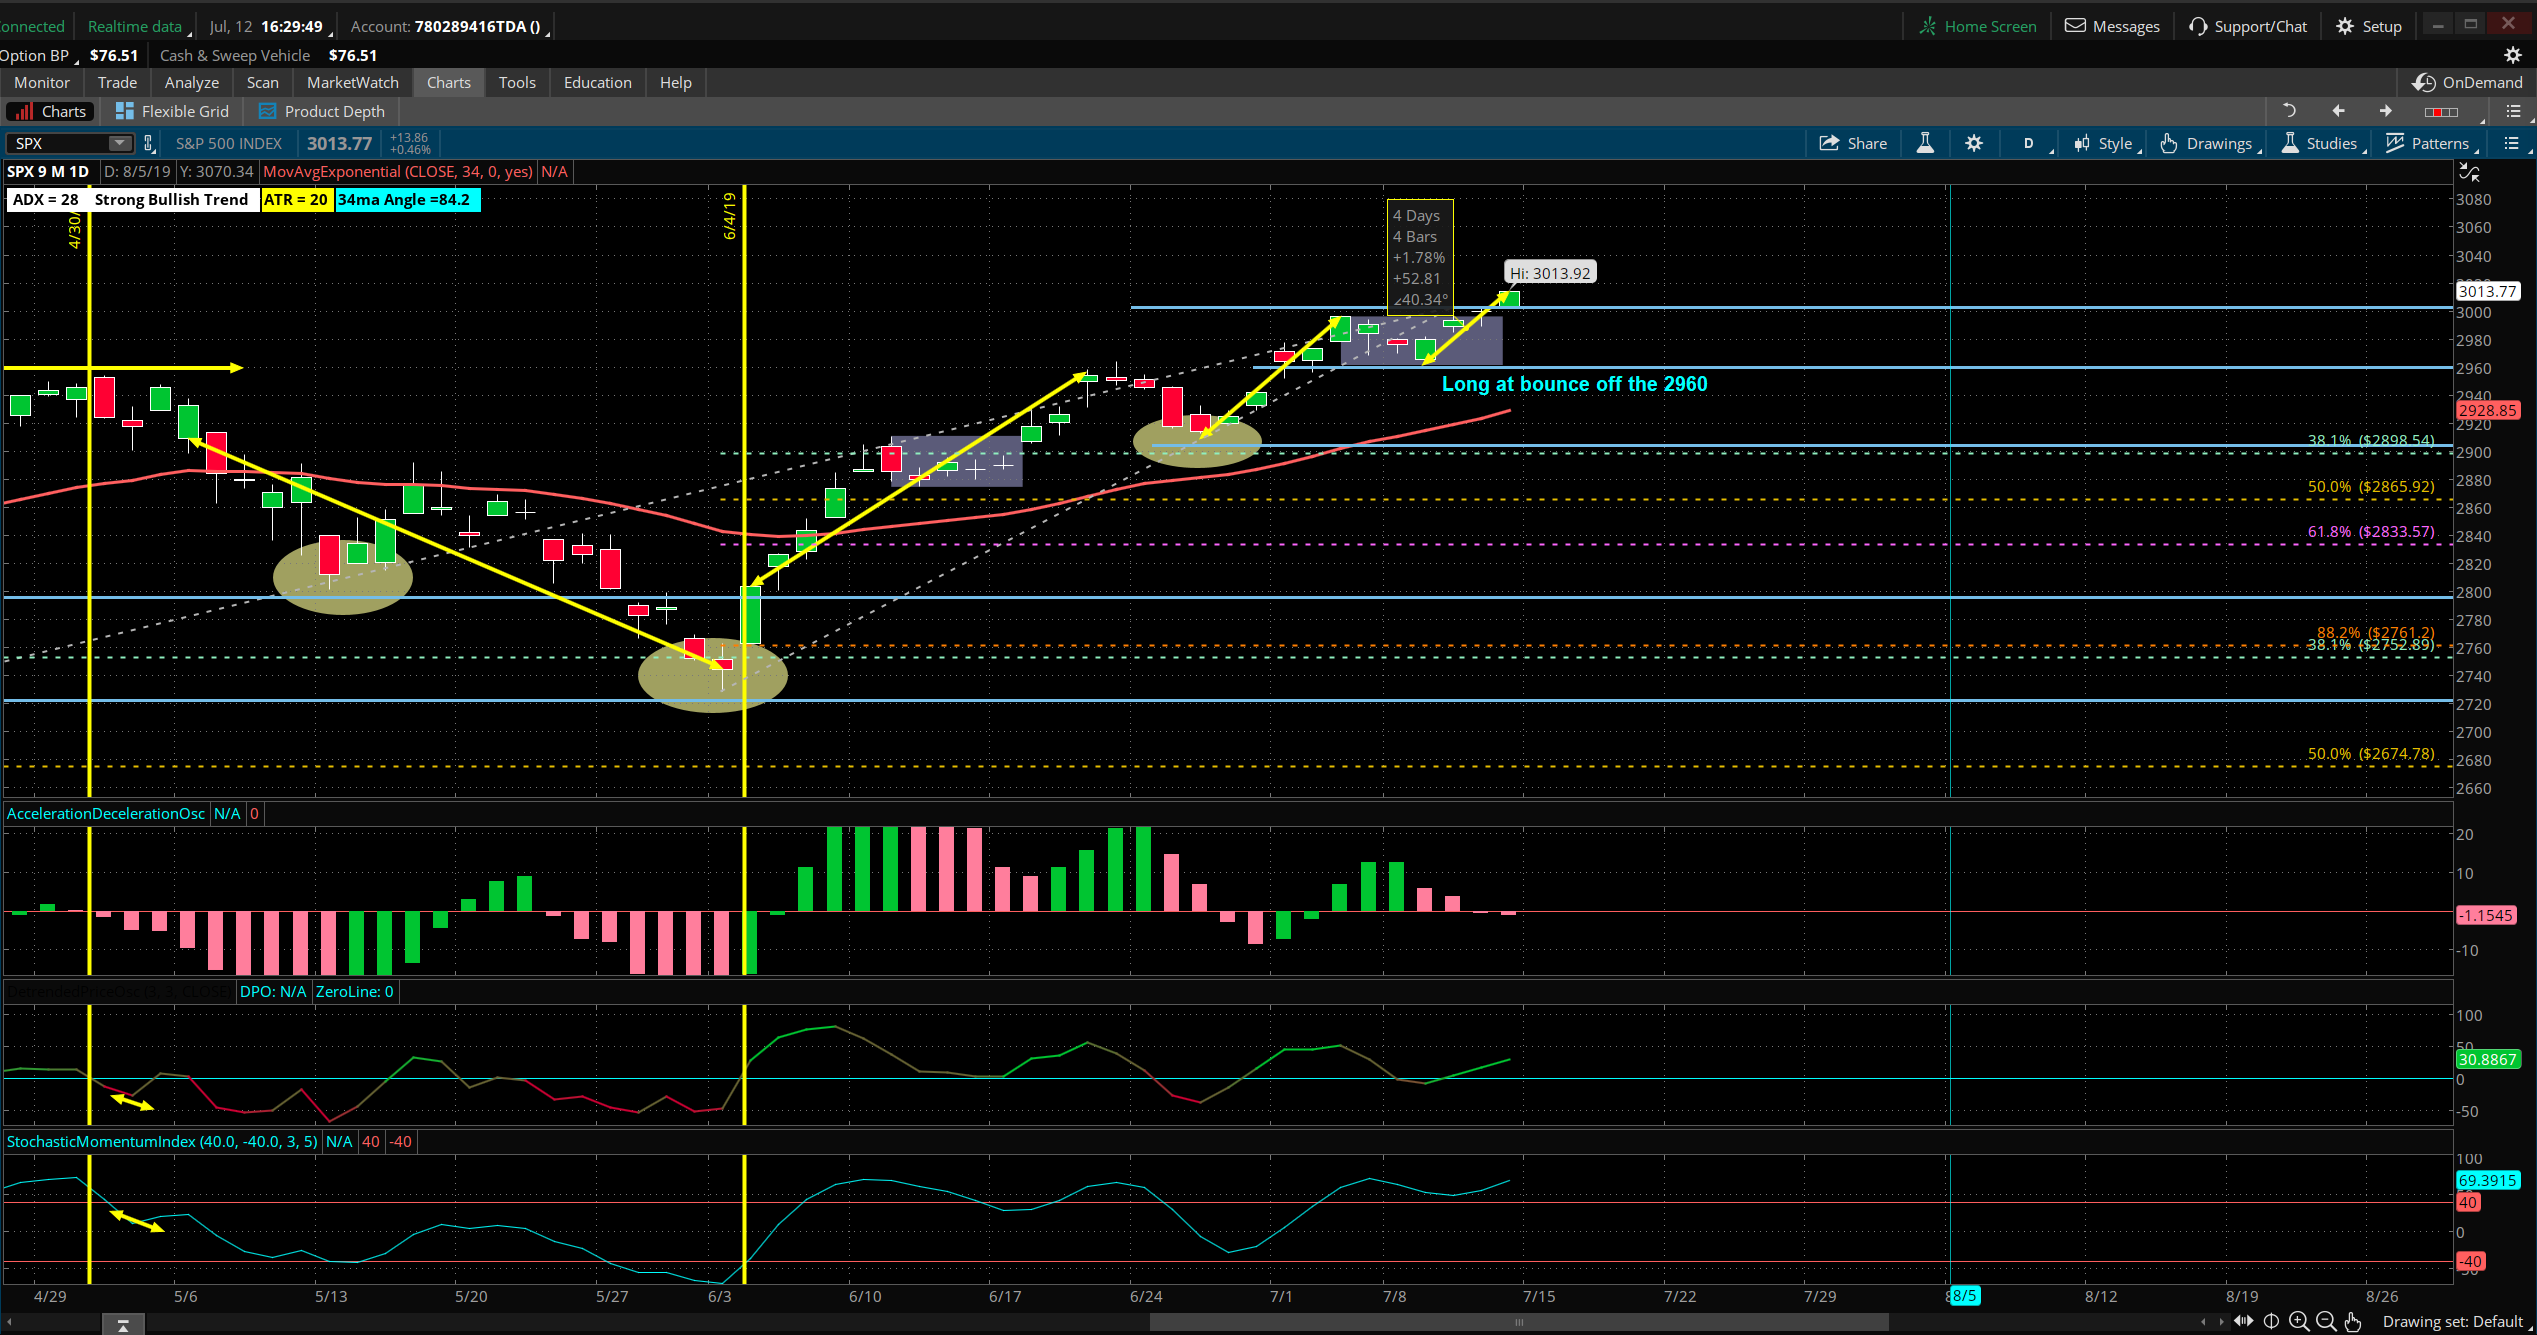
Latest Chart for SPX/ES :
#SPX1dte Bought to close $SPX July 24th 2990/2965 put spreads for 4.05. Sold yesterday for 7.70. Couldn’t let such a nice 1-day profit ride.
