
Rolled $DOCU 160/150 bull put spread up to 185/175 for 1.26 credit. Part of an iron condor with 220/230 bear call spread. Originally sold the iron condor for 3.69 on 7/15. With this credit, total premium taken in now 4.95.
Recent Updates Page 193
KODK
https://www.zerohedge.com/markets/kodak-halted-9-times-stock-explodes-higher-amid-flood-retail-buying
Waiting for Weekly options before partaking 🙂
SPOT put spread
Sold $SPOT 8/21 240/230 bull put spread @ 2.25. Still high IV post-earnings (IVR 48). Short puts 25 delta. Caution: liquidity not great for most options on this underlying.
KHC Strangle / NVAX Roll Call / NVDA Put Closed
#shortstrangles
$KHC STO 7/31 34/37 strangle at .86 Thank you @honkhonk81
#coveredcalls
$NVAX BTC 7/31 145 call and STO 8/7 145 call at added $14 credit. Stock at 146
#shortputs
$NVDA BTC 8/7 350 put at .30. STO on 7/6 at 4.40. Thank you @fuzzballl
QCOM earnings analysis
#Earnings $QCOM reports tonight. Below are details on earnings one-day moves over the last 12 quarters.
April 29, 2020 AC -0.37%
Feb. 5, 2020 AC -0.32%
Nov. 6, 2019 AC +6.32%
July 31, 2019 AC -2.67%
May 1, 2019 AC +0.89%
Jan. 30, 2019 AC -1.29%
Nov. 7, 2018 AC -8.16% Biggest DOWN
July 25, 2018 AC +7.00% Biggest UP
April 25, 2018 AC +1.44%
Jan. 31, 2018 AC -2.12%
Nov. 1, 2017 AC +2.58%
July 19, 2017 AC -4.94%
Avg (+ or -) 3.18%
Bias -0.14%, no significant bias on earnings.
With stock at 92.50 the data suggests these ranges:
Based on current IV (expected move into Friday per TOS): 87.12 to 97.88 (+/- 5.8%)
Based on AVERAGE one-day move over last 12 quarters: 89.56 to 95.44
Based on MAXIMUM one-day move over last 12 Q’s (8.2%): 84.95 to 100.05
Based on UP max only (+7.0%): 98.98
Open to requests for other symbols.
AMD Earnings
#ShortPuts #OneNightStand – A quickie…
Bought to Close AMD AUG 21 2020 62.5 Puts @ .40 (sold for 1.82)
FB Earnings
https://www.thestreet.com/investing/facebook-fb-stock-earnings-report-delay-mark-zuckerberg
SPX trades
#SPX1dte Sold to Open $SPX July 29th 3125/3145-3265/3285 condors for 1.65, IV 18.1%, SPX 3219, deltas: -.06, +.09
#SPX7dteLong Sold to close July 29th 3270/3290 call spreads for .75… as usual, I get the direction wrong! Wanted to close up to get 3.00 or more for this.
TQQQ
BTC JUly 31 75 puts at .02 cents, sold at 1.12, forgot to post earlier.
SOXL
STO January 55 puts at 2.05, stock is trading at $204
XRX
Back in
Bought XRX / Sold XRX 08/21/2020 15.0 Covered Call @ 14.20 Debit
Bought XRX / Sold XRX 09/18/2020 16.0 Covered Call @ 14.20 Debit.
The low for the year so far on the stock is 14.22
A nice 6.5% dividend too.
AMD Earnings
#ShortPuts #Earnings #TakeOneForTheTeam
This might stir stir things up a little bit. Going to the monthly with a fairly aggressive sale near the breakout level.
Sold AMD AUG 21 2020 62.5 Puts @ 1.82
GLD
Gartman: “I’m Getting Out Of Gold”
Just the news gold bulls have been waiting for.
SHOP earnings analysis
#Earnings $SHOP reports tomorrow morning. Below are details on earnings one-day moves over the last 12 quarters.
May 6, 2020 BO +6.91%
Feb. 12, 2020 BO +7.81%
Oct. 29, 2019 BO -3.81%
Aug. 1, 2019 BO +7.39%
April 30, 2019 BO +7.85%
Feb. 12, 2019 BO +1.37%
Oct. 25, 2018 BO +12.03% Biggest UP
July 31, 2018 BO -6.66%
May 1, 2018 BO -4.45%
Feb. 15, 2018 BO +0.28%
Oct. 31, 2017 BO -9.02% Biggest DOWN
Aug. 1, 2017 BO +5.77%
Avg (+ or -) 6.11%
Bias 2.12%, positive bias on earnings.
With stock at 982.00 the data suggests these ranges:
Based on current IV (expected move into Friday per TOS): 895.07 to 1068.93 (+/- 8.9%)
Based on AVERAGE one-day move over last 12 quarters: 921.98 to 1042.02
Based on MAXIMUM one-day move over last 12 Q’s (12.0%): 863.87 to 1100.13
Based on DOWN max only (-9.0%): 893.42
Open to requests for other symbols.
AMD
BTC AMD 7/31/2020 54 #ShortPut @0.11. Was STO @3.14 on 7/16.
Have been in this for a while, just taking the profit early here. I still think AMD is in a pretty good position right now, with what Intel announced recently about issues. Will likely look again after earnings.
TQQQ
STO December 60 puts at 5.60
AMD earnings analysis
#Earnings $AMD reports tonight. Below are details on earnings one-day moves over the last 12 quarters.
April 28, 2020 AC -3.33%
Jan. 28, 2020 AC -5.97%
Oct. 29, 2019 AC +0.30%
July 30, 2019 AC -10.09%
April 30, 2019 AC -2.96%
Jan. 29, 2019 AC +19.94% Biggest UP
Oct. 24, 2018 AC -15.44% Biggest DOWN
July 25, 2018 AC +14.33%
April 25, 2018 AC +13.69%
Jan. 30, 2018 AC +6.75%
Oct. 24, 2017 AC -13.47%
July 25, 2017 AC +4.60%
Avg (+ or -) 9.24%
Bias 0.70%, small positive bias on earnings.
With stock at 69.00 the data suggests these ranges:
Based on current IV (expected move into Friday per TOS): 62.72 to 75.28 (+/- 9.1%)
Based on AVERAGE one-day move over last 12 quarters: 62.62 to 75.38
Based on MAXIMUM one-day move over last 12 Q’s (19.9%): 55. 24 to 82.76
Based on DOWN max only (-15.4%): 58.35
Open to requests for other symbols.
NFLX
#ShortStrangles – Squeezing it in a little for some extra credit. Still well outside the expected move…
Rolled NFLX AUG 21 2020 400.0/600.0 Strangle to AUG 21 2020 425.0/575.0 Strangle @ 2.15 credit (10.70 total now)
SLV strangle
Sold $SLV 8/21 20.50/27 strangle @ 1.00. Delta neutral with both sides at 22 delta. IV rank 55.
TQQQ
STO august 14, 75 put at .75
STO August 14, 80 put at 1.20
STO August 21,70 put at .85
STO September 4, 65 put at 1.25
VXX Puts
New VXX Put Diagonals
Bought VXX Jan 15 2021 13.0 Puts / Sold VXX Jul 31 2020 27.50 Puts @ 0.12 Credit.
Bought VXX Jan 15 2021 14.0 Put / Sold VXX Jul 31 2020 28.00 Put @ 0.17 Credit.
Adding Jan longs for free if the short puts expire Friday.
LABU
#ShortPuts – Sold LABU AUG 21 2020 45.0 Puts @ 1.80
TQQQ
Sold TQQQ AUG 21 2020 90.0 Put @ 3.30
SPX 7-dte
#SPX7dteLong Sold to close $SPX July 29th 3260/3240 put spreads for 14.00. Condors bought last Wednesday for 16.95. Looking to avoid a possible danger zone tomorrow, and sell the call spread on a bounce.
CINF
Bought to close 1 CINF 08/21/2020 50.0 Put @ 0.05. It can’t trade any lower. Out almost a month early.
Sold this on 6/19 @ 2.02 when CINF was 63.22
ULTA
#ShortPuts – Following @Ramie’s lead and taking this off a few weeks early. Can add some earnings trades now.
Bought to Close ULTA AUG 21 2020 155.0 Put @ .90 (sold for 2.90)
SPX trades
#SPX7dteLong Bought to Open $SPX Aug 3rd 3215/3235-3245/3265 condors for 17.05, with SPX at 3238.
#SPX1dte Expiring: 3115/3135-3270/3290 condors, sold Friday for 1.25.
#earnings #shortstrangles FFIV Sold Aug….
#earnings #shortstrangles FFIV
Sold Aug. 21, 135/165 strangle for 3.10, stock around 150.
thanks for the data Jeff
WYNN
#CoveredCalls – Staying bearish and rolling down. Cutting long deltas about in half. Earnings next week (maybe)
Rolled WYNN JUL 31 2020 70.0 Call to JUL 31 2020 65.0 Call @ 3.55 credit (7.35 total now)
LULU
#shortstrangles COF Sold Sept. 18,…
SPX 7-dte
#SPX7dteLong Sold to close $SPX July 27th 3245/3225 put spreads for 13.10. Condors bought last Monday for 16.75. Too much risk of this closing near or in the dead zone, so locking in a 3.65 loss now rather than possibly more later.
Taking profits on ULTA
Bought to close $ULTA 8/21 155 puts @ 1.10. Sold for 2.90 on 7/9. Thanks @fuzzballl!
FFIV earnings analysis & trade
#Earnings $FFIV reports tonight. Below are details on earnings one-day moves over the last 12 quarters.
April 27, 2020 AC +7.59% Biggest UP
Jan. 27, 2020 AC -5.04%
Oct. 23, 2019 AC +5.50%
July 24, 2019 AC -0.65%
April 24, 2019 AC -1.08%
Jan. 23, 2019 AC -2.22%
Oct. 24, 2018 AC +6.10%
July 25, 2018 AC +1.07%
April 25, 2018 AC +0.89%
Jan. 24, 2018 AC -5.05%
Oct. 25, 2017 AC +3.97%
July 26, 2017 AC -7.16% Biggest DOWN
Avg (+ or -) 3.86%
Bias 0.33%, small positive bias on earnings.
With stock at 153.00 the data suggests these ranges:
Based on current IV (expected move into Friday per TOS): 143.53 to 162.47 (+/- 6.2%)
Based on AVERAGE one-day move over last 12 quarters: 147.09 to 158.91
Based on MAXIMUM one-day move over last 12 Q’s (7.6%): 141.39 to 164.61
Based on DOWN max only (-7.2%): 142.05
NOTE: 5-day max moves are roughly the same as 1-day
Open to requests for other symbols.
TQQQ
On Friday I did sell the December 35 puts at 2.05, It went into the wrong account and I did not see it.
Pandemic Profiteering?
Interesting Article.
https://www.zerohedge.com/markets/when-qqqs-make-you-queasy
MDLZ
BTC MDLZ July 24: 53.5 short straddle @ $1.38 (originally sold for $1.38)
STO MDLZ July 31: 55.0 short straddle @ $2.17
Cover is the Jan 2022 long 40 put / 65 call strangle.
EWZ
BTC EWZ July 24: 31 straddle @ $1.54 (originally sold for $1.40)
STO EWZ July 31: 32.5 straddle @ $1.55
Standstill on premium income, but the Sep 18 $30 long call moves further ITM
The short straddle is covered by a long EWZ Sep 18: 24 put / 30 call strangle.
TQQQ
STO December 18, 35 puts at 2.05, I guess someone is very bearish.
SPX 1-dte
#SPX1dte Sold to Open $SPX July 27th 3115/3135-3270/3290 condors for 1.25, IV 13.12%, SPX 3213, deltas -.06, +.05.
Expiring: July 24th 3125/3145-3290/3310 condors, sold yesterday for .95
VXX Puts
Bought to close VXX 07/24/2020 29.50 Puts @ 0.01. Sold these on 7/20 @ 0.59
VIAC Rollout
Bought to close VIAC 07/24/2020 24.0 Diagonal Calls / Sold 07/31/2020 24.0 Calls @ 0.38 Credit
SPX 7-dte
#SPX7dteLong Bought to Open $SPX July 31st 3185/3205-3215/3235 condors for 17.55, with SPX at 3213.
Hanging on the edge to end the day below 3205 for full profit on today’s.
Markets
Navigating The Tech Bubble & Living To Tell About It
If you have been around the markets for any length of time, you can quickly spot the “pigeons at the poker table.” They are the ones that rationalize why prices can only rise, why “this time is different,” and focus only on the bullish supports.
#MacroView: Navigating The Tech Bubble & Living To Tell About It.
TRADES: Not timely.
APT BTC 7/24/20 25.0 CALLS @.02 STO @1.15
APT BTC 7/24/20 23.0 CALLS @.05 STO @.53
APT STO 7/30/20 24.0 CALLS @.80
SDGR BTC 8/21/20 100.0 CALL @1.30 STO @8.00
SDGR BTO STOCK @75.0
LABU
#ShortPuts – Sold LABU AUG 14 2020 40.0 Puts @ 1.10 and 1.15
Econ Calendar for week of 7/27/20


Link to calendar:
NTAP UVXY WYNN
#ShortPuts #CoveredCalls – A few today…
NTAP: Old earnings trade still plugging away with covered calls. Next earnings still a few weeks away.
Bought to Close NTAP JUL 24 2020 45.0 Calls @ .04 (sold for .71)
Sold NTAP JUL 31 2020 45.0 Calls @ .48
UVXY: Good day in this one. Rolling covered calls and replacing short puts expiring today.
Rolled UVXY JUL 24 2020 27.0 Calls to JUL 31 2020 27.5 Calls @ 1.15 credit (4.55 total now)
Sold UVXY JUL 31 2020 26.0 Puts @ 1.02
WYNN: Glad I went 10 dollars in the money with the covered call last week.
Bought to Close WYNN JUL 24 2020 70.0 Call @ 2.22 (sold for 13.35)
Sold WYNN JUL 31 2020 70.0 Call @ 3.80
T Earnings
#ShortPuts #Earnings – Didn’t get the bounce so booking it for small gain. Still holding Aug 28.5 strike.
Bought to Close T JUL 24 2020 30.5 Puts @ .45 (sold for .75)
VIAC
Bought to close VIAC 07/24/2020 26.0 Diagonal Calls @ 0.01.
Sold these Monday @ 0.44 against long Calls expiring in September
EW closed
#Earnings. Legged out of $EW 24Jul/31Jul 78 #DoubleCalendar as two straddles. Couldn’t ask for a better move on the stock.
Bought to close $EW July 24th 78 straddles for 1.051.
Sold to close $EW July 31st 78 straddles for 2.822
#DoubleCalendars Bought for .742 yesterday, sold for 1.771.
INTC
Intel down 15%.
Wow
TQQQ
STO August 28, 60 put at 1.20, just scaling in small positions.
SQQQQ
Sold SQQQ 07/21/2020 8.50 Covered Calls @ 0.10
VXX Puts
Bought to close VXX 07/24/2020 28.50 Puts @ 0.01. Sold these on 7/20 @ 0.36 and again @ 0.63.
Started a new position selling some VXX 07/31/2020 28.0 Puts @ 0.41
#shortputs $INO BTC 8/21 17…
#shortputs
$INO BTC 8/21 17 put and STO 8/21/24 put at added $3 credit.
$ZM BTC 7/24 put at .05. STO 6/26 at 3.66
$STNE BTC 8/21 put at .40. STO 7/14 at 2.70
SPX spec
#SPX1dte Bought to Open $SPX July 29th 3310/3325 call spreads for 1.80. Spec play based on pullback during Upside Warning.
Markets – AAMTG
The big boys finally get hit – Tech Giants Apple, Amazon, Microsoft, Tesla, Google Tumble
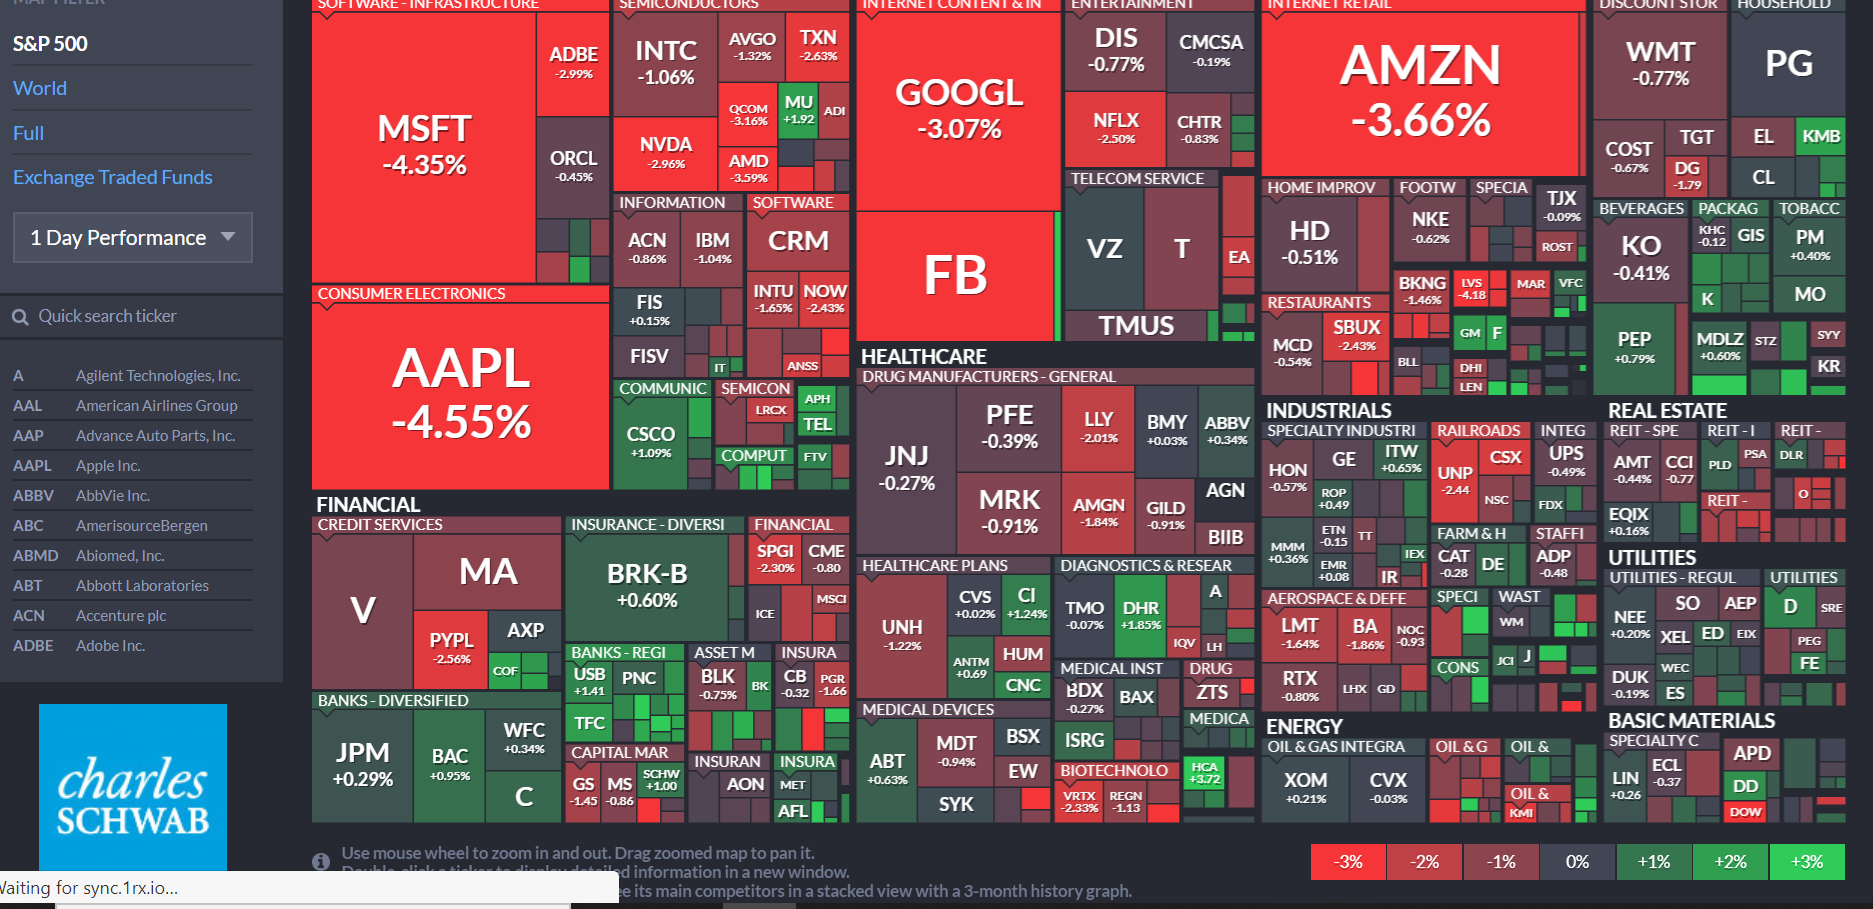
https://www.finviz.com/map.ashx?t=sec
SPX 1-dte
#SPX1te Sold to Open $SPX July 24th 3125/3145-3290/3310 condors for .95, IV 19.05%, SPX 3232, deltas: -.05, +.05.
VXX New Diagonal
Bought to Open 1 VXX Oct 16 2020 70 Call at $1.24
Sold to Open 1 VXX Jul 31 2020 32 Call at $1.36
for a Net Credit at $0.12
Pushing my (hopefully free) long position out closer to the election
VXX
Moving out to next week’s Calls for a diagonal spread.
Sold VXX JUL 31 2020 $37 Calls @ 0.57 against August and September long positions.
#DoubleDip
Doing this as VXX crosses above 30, taking all of tomorrow’s short puts out of the money.
EW earnings analysis & trade
#Earnings $EW reports tonight. Below are details on earnings one-day moves over the last 12 quarters.
April 23, 2020 AC +1.10%
Jan. 30, 2020 AC -6.03%
Oct. 23, 2019 AC +1.63%
July 23, 2019 AC +9.93% Biggest UP
April 23, 2019 AC -1.79%
Jan. 31, 2019 AC -1.00%
Oct. 23, 2018 AC -5.35%
July 26, 2018 AC -8.50%
April 24, 2018 AC -3.82%
Feb. 1, 2018 AC +3.81%
Oct. 24, 2017 AC -9.55% Biggest DOWN
July 26, 2017 AC +0.64%
Avg (+ or -) 4.43%
Bias -1.58%, negative bias on earnings.
With stock at 61.00 the data suggests these ranges:
Based on current IV (expected move into Friday per TOS): 73.37 to 83.03 (+/- 6.2%)
Based on AVERAGE one-day move over last 12 quarters: 74.74 to 81.66
Based on MAXIMUM one-day move over last 12 Q’s (9.9%): 70.43 to 85.97
Based on DOWN max only (-9.6%): 70.73
Open to requests for other symbols.
TSLA condor closed
#Earnings $TSLA July 24th 1375/1385-1880/1885 condors closed for .40. Sold yesterday for 3.45.
NVDA
#ShortPuts – Adding one the week before earnings down near the 50ma.
Sold NVDA AUG 07 2020 375.0 Put @ 2.59
AAPL
#ShortPuts – Another one for safety. Waiting for earnings now…
Bought to Close AAPL JUL 24 2020 370.0 Put @ .44 (sold for 2.30)
MSFT
#ShortPuts – Haven’t been in this one in ages. Selling at the expected move and the 50ma.
Sold MSFT AUG 21 2020 195.0 Put @ 2.60
TSLA Earnings (pre and post)
#ShortPuts #ShortStrangles #JadeLizards
Bought to Close TSLA JUL 24 2020 1500.0/1505.0 Bear Call Spread part of the Jade Lizard @ 4.49
Any fill better than 5.0 adds to the profit here. I’ll let the put side expire for net gain of 2.36.
Also:
Sold TSLA AUG 21 2020 800.0/3200.0 Strangle @ 6.10 (can do better now)
Figuring 50 percent down and 100 percent up might be safe! 🙂 🙂
Also:
Still holding 600 strike short put in Aug monthly.
#fuzzyhotair #putratioladder AAPL put ratio…
AAPL put ratio ladder, week 3 (1×2 credit ratios, 30 delta/25 delta, with a BWB hedge to extend downside)
Week 1: CLOSED
Aug 21 345/340 sold 6.70, bought 2.32
Wish I hadn’t closed this, the breakeven was super far away…should have let more juice drain off until 20 DTE
Week 2:
Aug 28 372.5/365 sold 7.12, put fly hedge 350/340/335 .90
Breakeven $340
Week 3–the Sep 4 expiration just opened today
Sep 4 360/355 sold 6.05, put fly hedge bought 345/335/330 for .93
Breakeven: $335
TSLA post-earnings condor
Sold $TSLA 8/21 1330/1350//1800/1820 iron condor @ 9.40. Leaning short with short puts and calls at 20 and 36 delta. IV rank 34.
INTC earnings analysis
#Earnings $INTC reports tonight. Below are details on earnings one-day moves over the last 12 quarters.
April 23, 2020 AC +0.37%
Jan. 23, 2020 AC +8.13%
Oct. 24, 2019 AC +8.09%
July 25, 2019 AC -1.09%
April 25, 2019 AC -8.99% Biggest DOWN
Jan. 24, 2019 AC -5.46%
Oct. 25, 2018 AC +3.11%
July 26, 2018 AC -8.58%
April 26, 2018 AC -0.60%
Jan. 25, 2018 AC +10.55% Biggest UP
Oct. 26, 2017 AC +7.37%
July 27, 2017 AC +0.97%
Avg (+ or -) 5.28%
Bias 1.16%%, positive bias on earnings.
With stock at 61.00 the data suggests these ranges:
Based on current IV (expected move into Friday per TOS): 58.17 to 63.83 (+/- 4.6%)
Based on AVERAGE one-day move over last 12 quarters: 57.78 to 64.22
Based on MAXIMUM one-day move over last 12 Q’s (10.6%): 54.56 to 67.44
Based on DOWN max only (-9.0%): 55.52
Open to requests for other symbols.
SPX trades
#SPX7dteLong Bought to Open $SPX July 29th 3240/3260-3270/3290 condors for 16.95, with SPX at 3268.
Expiring: July 22nd 3230/3250 call spreads for max credit of 20.00. Condors bought last Wednesday for 17.40.
#SPX1dte Expiring: July 22nd 3165/3185-3310/3330 condors, sold yesterday for 1.10.
VIX – worth a read
https://www.zerohedge.com/markets/volatility-more-number-its-everything
Textbook Volatility Defined
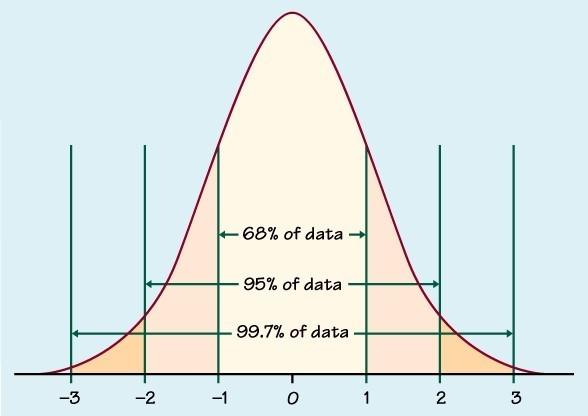
Volatility is a measure of the historical dispersion of returns around a mean. The greater the dispersion, the higher the volatility, and ultimately the range of potential outcomes.
Volatility is typically quoted as +/- 1 standard deviation. For instance, 14% annualized volatility means, with 68% certainty, we should expect annualized returns to be +/- 14%. The volatility formula describes a normal bell-shaped curve in which price changes should be contained.
Normal implies there are equal odds the market falls 1% or rises 1% versus the average change. The graph below depicts a bell-shaped curve. The diagram also highlights standard deviations and the percentage of data that falls within each deviation.
Normal Is Not Reality
The assumption of a normally distributed bell curve is at the heart of finance. Embedded in that assumption is the idea that market participants are rational and markets efficient. It drives risk management, option pricing, and many economic and market theories. The problem with such analysis is that the assumption is flat out wrong.
In a normal shaped curve, the S&P 500 should never move by more than five standard deviations up or down. By “never,” we mean once every 3.5 million trading days (approximately 14,000 years). Since 1970 there have been 34 such days. In March of 2020 alone, there were 7!
Summary
When investor confidence is high, liquidity is high, and volatility is typically low. Plenty of buyers and sellers willing to trade help assure orderly markets. However, when potential buyers become concerned about the risk of loss, liquidity fades. Buyers step away, sellers will take almost any price to protect against even steeper declines, and prices become more volatile. The suddenness of increased volatility and the false assumption of normally distributed prices leads to statistically impossible drawdowns.
Currently, volatility is two times pre-COVID levels. While sharply lower from March and April, liquidity remains problematic.
Volatility reminds us that the market structure is not stable. As a result, markets are more susceptible to sharp price changes. While most markets have been rising in recent months, the liquidity situation argues that bad news or a change in sentiment could result in substantial and nearly instantaneous losses.
Liquidity is poor, complacency is high, trade with caution.
T Earnings
#ShortPuts #Earnings – Might end up with some stock here. Got another position out in the monthlies slightly lower.
Sold T JUL 24 2020 30.5 Puts @ .75
