#Earnings $NOW reports tonight. Below are details on earnings one-day moves over the last 12 quarters.
NOW has only moved UP on the last 13 earnings reports. Last time it had a down move was Jan 2016.
April 24, 2019 AC +7.41%
Jan. 30, 2019 AC +13.41% Biggest UP
Oct. 24, 2018 AC +1.42%
July 25, 2018 AC +4.60%
April 25, 2018 AC +4.53%
Jan. 31, 2018 AC +2.64%
Oct. 25, 2017 AC +1.21%
July 26, 2017 AC +0.74% Smallest UP
April 26, 2017 AC +3.75%
Jan. 25, 2017 AC +3.61%
Oct. 26, 2016 AC +7.68%
July 27, 2016 AC +4.65%
Avg (+ or -) 4.64%
Bias +4.64%, positive bias on earnings.
With stock at 292.00 the data suggests these ranges:
Based on current IV (expected move into Friday per TOS): 273.15 to 310.85
Based on AVERAGE one-day move over last 12 quarters: 278.46 to 305.54
Based on MAXIMUM one-day move over last 12 Q’s (13.4%): 252.84 to 331.16
Based on smallest UP only (+0.7%): 294.16
Open to requests for other symbols.
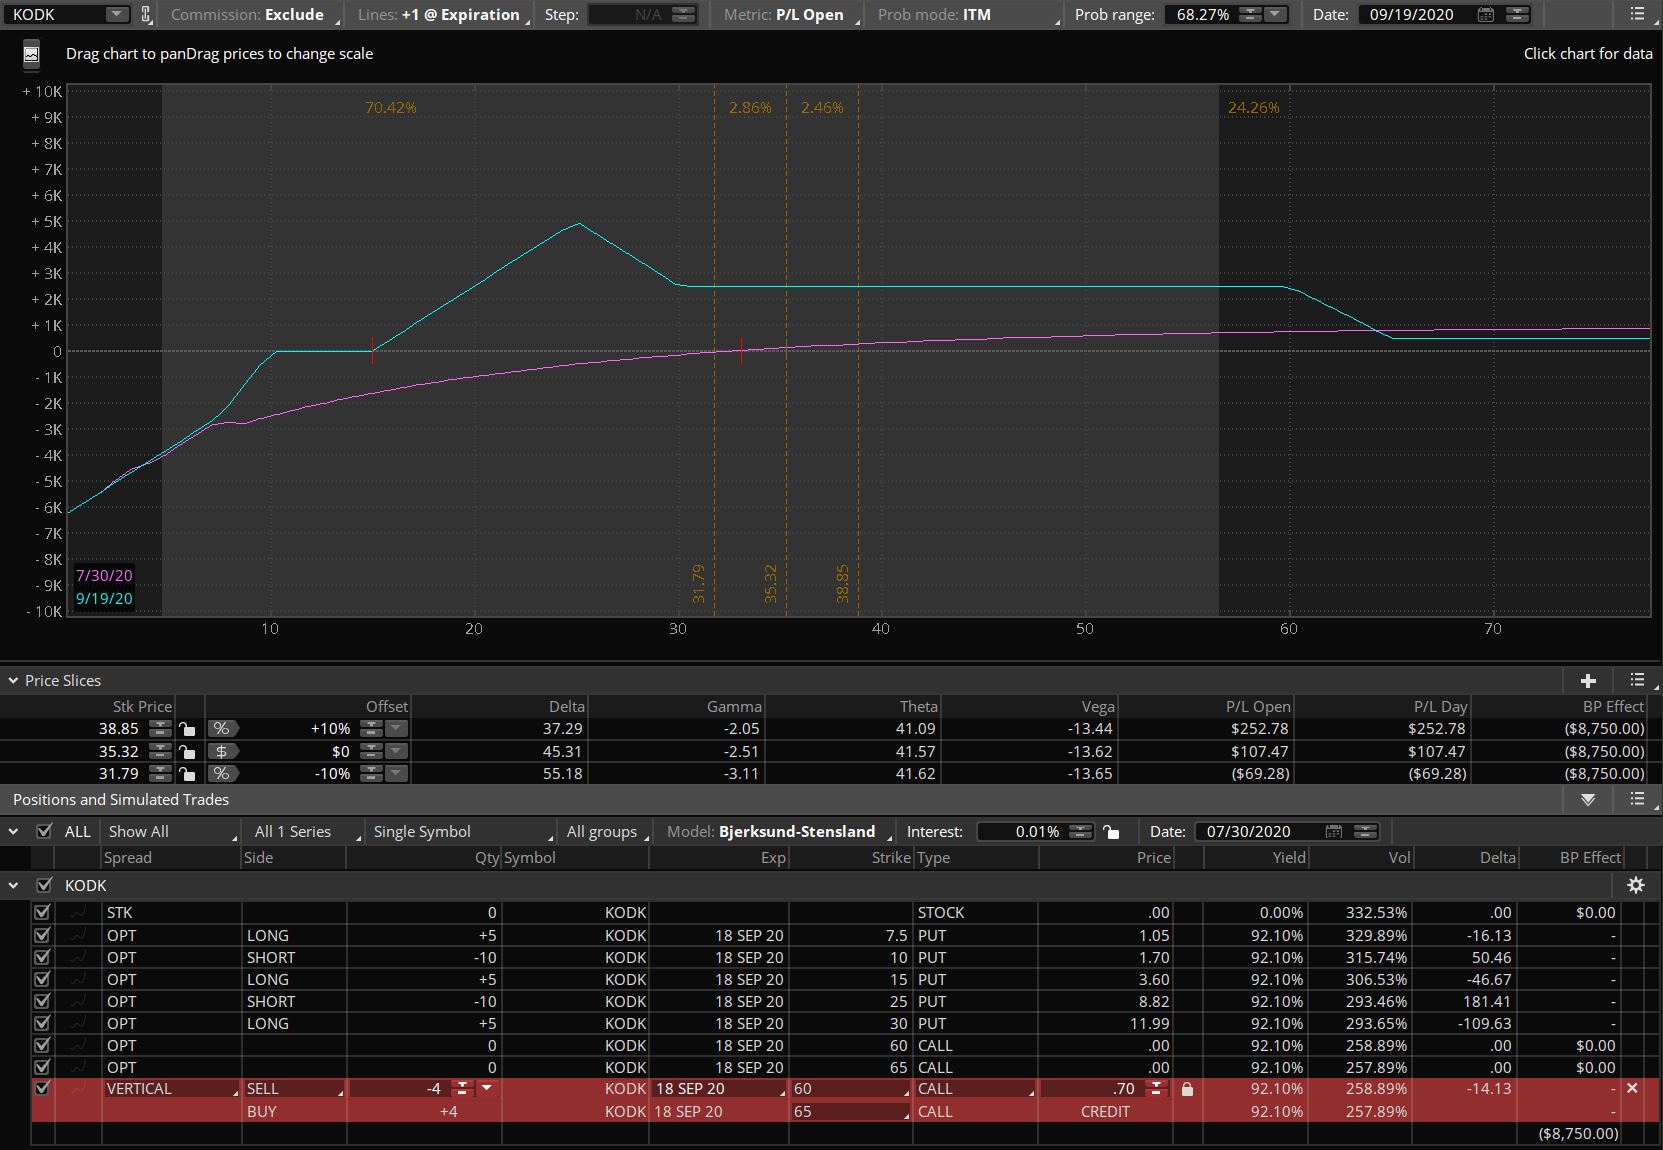
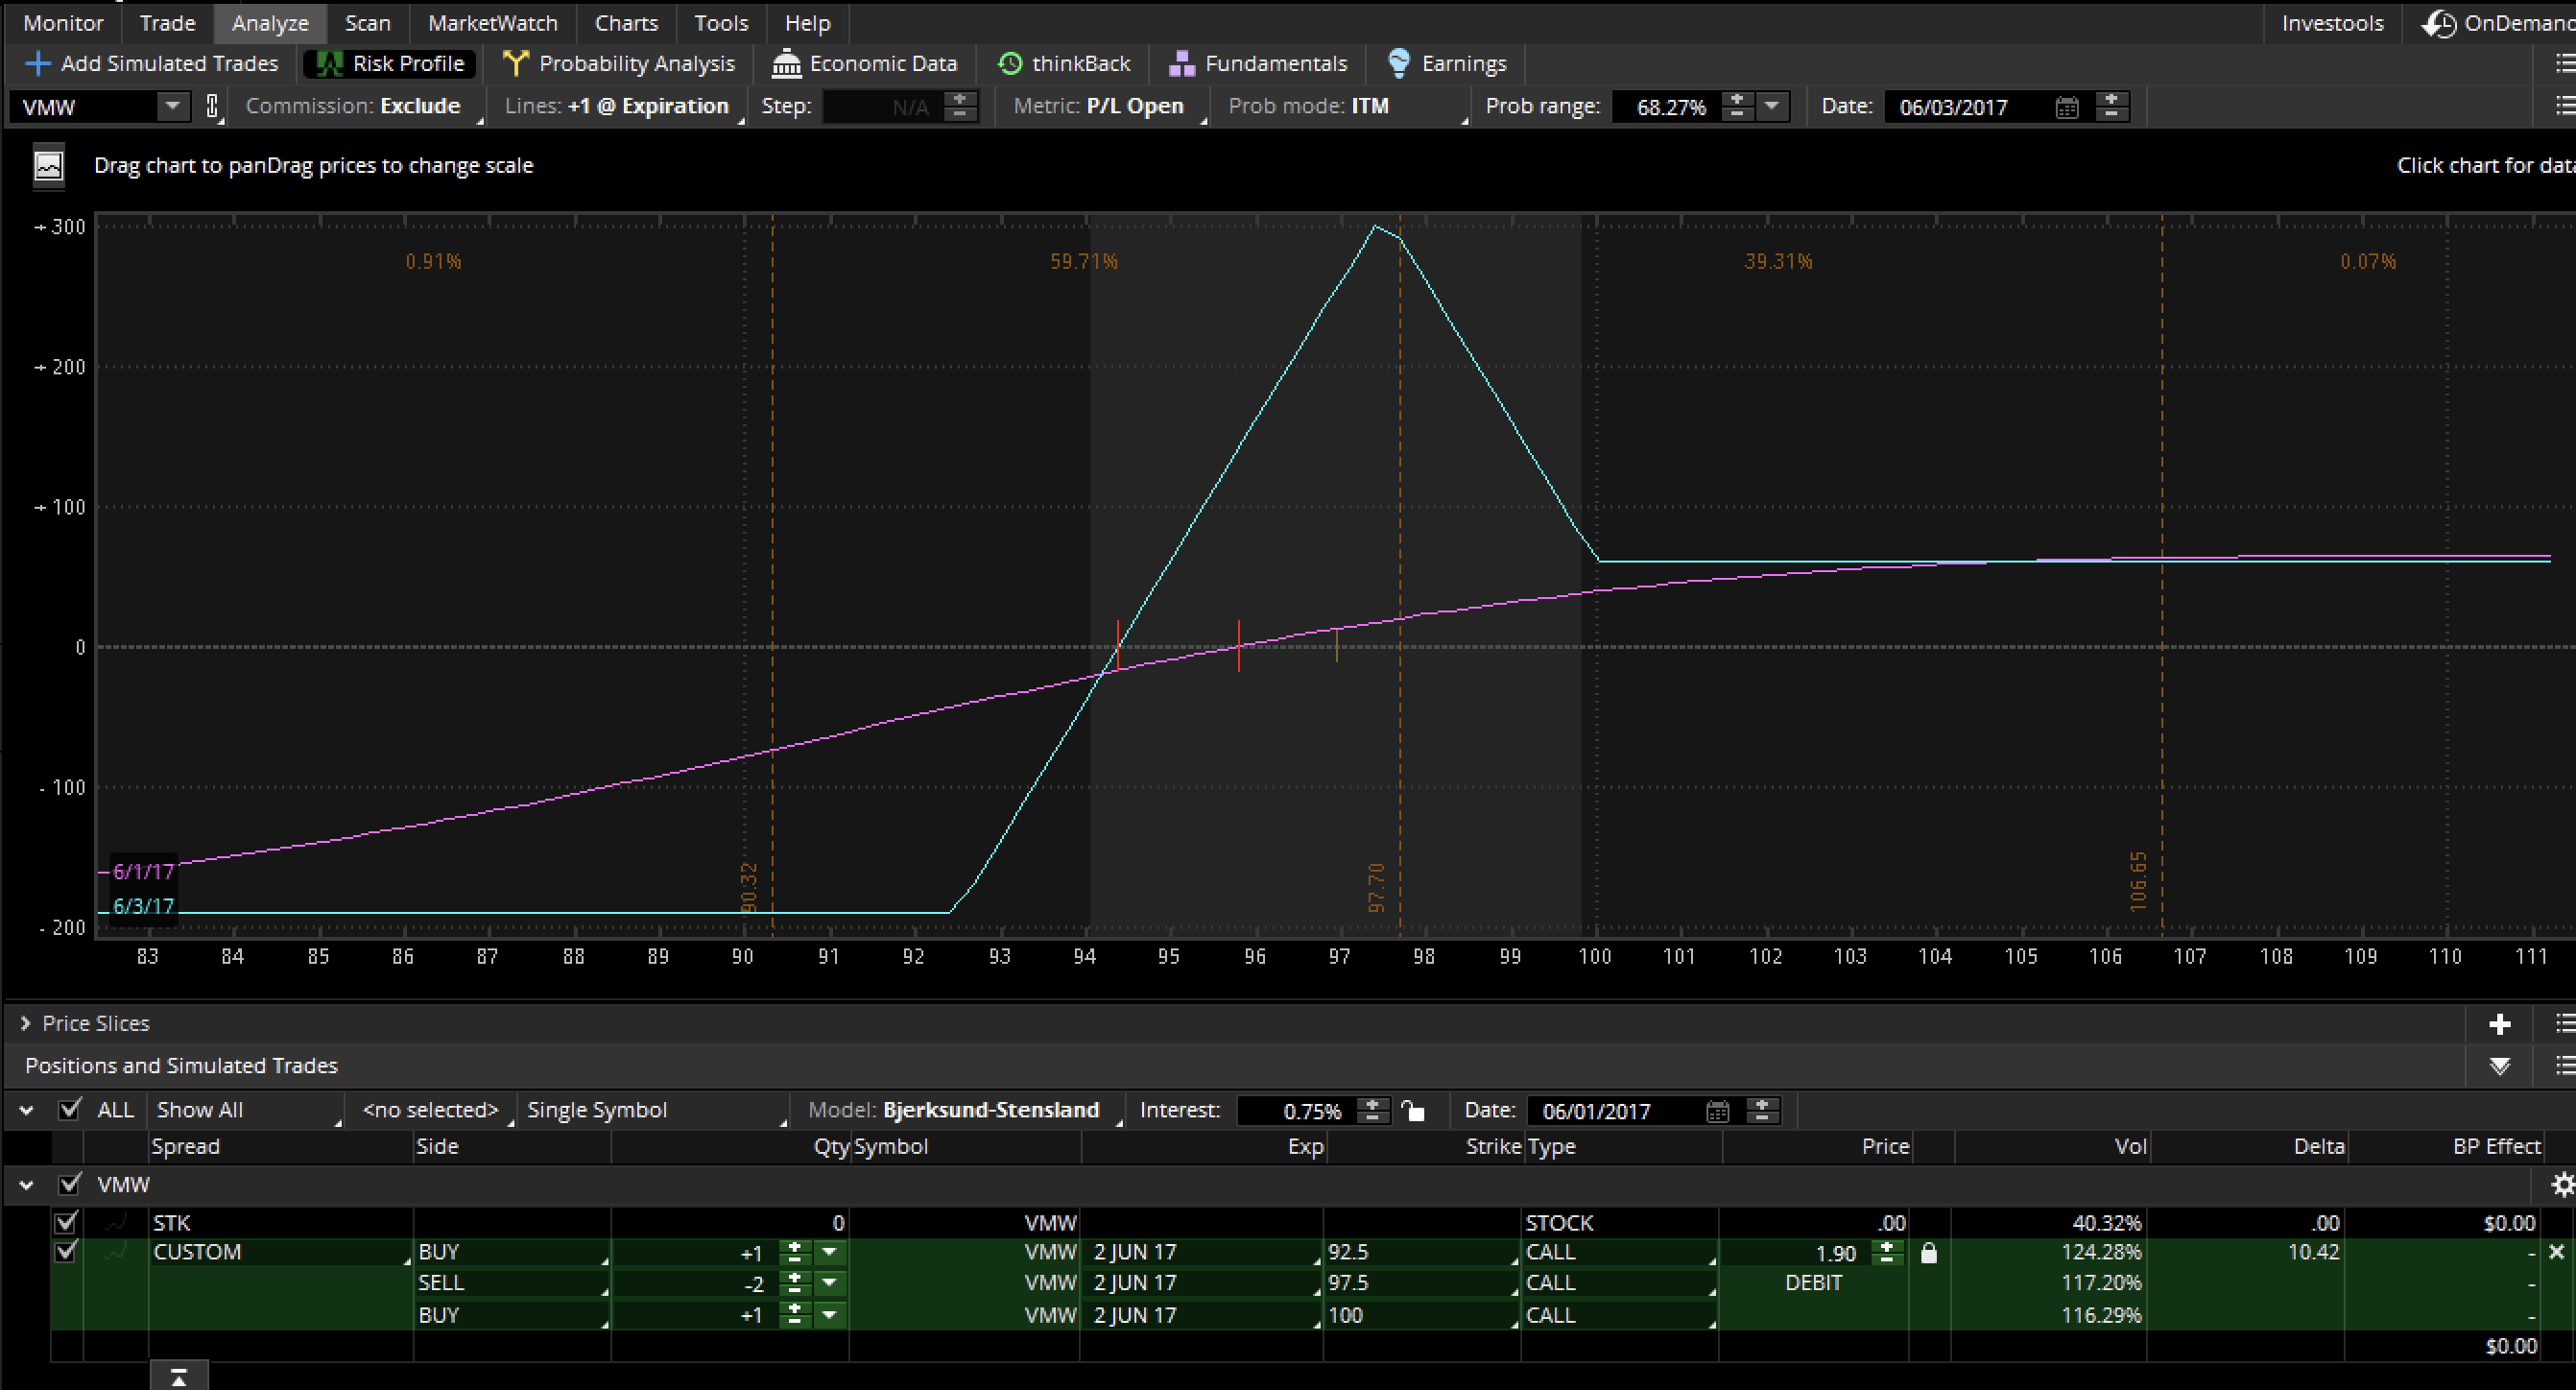
#brokenwingbutterfly