
#SPX1dte Sold to Open $SPX Oct 11th 2835/2855-2990/3010 condors for 1.35, IV 21.30%, SPX 2934.
High IV, lots of news expected.
#SPX1dte Sold to Open $SPX Oct 11th 2835/2855-2990/3010 condors for 1.35, IV 21.30%, SPX 2934.
High IV, lots of news expected.
BREAKING: Stocks jump after Trump tweets he will meet with China's Vice Premier at the White House tomorrow on trade amid reports of little trade talk progress https://t.co/ivEB35OTNo pic.twitter.com/XPRhnix73y
— CNBC Now (@CNBCnow) October 10, 2019
#SPX1dte Sold to Open $SPX Oct 14th 2800/2825-2985/3010 condors for 3.15, IV: 17.01%, SPX close: 2919.
Sold a couple minutes after the closing bell.
#Market So we opened the day higher due to reports that “China is open to a partial US trade deal.”
Now this:
BREAKING: Stocks pull back by about 90 points after Reuters reports that Beijing has lowered expectations for trade talks this week. https://t.co/pWxu4hGRlD pic.twitter.com/Y7lXpOS9yM
— CNBC Now (@CNBCnow) October 9, 2019
#SPX1dte I am considering the Downside Warning and general market weakness. I look at the daily chart and see resistance at 2950 for most of August. I’ve been burned on some of these aggressive spreads recently so I’ll keep a tight leash on it. The biggest risk is, of course, news or a tweet.
Sold to Open $SPX Oct 14th 2950/2975 call spreads for 7.00.
#Earnings $DAL reports tomorrow morning. Below are details on earnings one-day moves over the last 12 quarters.
July 11, 2019 BO +1.16%
April 10, 2019 BO +1.59%
Jan. 15, 2019 BO +0.16%
Oct. 11, 2018 BO +3.56%
July 12, 2018 BO +1.78%
April 12, 2018 BO +2.93%
Jan. 11, 2018 BO +4.76% Biggest UP
Oct. 11, 2017 BO +0.70%
July 13, 2017 BO -1.76% Biggest DOWN
April 12, 2017 BO -0.52%
Jan. 12, 2017 BO -1.06%
Oct. 13, 2016 BO +1.88%
Avg (+ or -) 1.82%
Bias 1.27%, positive bias on earnings.
With stock at 54.00 the data suggests these ranges:
Based on current IV (expected move into Friday per TOS): 51.16 to 56.84
Based on AVERAGE one-day move over last 12 quarters: 53.02 to 54.98
Based on MAXIMUM one-day move over last 12 Q’s (4.8%): 51.43 to 56.57
Based on DOWN max only (-1.8%): 53.05
Open to requests for other symbols.
#Earnings Sold to close $DPZ Oct11/Oct18 242.5 #DoubleCalendar for 2.05. Bought Tuesday for 1.05. Only got filled on a 1-lot; should have forced the issue!
#SPX1dte Sold $SPX Oct 9th 2830/2850-2955/2975 condors for 1.15, IV 16.66%, SPX 2906.
#SPX1dte . Looks like the Downside Warning may come through. BTC $SPX Oct 11th 2855/2830 put spreads for 4.00. Condors sold yesterday for 3.00. Stop breached when SPX went below 2905. Perhaps it found support at 2900, but it looks like we could be going lower so getting out while it’s cheap.
#Earnings $DPZ reports tonight. Below are details on earnings one-day moves over the last 12 quarters.
July 16, 2019 BO -8.66%
April 24, 2019 BO +4.89%
Feb. 21, 2019 BO -9.14%
Oct. 16, 2018 BO -4.87%
July 19, 2018 BO -2.44%
April 26, 2018 BO +7.31% Biggest UP
Feb. 20, 2018 BO +0.33%
Oct. 12, 2017 BO -3.73%
July 25, 2017 BO -10.08% Biggest DOWN
April 27, 2017 BO +2.53%
Feb. 28, 2017 BO +2.36%
Oct. 18, 2016 BO +4.89%
Avg (+ or -) 5.10%
Bias -1.38%, negative bias on earnings.
With stock at 242.50 the data suggests these ranges:
Based on current IV (expected move into Friday per TOS): 225.42 to 259.58
Based on AVERAGE one-day move over last 12 quarters: 230.13 to 254.87
Based on MAXIMUM one-day move over last 12 Q’s (10.1%): 218.06 to 266.94
Based on UP max only (+7.3%): 260.23
Open to requests for other symbols.
#SPX1dte Sold to Open $SPX Oct 11th 2830/2855-3005/3030 condors for 3.00, IV17.92%, SPX 2945.
#SPX1dte BTC $SPX Oct 7th 2885 puts for .05. Taking off downside risk, allowing remainder of condor to expire (sold Friday for 1.00)
#SPX1dte Sold to Open $SPX Oct 7th 2865/2885-2980/3000 condors for 1.00, IV: 9.92%, SPX 2943.
Expiring today (hopefully): 2820/2840-2950/2970 condors, sold yesterday for 1.20.
#SPX1dte . BTC $SPX Oct 7th 2960/2985 call spread for 1.95. Condors sold for 2.85 on Wednesday. It came within expected move today. The #VIXIndicator is getting whipsawed this time around. It will suck two get to false signals in a row, but it is shaping up that way right now. Next week will give us the answers.
#Earnings . Sold to close $COST Oct04/Oct11 285 #DoubleCalendar for 4.00. Bought yesterday for 2.00.
I thought I was asking too much to start at 4.00, but it filled at the bell. Could have gotten more.
#Jobs — 50-year low in unemployment rate
+136,000 non-farm payroll jobs, vs. 145K expected
Unemployment at 3.5%, lowest since 1969
U6 unemployment at 6.9%, down by 0.3
Wages unchanged, 2.9% year over year
Labor force participation 63.2%, unchanged
August revised up from 130K to 168K
July revised up from 159K to 166K
#SPX1dte Sold to Open $SPX Oct 4th 2820/2840-2950/2970 condors for 1.20, IV: 17.18%, SPX 2904.
#Earnings Bought to Open $COST Oct04/Oct11 285 #DoubleCalendar for 2.00. Order was put in hours ago, took awhile to fill.
September #ISM non-manufacturing index fell 3.8 points to 52.6 (lowest since August 2016 & well below even most pessimistic forecast in Bloomberg survey); growth in orders/business activity plunged & employment registered weakest print in more than 5y
— Liz Ann Sonders (@LizAnnSonders) October 3, 2019
#Earnings $COST reports tonight. Below are details on earnings one-day moves over the last 12 quarters.
May 30, 2019 AC -0.81%
March 7, 2019 AC +5.08% Biggest UP
Dec. 13, 2018 AC -8.58% Biggest DOWN
Oct. 4, 2018 AC -5.55%
May 31, 2018 AC -0.55%
March 7, 2018 AC -0.89%
Dec. 14, 2017 AC +3.32%
Oct. 5, 2017 AC -5.97%
May 25, 2017 AC +1.79%
March 2, 2017 AC -4.33%
Dec. 7, 2016 AC +2.43%
Sept. 29, 2016 AC +3.40%
Avg (+ or -) 3.56%
Bias -0.89%, negative bias on earnings.
With stock at 285.00 the data suggests these ranges:
Based on current IV (expected move into Friday per TOS): 272.00 to 298.00
Based on AVERAGE one-day move over last 12 quarters: 274.86 to 295.14
Based on MAXIMUM one-day move over last 12 Q’s (-8.6%): 260.55 to 309.45
Based on DOWN max only (+5.1%): 299.48
Open to requests for other symbols.
#VIXIndicator So after the failure of the Upside, we entered a Downside at today’s close. This signal usually means the market goes lower over the coming days.
#SPX1dte Sold to Open $SPX Oct 7th 2780/2805-2960/2985 condors for 2.80, IV 17.29%, SPX 2889. Using expected move to down side as stop; half expected move to upside.
#PerpetualRollingStrangles BTC $UBER Oct 4th 31 puts for 2.35. Calls previously closed for .05. Strangles sold for .90 on 9/11. This strategy has worked well on UBER, but will wait a few days before starting a new one. My naked puts on $CHWY have NOT worked; underwater. The Upside Warning had me overly confident on both of these.
#SPX1dte Stop level was breached quickly this morning. BTC $SPX Oct 2nd 2890/2870 put spreads for 2.95. Condors sold yesterday for .867.Also having to close the Oct 4th spread. Stop was not breached yesterday but it was on the opening tick this morning.
#VIXindicator It seemed obvious days ago but it was just officially canceled. This is only the third total failure of the signal since 1999, out of 44 total, where the SPX made no new high after the signal fired, other than a brief intraday spike the very next day.
Okay who is with Schwab and can you find out how much SPX option commissions will be?
#SPX1dte Sold to Open $SPX Oct 2nd 2870/2890-2980/3000 condors for .867, IV 13.55%, SPX 2946.
US manufacturing economy contracts to worst level in a decade
https://tradingeconomics.com/united-states/business-confidence
#SPX1dte . Sold to Open $SPX Oct 4th 2880/2905-3030/3055 condors for 2.40, IV: 14.37%, SPX 2981.
Expiring today: Sept 30th 2865/2885-3000/3020 condors, sold Friday for 1.10
#SPX1dte Sold $SPX Sept 30th 2865/2885-3000/3025 condors for 1.10, IV 12.31%, SPX 2956.
#SPX1dte. Bought to close $SPX Sept 27th 2935/2915 put spreads for .75. Condors sold yesterday for .95.
Closing Monday’s spread as well, and stuck with almost full loss on today’s spread.
#SPX1dte Sold to Open $SPX Sept 27th 2915/2935-34010/3030 condors for .95, IV: 11.80%, SPX 2980.
#Earnings $MU reports tonight. Below are details on earnings one-day moves over the last 12 quarters.
June 25, 2019 AC +13.34% Biggest UP
March 20, 2019 AC +9.61%
Dec. 18, 2018 AC -7.91%
Sept. 20, 2018 AC -2.86%
June 20, 2018 AC +0.83%
March 22, 2018 AC -7.99% Biggest DOWN
Dec. 19, 2017 AC +4.02%
Sept. 26, 2017 AC +8.51%
June 29, 2017 AC -5.11%
March 23, 2017 AC +7.40%
Dec. 21, 2016 AC +12.68%
Oct. 4, 2016 AC -0.56%
Avg (+ or -) 6.74%
Bias 2.66%, positive bias on earnings.
With stock at 49.00 the data suggests these ranges:
Based on current IV (expected move into Friday per TOS): 45.62 to 52.38
Based on AVERAGE one-day move over last 12 quarters: 45.70 to 52.30
Based on MAXIMUM one-day move over last 12 Q’s (13.3%): 42.46 to 55.54
Based on DOWN max only (-8.0%): 45.08
Open to requests for other symbols.
#SPX1dte Sold to Open $SPX Sep 30th 2895/2920-3030/3055 condors for 2.30, IV 11.97%, SPX 2986.
Expiring today: Sep 25th 2890/2910-3005/3025 condors, sold yesterday for .90.
#SPX1dte Sold to Open $SPX Sept 25th 2890/2910-3005/3025 condors for .90, IV: 14.73%, SPX 2965.
#SPX1dte. I had an order in to close this for .95 this morning. It got down to about 1.20 before the drop happened.
BTC $SPX Sep 25th 2980/2955 put spreads for 9.85. Sold for 3.00 yesterday.
Sitting on the Sept 27th 3000/2975 put spread, sold for 5.00 last week. I’m giving that some more time. If formal impeachment inquiries are announced today, I think there’s a chance the market effect will be temporary, as the process will take months, and who really knows how it would effect the economy? But certainly, I’m done with the aggressive put spreads for now.
#Earnings $NKE reports tomorrow morning. Below are details on earnings one-day moves over the last 12 quarters.
June 27, 2019 AC +0.34%
March 21, 2019 AC -6.61%
Dec. 20, 2018 AC +7.16%
Sept. 25, 2018 AC -1.28%
June 28, 2018 AC +11.12% Biggest UP
March 22, 2018 AC +0.32%
Dec. 21, 2017 AC -2.28%
Sept. 26, 2017 AC -1.91%
June 29, 2017 AC +10.96%
March 21, 2017 AC -7.05% Biggest DOWN
Dec. 20, 2016 AC +0.98%
Sept. 27, 2016 AC -3.77%
Avg (+ or -) 4.48%
Bias 0.67%, small positive bias on earnings.
With stock at 87.25 the data suggests these ranges:
Based on current IV (expected move into Friday per TOS): 82.82 to 91.68
Based on AVERAGE one-day move over last 12 quarters: 83.34 to 91.16
Based on MAXIMUM one-day move over last 12 Q’s (11.1%): 77.55 to 96.95
Based on DOWN max only (-7.1%): 81.10
Open to requests for other symbols.
Stocks jump from session lows after Trump says transcript of his call with the Ukraine president will be released tomorrowhttps://t.co/AQCPR2cshs pic.twitter.com/ruqqTAElER
— CNBC Now (@CNBCnow) September 24, 2019
#VIXIndicator. This Upside Warning looks to be a dud. After it fired on Thursday’s close, we only got a 0.3% intraday bump on Friday, then it’s been all lower. There’s never been a pullback this strong on an Upside Warning that ended up bouncing and coming through. This is the 43rd UpW since I started tracking in 2000, but only the fourth to not register any significant higher price after firing.
#Earnings. Sold to close $KMX Sept 27/Oct04 86 #DoubleCalendar for 1.01 – 1.05, and the stock price hovered around the strike price. Bought yesterday for .48. Meanwhile, hell breaks loose.
#SPX1dte Sold $SPX Sept 25th 2980/2955 put spreads for 3.00.
Expiring today:
Sept 23rd 2930/2940-3035/3045, sold Friday for .50
Sept 23rd 2915/2940-3050/3075, sold Wednesday for 2.65
#Earnings $KMX reports tomorrow morning. Below are details on earnings one-day moves over the last 12 quarters.
June 21, 2019 BO +3.18%
March 29, 2019 BO +9.61%
Dec. 21, 2018 BO +3.94%
Sept. 26, 2018 BO -1.60%
June 22, 2018 BO +12.86%
April 4, 2018 BO +4.61%
Dec. 21, 2017 BO -3.60%
Sept. 22, 2017 BO +7.77%
June 21, 2017 BO +0.80%
April 6, 2017 BO +2.36%
Dec. 20, 2016 BO +6.09%
Sept. 21, 2016 BO -2.04%
Avg (+ or -) 4.87%
Bias 3.67%, strongly positive bias on earnings.
NOTE: The 5-day results are still bullish, but less so, as extreme one-day up moves tended to fade over the following days.
With stock at 86.00 the data suggests these ranges:
Based on current IV (expected move into Friday per TOS): 79.60 to 92.40
Based on AVERAGE one-day move over last 12 quarters: 81.81 to 90.19
Based on MAXIMUM one-day move over last 12 Q’s (12.9%): 74.94 to 97.06
Based on DOWN max only (-3.6%): 82.90
Open to requests for other symbols.
#Earnings $AZO reports tomorrow morning. Below are details on earnings one-day moves over the last 12 quarters.
May 21, 2019 BO +5.56%
Feb. 26, 2019 BO +5.10%
Dec. 4, 2018 BO +6.74% Biggest UP
Sept. 18, 2018 BO -1.97%
May 22, 2018 BO -9.48%
Feb. 27, 2018 BO -11.06% Biggest DOWN
Dec. 5, 2017 BO +0.42%
Sept. 19, 2017 BO -5.00%
May 23, 2017 BO -11.84%
Feb. 28, 2017 BO -0.58%
Dec. 6, 2016 BO +0.43%
Sept. 22, 2016 BO -0.42%
Avg (+ or -) 4.88%
Bias -1.84%, negative bias on earnings.
NOTE: The 5-day results are more bullish, as extreme one-day down moves tended to fade over the following days.
5-day bias is +0.80%
With stock at 1152.50 the data suggests these ranges:
Based on current IV (expected move into Friday per TOS): 1081.01 to 1223.99
Based on AVERAGE one-day move over last 12 quarters: 1096.22 to 1208.78
Based on MAXIMUM one-day move over last 12 Q’s (11.8%): 1016.04 to 1288.96
Based on UP max only (+6.7%): 1230.18
Open to requests for other symbols.
#LongCalls On July 29th I bought $UUP Sept 20th 26 calls for .72. UUP price was 26.58 on that day. I forgot to close Friday so I was assigned, and I just sold the stock for 26.88.
So I had the direction right, but this thing only moves a few pennies in weeks, so profit of .16 on the trade.
#SPX1dte Sold to Open $SPX Sept 23rd 2930/2940-3035/3045 condors for .50, 10-pt wings, double size.
IV: 9.31%, SPX 3000
Expiring today: Sept 20th 2940/2960-3045/3065, sold yesterday for .75
Sept 20th 2895/2920-3050/3075, sold Monday for 2.45
GDP Thursday morning
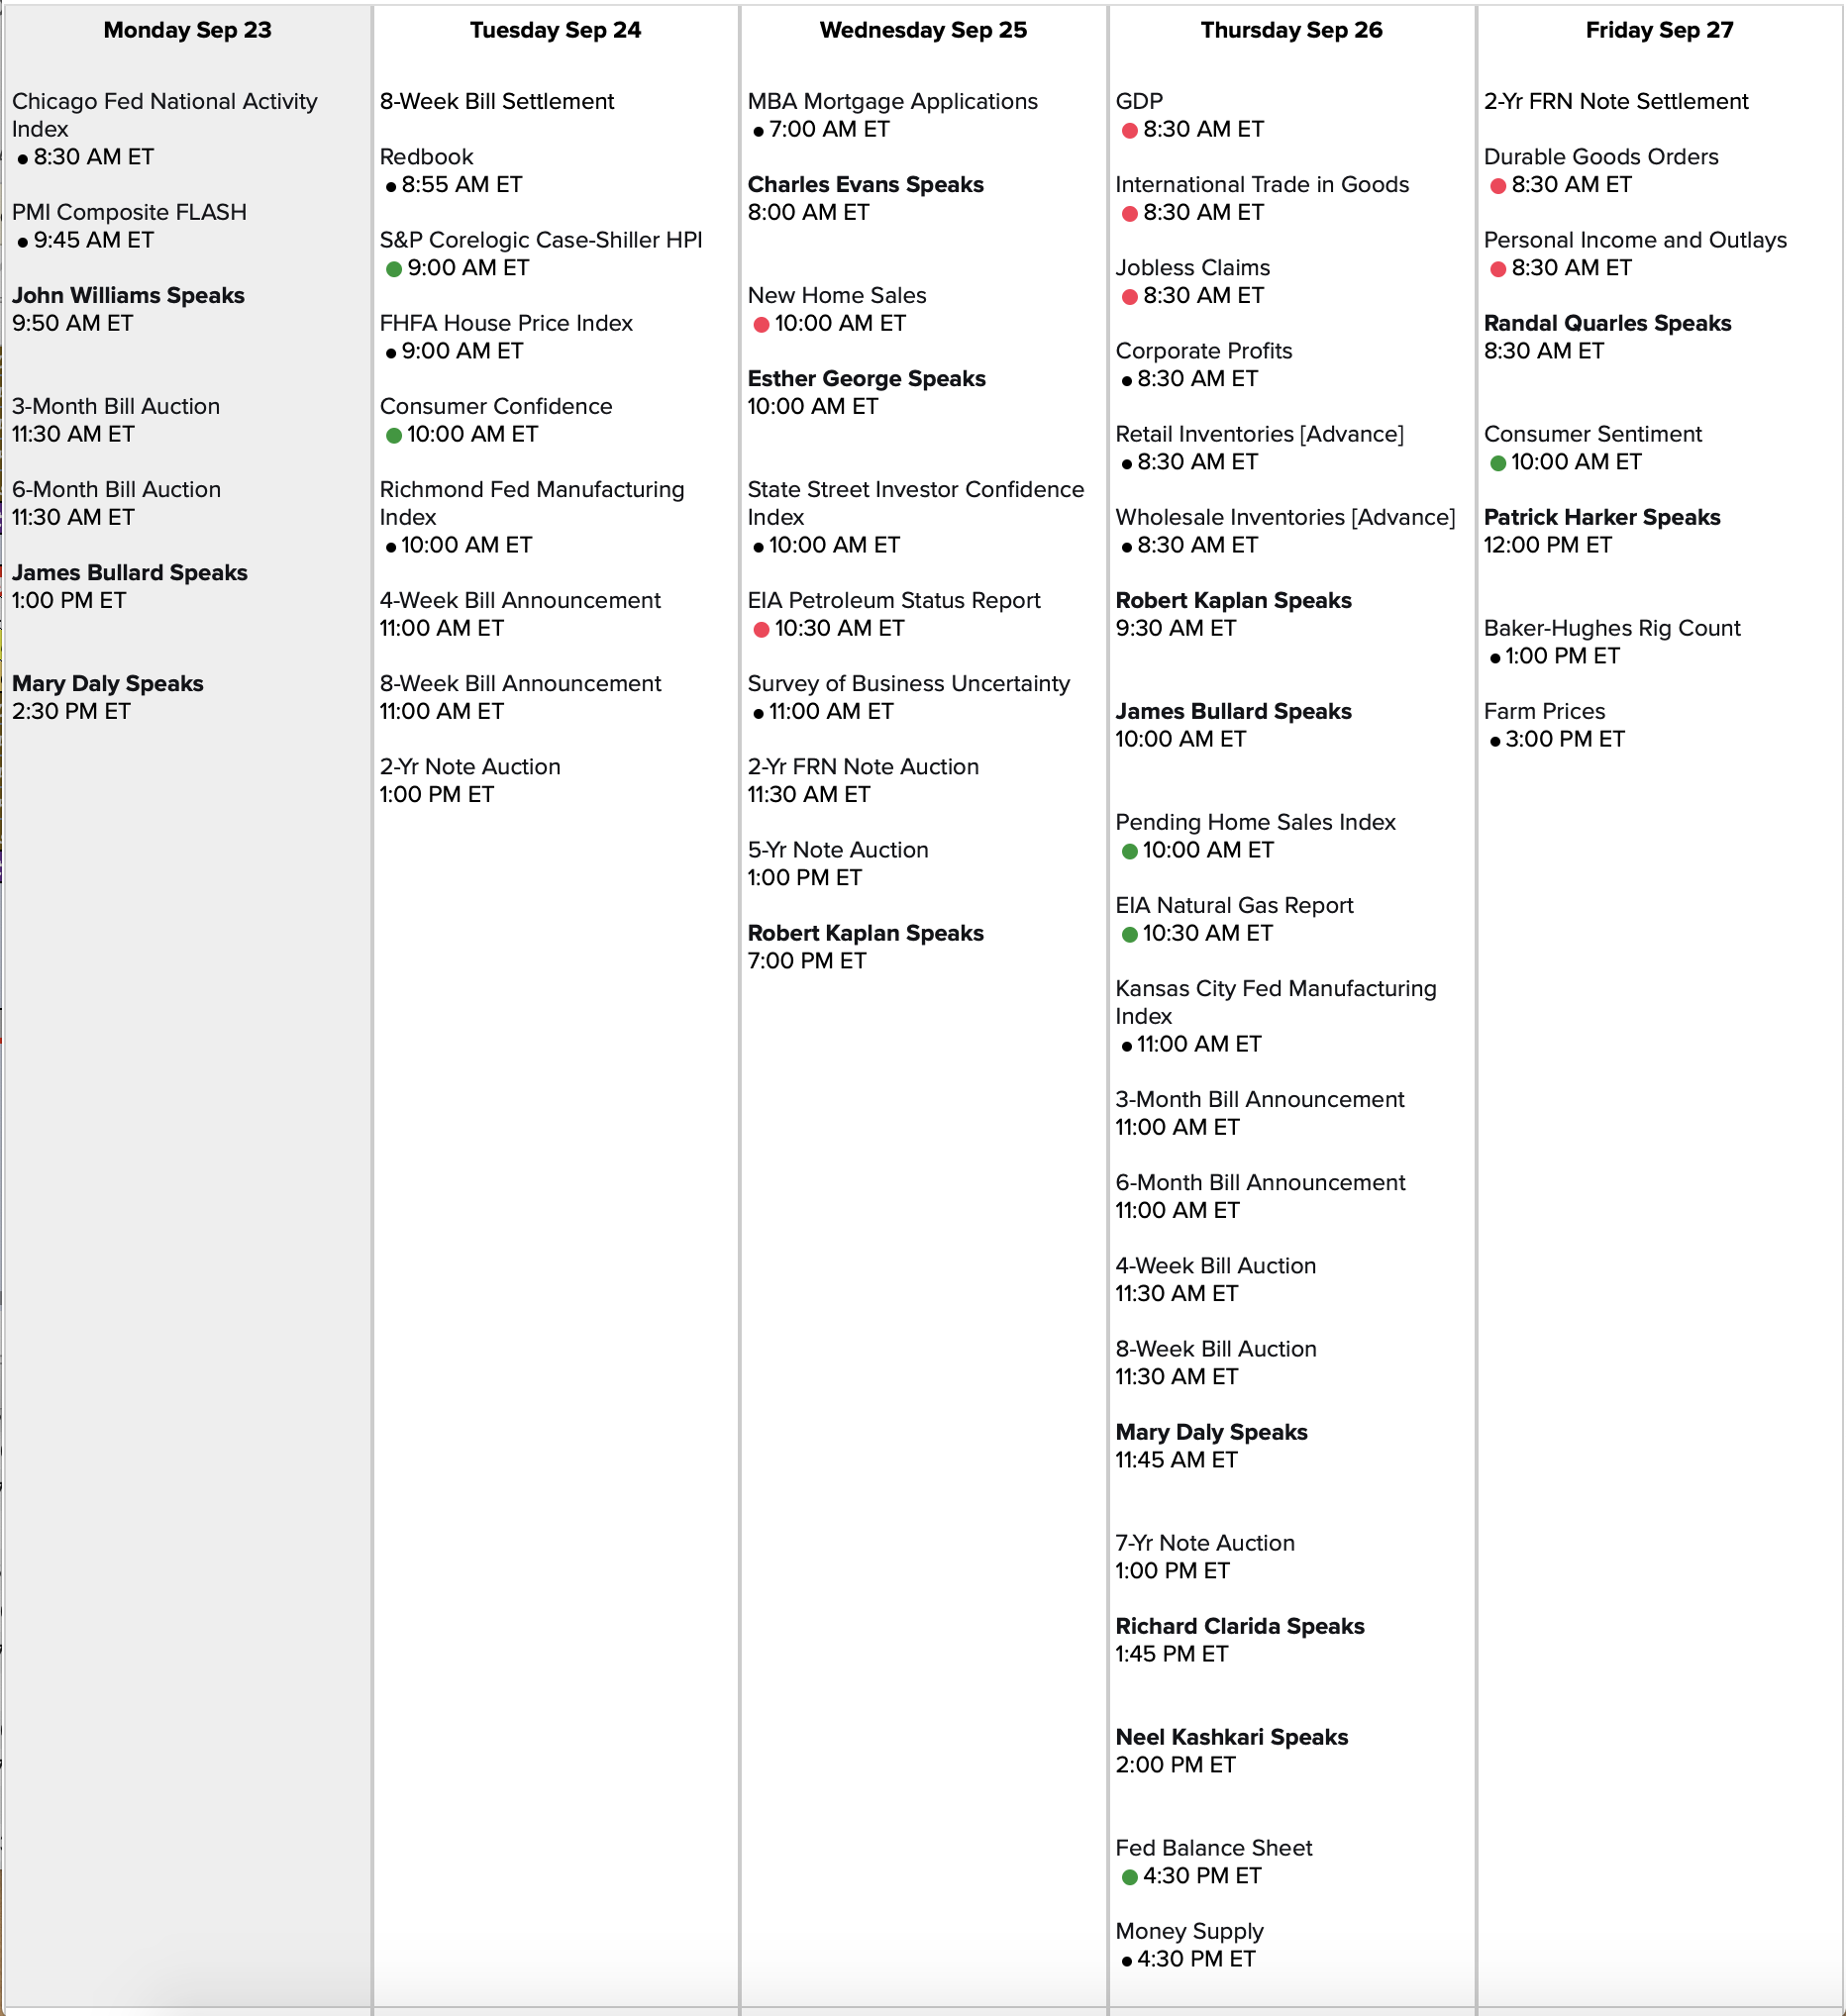

Link to calendar: https://us.econoday.com/byweek.asp?day=23&month=9&year=2019&cust=us&lid=0
#SPX1dte Using this Montana dip to add another long… 10 points lower and another day later than yesterday’s:
Bought to Open $SPX Sept 30th 3035/3050 call spreads for 2.50. SPX at 2994.
BREAKING: Stocks plunge as China delegation cancels trip to Montana to visit farms https://t.co/vOvPSFQvYq pic.twitter.com/KnnMbCfp8I
— CNBC Now (@CNBCnow) September 20, 2019
#VIXIndicator Look for higher prices over the next couple of weeks.
#SPX1dte #VIXIndicator As an Upside Warning is preparing to fire today (VIX close below 14.50), I’m doing this Risk Reversal for next Friday. I will add more to the long if we get a pullback tomorrow or Monday.
Bought to Open $SPX Sept 27th 3045/3060 bull call spreads for 2.40.
Sold to Open $SPX Sept 27th 3000/2975 put spreads for 5.80.
#SPX1dte Sold to Open $SPX Sept 20th 2940/2960-3045/3065 condors for .75, IV 12.64%, SPX 3011.
#Earnings. Sold to close $ADBE Sept 20th 282.5 #DoubleCalendar for 3.82. Bought yesterday for 1.89 (avg price).
#SPX1dte Sold to Open $SPX Sept 23rd 2915/2940-3050/3075 condors for 2.65, IV 12.90%, SPX 3005.
Expiring today: Sept 18th 2925/2945-3040/3060, sold yesterday for .85
Also, Sept 18th 3010/2985 expires, and based on closing SPX price of 3006.01, it will cash settle at a cost of 3.99. Sold it last Friday for 7.00. I expected a rally after the Fed, but it put me through the ringer first.
In honor of the late Ric Ocasek, I dedicate this song to myself, as this last-hour rally is just what I needed.
#PostEarnings Sold to Open $CHWY Oct 11th 28 puts for 1.50.
This is a recent IPO which, like UBER, hasn’t shown much volatility. It’s also a low-priced stock which minimizes the risk of these ATM puts.
#SPX1dte Sold to Open $SPX 2925/2945-3040/3060 condors for .85, IV 13.71%, SPX 2998. IV is up from recent series due to Fed announcement. Deltas are .06 and .05
#Earnings. Bought to Open $ADBE Sept20/Sept27 282.5 #DoubleCalendar for 1.83. Filled on TOS, I am having to bid higher on IB.
#Earnings $FDX reports tonight. Below are details on earnings one-day moves over the last 12 quarters.
June 25, 2019 AC +2.52%
March 19, 2019 AC -3.49%
Dec. 18, 2018 AC -12.16% Biggest DOWN
Sept. 17, 2018 AC -5.53%
June 19, 2018 AC -2.69%
March 20, 2018 AC -1.17%
Dec. 19, 2017 AC +3.51%
Sept. 19, 2017 AC +2.08%
June 20, 2017 AC +1.60%
March 21, 2017 AC +2.12%
Dec. 20, 2016 AC -3.33%
Sept. 20, 2016 AC +6.89% Biggest UP
Avg (+ or -) 3.92%
Bias -0.80%, negative bias on earnings.
With stock at 173.00 the data suggests these ranges:
Based on current IV (expected move into Friday per TOS): 163.29 to 182.71
Based on AVERAGE one-day move over last 12 quarters: 166.21 to 179.79
Based on MAXIMUM one-day move over last 12 Q’s (12.2%): 151.96 to 194.04
Based on UP max only (+6.9%): 184.92
Open to requests for other symbols.
#Earnings $ADBE reports tonight. Below are details on earnings one-day moves over the last 12 quarters.
June 18, 2019 AC +5.21%
March 14, 2019 AC -3.95%
Dec. 13, 2018 AC -7.28% Biggest DOWN
Sept. 13, 2018 AC +2.29%
June 14, 2018 AC -2.43%
March 15, 2018 AC +3.05%
Dec. 14, 2017 AC +1.43%
Sept. 19, 2017 AC -4.24%
June 20, 2017 AC +2.36%
March 16, 2017 AC +3.80%
Dec. 15, 2016 AC -1.47%
Sept. 20, 2016 AC +7.11% Biggest UP
Avg (+ or -) 3.72%
Bias 0.49%, positive bias on earnings.
With stock at 282.50 the data suggests these ranges:
Based on current IV (expected move into Friday per TOS): 268.04 to 296.96
Based on AVERAGE one-day move over last 12 quarters: 272.00 to 293.00
Based on MAXIMUM one-day move over last 12 Q’s (7.3%): 261.93 to 303.07
Based on UP max only (+7.1%): 302.59
Open to requests for other symbols.
#SPX1dte BTC $SPX Sept 16th 3000/2975 put spreads for 1.65. Sold Thursday for 3.00. Barely escaped alive.
Expiring: Sept 16th 2950/2960-3035/3045 condors, sold Friday for .45.
Looks like we missed the Upside Warning, so the clock resets and we need three consecutive closes below 14.50. But it could be a nutty week with the Fed Wednesday and oil volatility.
#SPX1dte Sold too Open $SPX Sept 20 (Friday PM) 2895/2920-3050/3075 condors for 2.45, IV 15.09%, SPX 2996.
#Earnings $AVGO Sept 13th 280/285-325/330 condors expired, sold yesterday for 1.02.
Have a good weekend all! Upside Warning hopefully will fire Monday… then will Fed really cut rates at all-time highs?
#SPX1dte. Sold to Open $SPX Sept 16th 2950/2960-3035/3045 condors for .45, IV 7.24%, SPX 3006.
Double-size, 10-wide.
Expiring today: Sept 13th 2970/2980-3040/3050, sold yesterday for .45.
#Earnings. Sold to close $RH Sept 13th 157.5 calls for 16.00. #LongStrangles bought for 14.833 (avg price) on Tuesday. Small profit this time, but even if first day is minor this one tends to follow through almost every quarter.
#Fed announcement Wed at 2pm ET
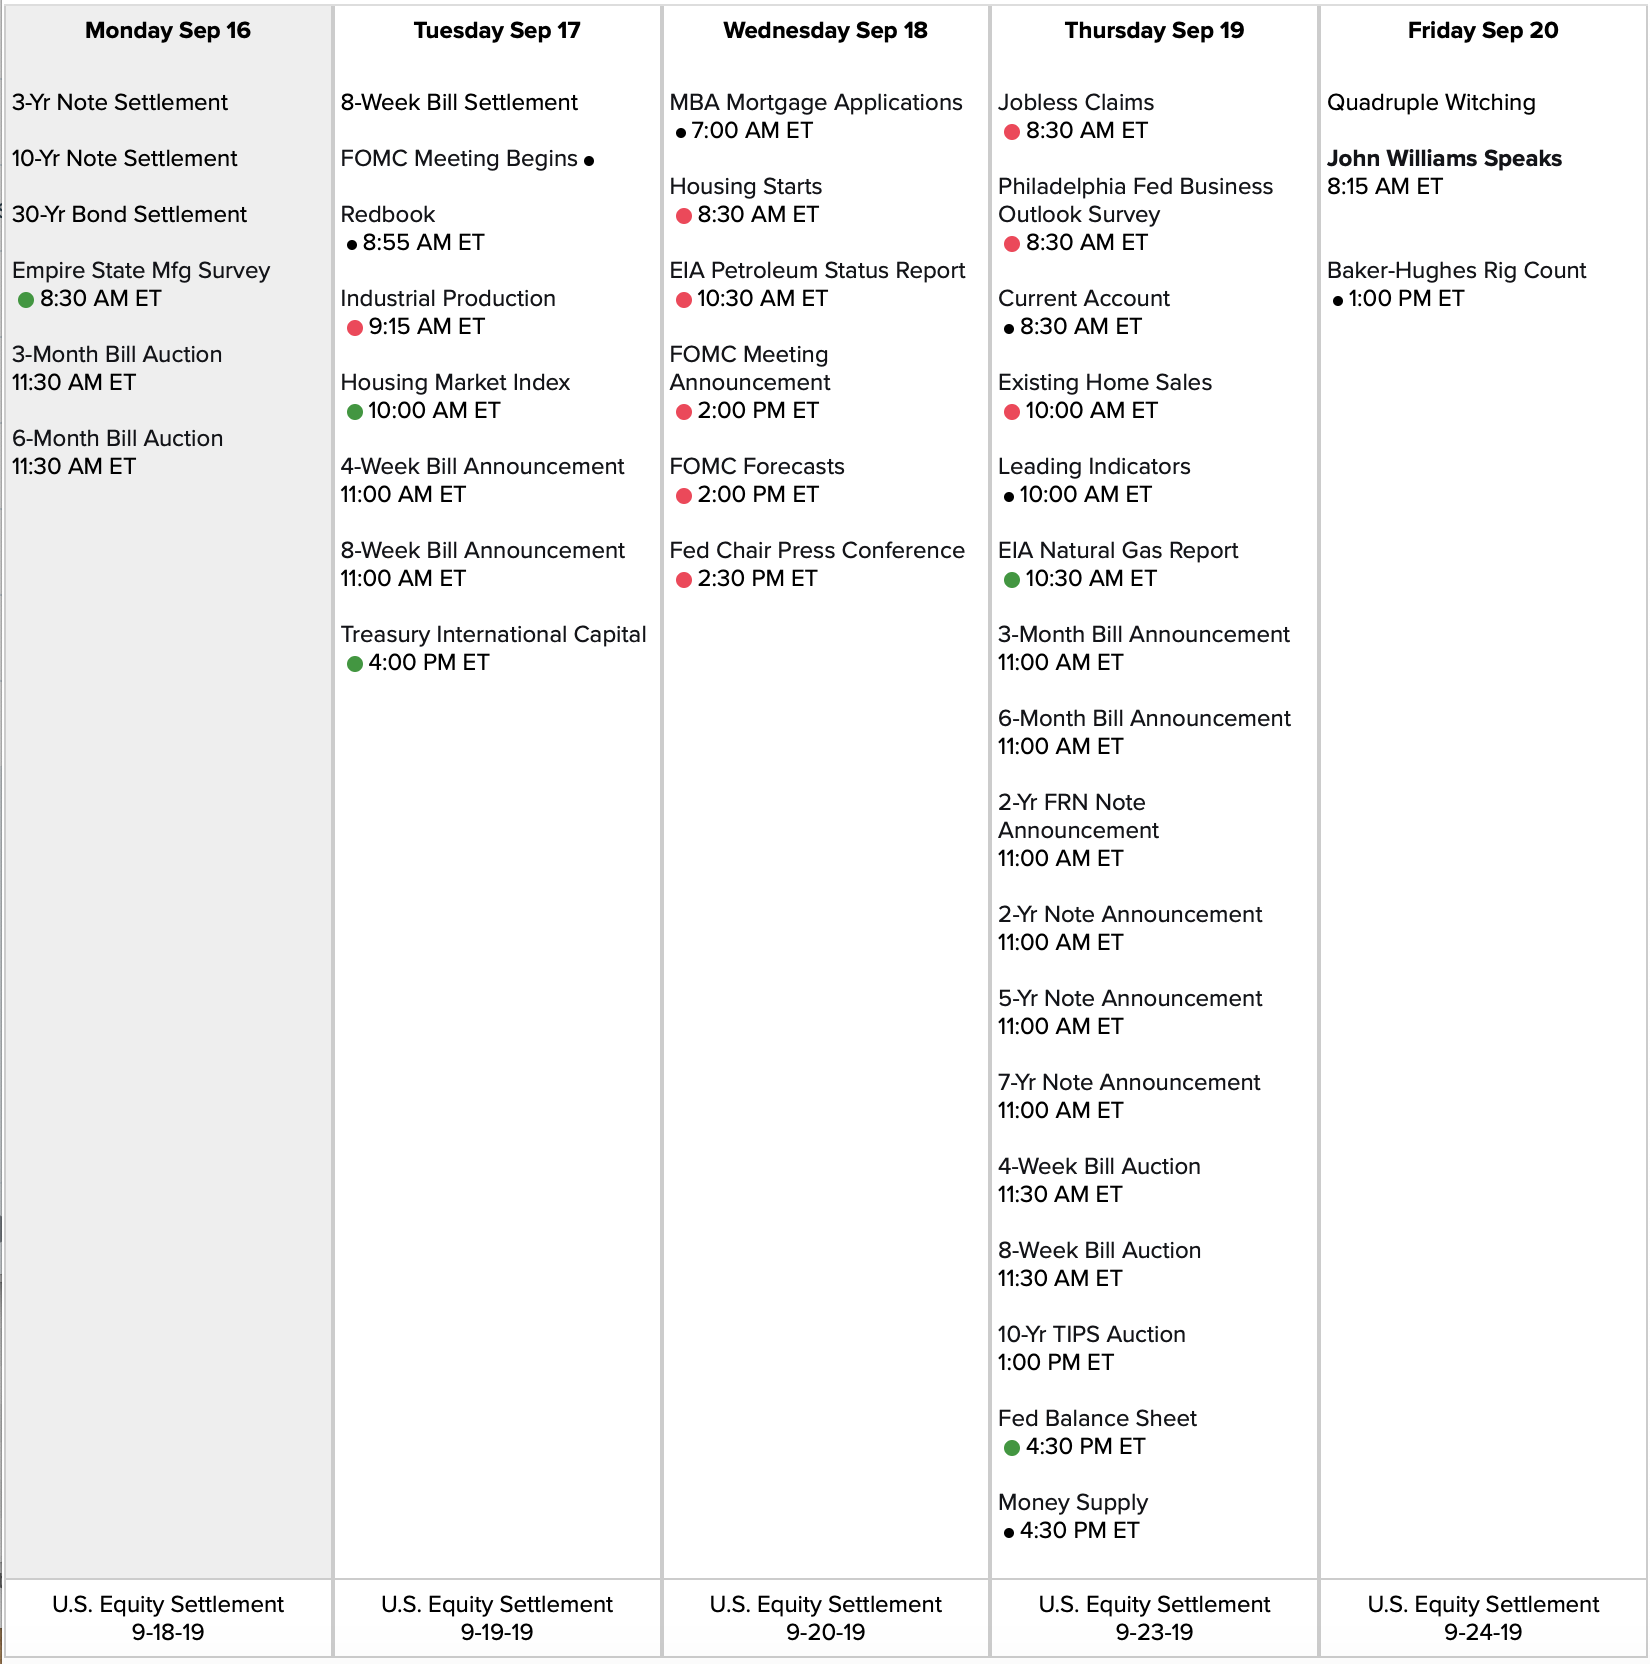
Link to calendar: https://us.econoday.com/byweek.asp?day=16&month=9&year=2019&cust=us&lid=0
#SPX1dte Sold to Open $SPX Sept 18th 3010/2985 put spreads for 7.00. In anticpation of new all-time highs.
#SPX1dte Sold to Open $SPX Sept 13th 2970/2980-3040/3050 condors for .45. Double-size position, 10-wide.
IV: 9.33%, SPX 3016
#SPX1dte BTC $SPX Sept 18th 3045/3070 call spreads for 3.50. Condors sold yesterday for 2.65. This didn’t quite reach my stop level, but I’m switching to cautiously bullish today given the Warning’s cancellation. Which also explains this spread:
Sold $SPX Sept 16th 3000/2975 put spreads for 3.00. I’ll add another one tomorrow. I’m going to hold off on short call spreads for now, except for the 1-dte condors.
#VIXIndicator The Downside Warning will most likely be canceled at today’s close. Two more consecutive days closing below 14.50 would mean an Upside Warning hitting at Monday’s close.
#Earnings Sold to Open $AVGO Sept 13th 280/285-325/350 condor for 1.02. Strikes are right around the max moves in each direction. I’m trying this despite the trouble on the June earnings report when it had its biggest down move. I was able to roll that one and get out with profit on the following week.
$RH update: Still holding out for some profit on my Long Strangle. Need to reach 173.50 to fill my order… almost got there this morning.
#Earnings $AVGO reports tonight. Below are details on earnings one-day moves over the last 12 quarters.
June 13, 2019 AC -5.56% Biggest DOWN
March 14, 2019 AC +8.23%
Dec. 6, 2018 AC +0.58%
Sept. 6, 2018 AC +7.69%
June 7, 2018 AC -2.53%
March 15, 2018 AC -4.81%
Dec. 6, 2017 AC 0.00%
Aug. 24, 2017 AC -3.70%
June 1, 2017 AC +8.49% Biggest UP
March 1, 2017 AC +0.99%
Dec. 8, 2016 AC +4.90%
Sept. 1, 2016 AC -2.24%
Avg (+ or -) 4.14%
Bias 1.00%, positive bias on earnings.
With stock at 300.00 the data suggests these ranges:
Based on current IV (expected move into Friday per TOS): 285.78 to 314.22
Based on AVERAGE one-day move over last 12 quarters: 287.57 to 312.43
Based on MAXIMUM one-day move over last 12 Q’s (8.5%): 274.53 to 325.47
Based on DOWN max only (-5.6%): 283.32
Open to requests for other symbols.
#SPX1dte BTC $SPX Sept 16th 3025/3050 call spreads for 3.60. Condors sold for 2.25 on Monday. My stop was hit at 3012, half the expected move to the 3025 strike.
https://www.cnbc.com/2019/09/11/oracle-releases-earnings-a-day-earlier-than-expected-stock-drops.html
#PerpetualRollingStrangles.
BTC $UBER Sept 13th 32.5/38 strangles for .15. Sold for 1.12 on 8/20.
STO $UBER Oct 4th 31/37 strangles for .90
#SPX1dte Sold $SPX Sept 18th 2885/2910-3045/3070 condors for 2.65, IV 12.53%, SPX 2991. Replaces the 7-dte I closed this morning. My approach on these is to sell one, with sort deltas at .10, on any day that I cannot sell a 1-dte. So normally, Mondays and Wednesdays. I stop if SPX comes within half of the expected move. So, on this one, expected move is 43.00, so I would stop if we got within 21.50 of either short strike. But that expected move will drop each day.
