
#SPX1dte Following the trend: Sold $SPX Oct 25th 2990/2965 put spreads for 3.45. Filled on the dip at the top of the hour.
Author Archives: Jeff
WHR earnings analysis
#Earnings $WHR reports tonight. Below are details on earnings one-day moves over the last 12 quarters.
July 22, 2019 BO +0.10%
April 22, 2019 AC +0.40%
Jan. 28, 2019 AC +9.66% Biggest UP
Oct. 24, 2018 AC +6.78%
July 23, 2018 AC -14.52% Biggest DOWN
April 23, 2018 AC +3.75%
Jan. 24, 2018 AC +2.30%
Oct. 23, 2017 AC -10.54%
July 26, 2017 AC -6.28%
April 25, 2017 BO +3.51%
Jan. 26, 2017 BO -8.54%
Oct. 25, 2016 BO -10.77%
Avg (+ or -) 6.43%
Bias -2.01%, negative bias on earnings.
With stock at 161.00 the data suggests these ranges:
Based on current IV (expected move into Friday per TOS): 151.16 to 170.84
Based on AVERAGE one-day move over last 12 quarters: 149.71 to 170.29
Based on MAXIMUM one-day move over last 12 Q’s (14.5%): 136.77 to 183.23
Based on UP max only (+9.7%): 175.46
Open to requests for other symbols.
SNAP earnings analysis
#Earnings $SNAP reports tonight. Below are details on earnings one-day moves over its entire history (10 quarters).
July 23, 2019 AC +18.74%
April 23, 2019 AC -6.08%
Feb. 5, 2019 AC +22.01%
Oct. 25, 2018 AC -10.15%
Aug. 7, 2018 AC -6.78%
May 1, 2018 AC -21.93% Biggest DOWN
Feb. 6, 2018 AC +47.58% Biggest UP
Nov. 7, 2017 AC -14.61%
Aug. 10, 2017 AC -14.08%
May 10, 2017 AC -21.45%
Avg (+ or -) 18.34%
Bias -0.68%, tiny negative bias on earnings.
With stock at 14.50 the data suggests these ranges:
Based on current IV (expected move into Friday per TOS): 12.16 to 16.84
Based on AVERAGE one-day move over last 12 quarters: 11.84 to 17.16
Based on MAXIMUM one-day move over last 12 Q’s (47.6%): 7.60 to 21.40
Based on DOWN max only (-21.9%): 11.32
Open to requests for other symbols.
Earnings Chart Update
$T (AT&T) reports Monday before the bell, not tomorrow.
IRBT earnings analysis
#Earnings $IRBT reports tonight. Below are details on earnings one-day moves over the last 12 quarters.
July 23, 2019 AC -16.86%
April 23, 2019 AC -23.09%
Feb. 6, 2019 AC +9.63%
Oct. 23, 2018 AC -12.33%
July 24, 2018 AC +16.99%
April 24, 2018 AC -3.41%
Feb. 7, 2018 AC -32.07% Biggest DOWN
Oct. 24, 2017 AC -13.48%
July 25, 2017 AC +21.14% Biggest UP
April 25, 2017 AC +15.73%
Feb. 8, 2017 AC -12.93%
Oct. 25, 2016 AC +11.35%
Avg (+ or -) 15.75%
Bias -3.28%%, negative bias on earnings.
With stock at 55.00 the data suggests these ranges:
Based on current IV (expected move into Friday per TOS): 46.28 to 63.72
Based on AVERAGE one-day move over last 12 quarters: 46.34 to 63.66
Based on MAXIMUM one-day move over last 12 Q’s (32.1%): 37.36 to 72.64
Based on UP max only (+21.1%): 66.63
Open to requests for other symbols.
SKX earnings analysis
#Earnings $SKX reports tonight. Below are details on earnings one-day moves over the last 12 quarters.
July 18, 2019 AC +11.96%
April 18, 2019 BO -10.43%
Feb. 7, 2019 AC +15.19%
Oct. 18, 2018 AC +13.78%
July 19, 2018 AC -20.99%
April 19, 2018 AC -27.04% Biggest DOWN
Feb. 8, 2018 AC +7.54%
Oct. 19, 2017 AC +41.44% Biggest UP
July 20, 2017 AC +0.67%
April 20, 2017 AC -2.56%
Feb. 9, 2017 AC +19.32%
Oct. 20, 2016 AC -17.26%
Avg (+ or -) 15.68%
Bias 2.64%, positive bias on earnings.
With stock at 37.50 the data suggests these ranges:
Based on current IV (expected move into Friday per TOS): 33.26 to 41.74
Based on AVERAGE one-day move over last 12 quarters: 31.74 to 43.54
Based on MAXIMUM one-day move over last 12 Q’s (41.4%): 22.04 to 53.24
Based on DOWN max only (-27.0%): 27.46
Open to requests for other symbols.
CMG earnings analysis
#Earnings $BIIB reports tonight. Below are details on earnings one-day moves over the last 12 quarters.
July 23, 2019 AC +5.18%
April 24, 2019 AC -4.46%
Feb. 6, 2019 AC +11.35%
Oct. 25, 2018 AC +3.42%
July 26, 2018 AC +5.71%
April 25, 2018 AC +24.44% Biggest UP
Feb. 6, 2018 AC -10.55%
Oct. 24, 2017 AC -14.58% Biggest DOWN
July 25, 2017 AC -2.30%
April 25, 2017 AC +2.38%
Feb. 2, 2017 AC -4.54%
Oct. 25, 2016 AC -9.28%
Avg (+ or -) 8.18%
Bias 0.56%, slight positive bias on earnings.
With stock at 850.00 the data suggests these ranges:
Based on current IV (expected move into Friday per TOS): 792.17 to 907.83
Based on AVERAGE one-day move over last 12 quarters: 780.45 to 919.55
Based on MAXIMUM one-day move over last 12 Q’s (24.4%): 642.26 to 1,057.74
Based on DOWN max only (-14.6%): 726.07
Open to requests for other symbols.
SPX expires
#SPX1dte Expiring today:
$SPX Oct 21st 2935/2955-3025/3040 condors, sold Friday for 1.20
$SPX Oct 21st 2975/2950, put spreads sold last Tuesday for 4.90.
I am flat SPX tonight.
BIIB earnings analysis and trade
#Earnings $BIIB reports tomorrow morning. Below are details on earnings one-day moves over the last 12 quarters.
July 23, 2019 BO +4.90% Biggest UP
April 24, 2019 BO -2.52%
Jan. 29, 2019 BO +1.35%
Oct. 23, 2018 BO +0.19%
July 24, 2018 BO +4.10%
April 24, 2018 BO +1.09%
Jan. 25, 2018 BO +2.08%
Oct. 24, 2017 BO -3.90% Biggest DOWN
July 25, 2017 BO -0.61%
April 25, 2017 BO +3.62%
Jan. 26, 2017 BO +2.06%
Oct. 26, 2016 AC -1.87%
Avg (+ or -) 2.36%
Bias 0.87%, positive bias on earnings.
With stock at 225.00 the data suggests these ranges:
Based on current IV (expected move into Friday per TOS): 212.84 to 237.16
Based on AVERAGE one-day move over last 12 quarters: 219.70 to 230.30
Based on MAXIMUM one-day move over last 12 Q’s (4.9%): 213.98 to 236.03
Based on DOWN max only (-3.9%): 216.23
Open to requests for other symbols.
There’s no high in TEAM
#Earnings Sold to close $TEAM Oct18/Oct25 122 #DoubleCalendar for 1.60. Bought yesterday for 1.34
The time to close this was at the open…. it unfortunately dropped most of the day, but then came back enough to give us a small profit.
SPX 1-dte
#SPX1dte Sold to Open $SPX Oct 21st 2935/2955-3025/3040 condors for 1.20, IV: 8.07%, SPX 2993.
Expiring worthless today: Oct 18th 2950/2960-3025/3035, sold yesterday for .45 (dbl size)
Stuff happening next week


Link to calendar: https://us.econoday.com/byweek.asp?day=21&month=10&year=2019&cust=us&lid=0
HON closed
#Earnings Sold to close $HON Oct18/Oct25 165 #DoubleCalendar for .96. Bought yesterday for .86, so I basically covered commissions. Now it has pulled back and better profit is available. But that’s three calendars in one day… one breakeven, one 50% winner, one double+.
SPX 1-dte
#SPX1dte Sold $SPX Oct 18th (Friday PM) 2950/2960-3025/3035 condors for .45. 10-wide, double size. IV 9.42%, SPX 2997.
MAN earnings analysis
#Earnings $MAN reports tomorrow morning. Below are details on earnings one-day moves over the last 12 quarters.
July 19, 2019 BO +0.03%
April 18, 2019 BO +11.60% Biggest UP
Jan. 31, 2019 BO +3.95%
Oct. 19, 2018 BO -3.77%
July 20, 2018 BO +0.52%
April 20, 2018 BO -14.48% Biggest DOWN
Feb. 2, 2018 BO -7.35%
Oct. 20, 2017 BO +0.04%
July 24, 2017 BO -8.96%
April 21, 2017 BO -2.89%
Jan. 31, 2017 BO +0.84%
Oct. 21, 2016 BO +9.71%
Avg (+ or -) 5.35%
Bias -0.90%, negative bias on earnings.
With stock at 85.50 the data suggests these ranges:
Based on current IV (expected move into Friday per TOS): 80.84 to 90.16
Based on AVERAGE one-day move over last 12 quarters: 80.93 to 90.07
Based on MAXIMUM one-day move over last 12 Q’s (14.5%): 73.12 to 97.88
Based on UP max only (+11.6%): 95.42
Open to requests for other symbols.
TEAM earnings analysis
#Earnings $TEAM reports tonight. Below are details on earnings one-day moves over the last 12 quarters.
July 25, 2019 AC +8.57%
April 17, 2019 AC -8.31%
Jan. 17, 2019 AC -2.42%
Oct. 18, 2018 AC -14.29% Biggest DOWN
July 26, 2018 AC +10.48%
April 19, 2018 AC -6.53%
Jan. 18, 2018 AC -4.55%
Oct. 19, 2017 AC +24.64% Biggest UP
July 27, 2017 AC -2.18%
April 27, 2017 AC +3.01%
Jan. 19, 2017 AC +2.22%
Oct. 27, 2016 AC -3.92%
Avg (+ or -) 7.59%
Bias 0.56%, slight positive bias on earnings.
With stock at 122.00 the data suggests these ranges:
Based on current IV (expected move into Friday per TOS): 112.00 to 132.00
Based on AVERAGE one-day move over last 12 quarters: 112.74 to 131.26
Based on MAXIMUM one-day move over last 12 Q’s (24.6%): 91.94 to 152.06
Based on DOWN max only (-14.3%): 104.57
Open to requests for other symbols.
URI closed
#Earnings . Sold to close $URI Oct18/Oct25 122p/123p #DoubleCalendar for 1.55. Possible to get over 2.00 now. Bought yesterday for .97 – 1.05.
NFLX dub cal closed
#Earnings Sold to close $NFLX Oct18/Oct25 285 #DoubleCalendar for 3.00. Bought yesterday for 1.37. You will be able to get more if price continued to drop toward the strike.
ISRG earnings analysis
#Earnings $ISRG reports tonight. Below are details on earnings one-day moves over the last 12 quarters.
July 18, 2019 AC -1.45%
April 18, 2019 AC -7.00% Biggest DOWN
Jan. 24, 2019 AC -3.93%
Oct. 18, 2018 AC -3.45%
July 19, 2018 AC -0.86%
April 17, 2018 AC +8.17% Biggest UP
Jan. 25, 2018 AC -2.12%
Oct. 19, 2017 AC +3.39%
July 20, 2017 AC -4.55%
April 18, 2017 AC +6.36%
Jan. 24, 2017 AC +5.09%
Oct. 18, 2016 AC -5.56%
Avg (+ or -) 4.33%
Bias -0.49%, slight negative bias on earnings.
With stock at 535.00 the data suggests these ranges:
Based on current IV (expected move into Friday per TOS): 512.55 to 557.45
Based on AVERAGE one-day move over last 12 quarters: 511.85 to 558.15
Based on MAXIMUM one-day move over last 12 Q’s (8.2%): 491.29 to 578.71
Based on DOWN max only (-7.0%): 497.55
Open to requests for other symbols.
Upside Warning
#VIXindicator An inside day on the VIX chart is the third close below 15.05 in a row, meaning an Upside Warning is in effect. Look for higher prices in the coming days. I’m proceeding cautiously after last month’s headfake. I only have one bullish trade (put spread sold this morning).
Expiring today: $SPX Oct 16th 2945/2955-3030/3040 condors sold yesterday for .45.
Bistro problems
I have experienced some issues in the past weeks with Options Bistro log in as well.
The first steps to follow are:
Close your browser.
Reopen it.
Go to wordpress.com
Log in.
Leave the window open and open a new browser window or tab
Go to OptionsBistro.com.
Refresh the page.
If that doesn’t work you’ll need to clear the browser cache. Follow these instructions.
https://en.support.wordpress.com/browser-issues/#clearing-your-browser-cache
Please reply in the comments here if any of the above resolves your issues.
HON earnings analysis
#Earnings $HON reports tomorrow morning. Below are details on earnings one-day moves over the last 12 quarters.
July 18, 2019 BO +3.11%
April 18, 2019 BO +3.78% Biggest UP (tie)
Feb. 1, 2019 BO +0.75%
Oct. 19, 2018 BO -1.10% Biggest DOWN (also the ONLY down)
July 20, 2018 BO +3.78% Biggest UP (tie)
April 20, 2018 BO +1.64%
Jan. 26, 2018 BO +1.94%
Oct. 20, 2017 BO +1.20%
July 21, 2017 BO +1.03%
April 21, 2017 BO +2.67%
Jan. 27, 2017 BO +0.38%
Oct. 21, 2016 BO +0.75%
Avg (+ or -) 1.84%
Bias 1.66%, strong positive bias on earnings.
With stock at 164.00 the data suggests these ranges:
Based on current IV (expected move into Friday per TOS): 158.36 to 169.64
Based on AVERAGE one-day move over last 12 quarters: 160.98 to 167.02
Based on MAXIMUM one-day move over last 12 Q’s (3.8%): 157.80 to 170.20
Based on DOWN max only (-1.1%): 162.20
Open to requests for other symbols.
URI dub cal
#Earnings Bought to Open $URI Oct18/Oct25 122p/123c #DoubleCalendar for 1.00. Not filled on all yet. Got one for .97 on TOS.
URI earnings analysis
#Earnings $URI reports tonight. Below are details on earnings one-day moves over the last 12 quarters.
July 17, 2019 AC -7.89%
April 17, 2019 AC +8.14%
Jan. 23, 2019 AC +6.29%
Oct. 17, 2018 AC -15.03% Biggest DOWN
July 18, 2018 AC +1.07%
April 18, 2018 AC -6.54%
Jan. 24, 2018 AC -1.94%
Oct. 18, 2017 AC +0.05%
July 19, 2017 AC +3.23%
April 19, 2017 AC -5.19%
Jan. 25, 2017 AC +11.20% Biggest UP
Oct. 19, 2016 AC +4.69%
Avg (+ or -) 5.94%
Bias -0.16%, no signoficant bias on earnings.
With stock at 123.00 the data suggests these ranges:
Based on current IV (expected move into Friday per TOS): 114.43 to 131.57
Based on AVERAGE one-day move over last 12 quarters: 115.70 to 130.30
Based on MAXIMUM one-day move over last 12 Q’s (15.0%): 104.51 to 141.49
Based on UP max only (+11.2%): 136.78
Open to requests for other symbols.
IBM earnings analysis
#Earnings $IBM reports tonight. Below are details on earnings one-day moves over the last 12 quarters.
July 17, 2019 AC +4.58%
April 16, 2019 AC -4.15%
Jan. 22, 2019 AC +8.46%
Oct. 16, 2018 AC -7.62% Biggest DOWN
July 18, 2018 AC +3.26%
April 17, 2018 AC -7.53%
Jan. 18, 2018 AC -3.99%
Oct. 17, 2017 AC +8.86% Biggest UP
July 18, 2017 AC -4.20%
April 18, 2017 AC -4.91%
Jan. 19, 2017 AC +2.24%
Oct. 17, 2016 AC -2.61%
Avg (+ or -) 5.20%
Bias -0.63%, slight negative bias on earnings.
With stock at 142.00 the data suggests these ranges:
Based on current IV (expected move into Friday per TOS): 135.06 to 148.94
Based on AVERAGE one-day move over last 12 quarters: 134.61 to 149.39
Based on MAXIMUM one-day move over last 12 Q’s (8.9%): 129.42 to 154.58
Based on DOWN max only (-7.6%): 131.18
Open to requests for other symbols.
SPX Monday
#SPX1dte Sold $SPX Oct 21st 2975/2950 put spreads for 4.90. IV: 11.44%, SPX 2990. Bullish positioning following both trend and #VIXindicator.
NFLX dub cal
#Earnings Bought to open $NFLX Oct18/Oct25 285 #DoubleCalendar for 1.37. This stock has typically been too volatile after earnings to be appropriate for this strategy. But two things: NFLX post-earnings moves have quieted in the last couple years, and the Dub-Cals perform well with higher priced stocks.
NFLX earnings analysis
#Earnings $NFLX reports tonight. Below are details on earnings one-day moves over the last 12 quarters.
July 17, 2019 AC -10.27% Biggest DOWN
April 16, 2019 AC -1.31%
Jan. 17, 2019 AC -3.98%
Oct. 16, 2018 AC +5.28%
July 16, 2018 AC -5.24%
April 16, 2018 AC +9.18%
Jan. 22, 2018 AC +9.97%
Oct. 16, 2017 AC -1.57%
July 17, 2017 AC +13.54%
April 17, 2017 AC -2.64%
Jan. 18, 2017 AC +3.86%
Oct. 17, 2016 AC +19.02% Biggest UP
Avg (+ or -) 7.16%
Bias 2.99%, positive bias on earnings.
With stock at 285.00 the data suggests these ranges:
Based on current IV (expected move into Friday per TOS): 257.13 to 312.87
Based on AVERAGE one-day move over last 12 quarters: 264.61 to 305.39
Based on MAXIMUM one-day move over last 12 Q’s (19.0%): 230.79 to 339.21
Based on DOWN max only (-10.3%): 255.73
Open to requests for other symbols.
Stuff this week
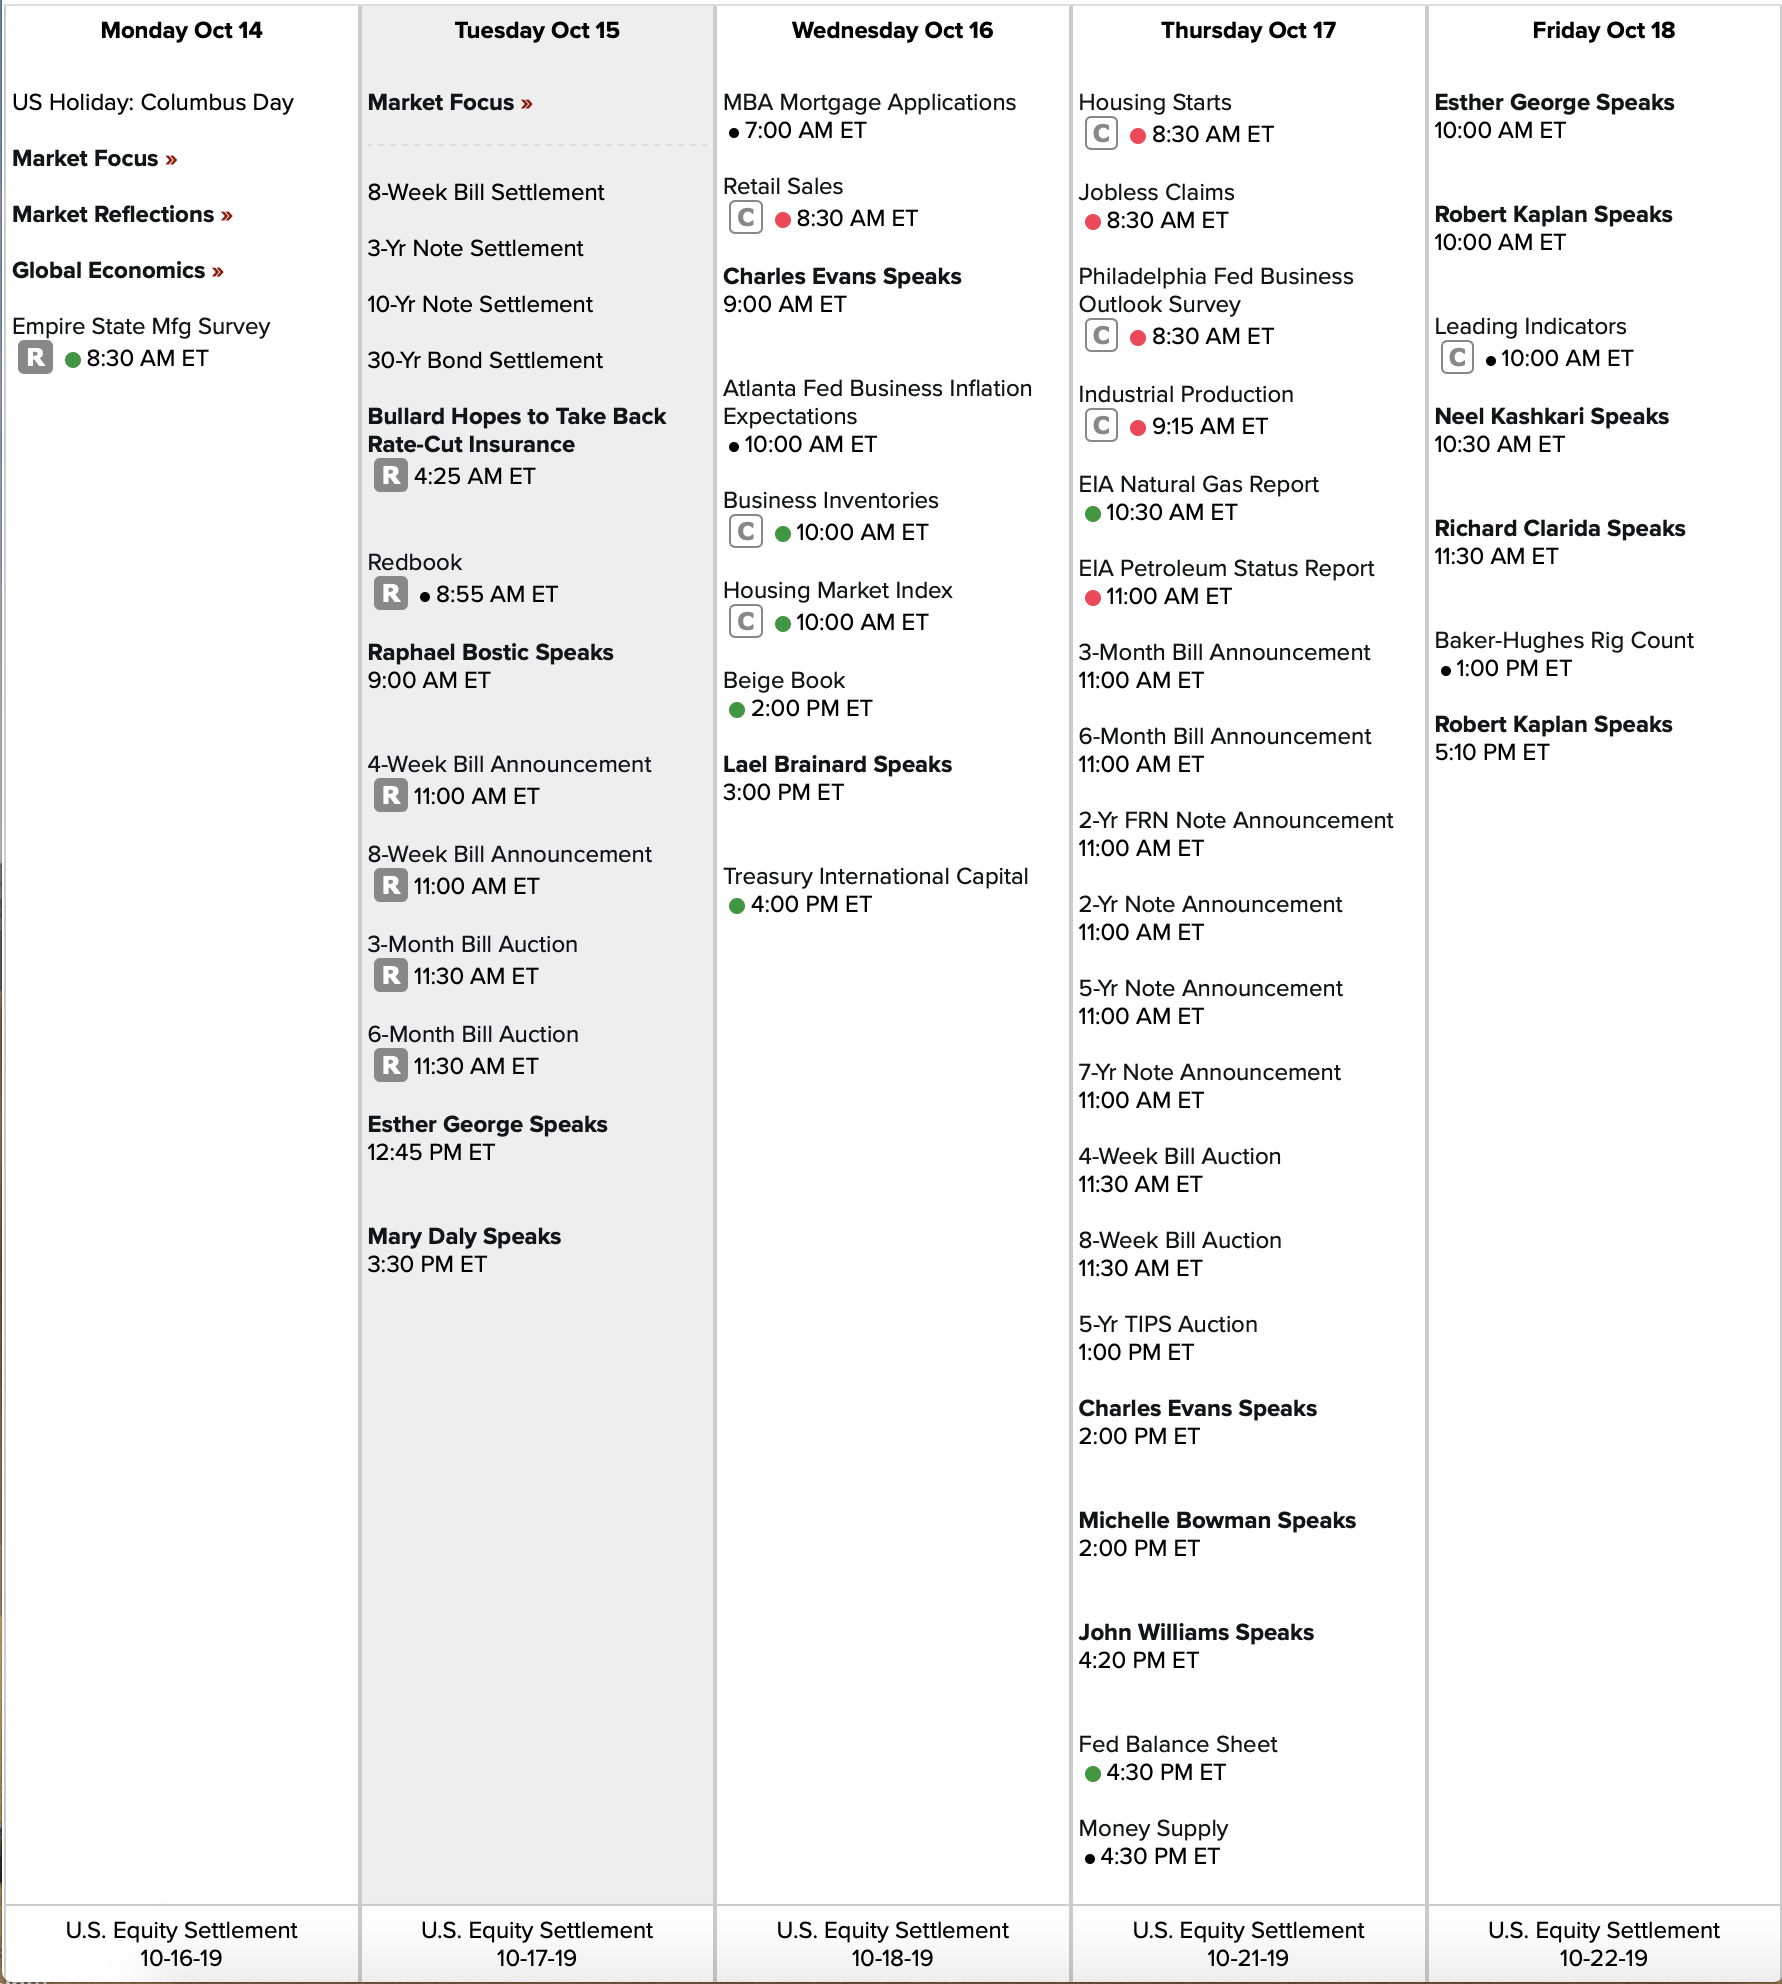
Link to calendar: https://us.econoday.com/byweek.asp?day=15&month=10&year=2019&cust=us&lid=0
SPX 1-dte
#SPX1dte Sold to Open $SPX Oct 16th 2945/2955-3030/3040 condors for .45. 10-wide, double size.
IV 10.34%, SPX 2998.
NUGT closed
#ContangoETFs BTC $NUGT Jan 2020 55 calls for .54. Sold for 3.20 on July 18th.
UAL earnings analysis
#Earnings $UAL reports tonight. Below are details on earnings one-day moves over the last 12 quarters.
July 16, 2019 AC +0.91%
April 16, 2019 AC +4.77%
Jan. 15, 2019 AC +6.35%
Oct. 16, 2018 AC +5.95%
July 17, 2018 AC +8.78% Biggest UP
April 17, 2018 AC +4.81%
Jan. 23, 2018 AC -11.44%
Oct. 18, 2017 AC -12.07% Biggest DOWN
July 18, 2017 AC -5.90%
April 17, 2017 AC -4.26%
Jan. 17, 2017 AC +0.35%
Oct. 17, 2016 BO -0.31%
Avg (+ or -) 5.49%
Bias -0.17%, no significant bias on earnings.
With stock at 87.50 the data suggests these ranges:
Based on current IV (expected move into Friday per TOS): 83.43 to 91.57
Based on AVERAGE one-day move over last 12 quarters: 82.69 to 92.31
Based on MAXIMUM one-day move over last 12 Q’s (12.1%): 76.94 to 98.06
Based on UP max only (+8.8%): 95.18
Open to requests for other symbols.
Downside Warning canceled
#VIX indicator Well, so much for that. The VIX close today cancels the Downside Warning and we may be on the way to another Upside Warning. Let’s hope the signals work on the next round.
GS earnings analysis
#Earnings $GS reports tomorrow morning. Below are details on earnings one-day moves over the last 12 quarters.
July 16, 2019 BO +1.86%
April 15, 2019 BO -3.81%
Jan. 16, 2019 BO +9.54% Biggest UP
Oct. 16, 2018 BO +3.01%
July 17, 2018 BO -0.18%
April 17, 2018 BO -1.64%
Jan. 17, 2018 BO -1.86%
Oct. 17, 2017 BO -2.60%
July 18, 2017 BO -2.59%
April 18, 2017 BO -4.71% Biggest DOWN
Jan. 18, 2017 BO -0.61%
Oct. 18, 2016 BO +2.14%
Avg (+ or -) 2.88%
Bias -0.12%, no significant bias on earnings.
With stock at 205.00 the data suggests these ranges:
Based on current IV (expected move into Friday per TOS): 198.11 to 211.89
Based on AVERAGE one-day move over last 12 quarters: 199.10 to 210.90
Based on MAXIMUM one-day move over last 12 Q’s (9.5%): 185.44 to 224.56
Based on DOWN max only (-4.7%): 195.34
I’m getting on a plane so won’t be able to do any others today; back tomorrow. Happy trading!
SPX out
#SPX1dte Stopped: BTC $SPX Oct 11th 2290/3010 call spreads for 5.20. Condors sold yesterday for 1.35.
Stopped: BTC $SPX Oct 14th 2985/3010 call spreads for 11.00. Condors sold Wednesday for 3.15.
I’m taking a break. I’ve been absolutely slaughtered since the beginning of August. It has been a combination of mistakes, two signals in a row not working, and a completely unpredictable news-driven market. I cannot put on another trade today. I’ll still be here every day, and will resume the low-risk earnings trades next week, and the 1-day spreads once things calm down.
SPX too volatile
#SPX1dte I didn’t get what I wanted today and it’s just too risky to hold in this news-driven market with trade talks continuing into tomorrow. I think the most likely scenario is some partial deal that everyone gets excited about and the algos drive us higher, followed by a dump next week. But it’s just too uncertain (and ridiculous) to have on the risk.
BTC $SPX Oct 14th 2950/2975 call spreads for 9.55. Sold yesterday for 7.00.
SPX 1-dte
#SPX1dte Sold to Open $SPX Oct 11th 2835/2855-2990/3010 condors for 1.35, IV 21.30%, SPX 2934.
High IV, lots of news expected.
Algos run our lives
BREAKING: Stocks jump after Trump tweets he will meet with China's Vice Premier at the White House tomorrow on trade amid reports of little trade talk progress https://t.co/ivEB35OTNo pic.twitter.com/XPRhnix73y
— CNBC Now (@CNBCnow) October 10, 2019
SPX Monday
#SPX1dte Sold to Open $SPX Oct 14th 2800/2825-2985/3010 condors for 3.15, IV: 17.01%, SPX close: 2919.
Sold a couple minutes after the closing bell.
Nuts
#Market So we opened the day higher due to reports that “China is open to a partial US trade deal.”
Now this:
BREAKING: Stocks pull back by about 90 points after Reuters reports that Beijing has lowered expectations for trade talks this week. https://t.co/pWxu4hGRlD pic.twitter.com/Y7lXpOS9yM
— CNBC Now (@CNBCnow) October 9, 2019
SPX aggressive
#SPX1dte I am considering the Downside Warning and general market weakness. I look at the daily chart and see resistance at 2950 for most of August. I’ve been burned on some of these aggressive spreads recently so I’ll keep a tight leash on it. The biggest risk is, of course, news or a tweet.
Sold to Open $SPX Oct 14th 2950/2975 call spreads for 7.00.
DAL earnings analysis
#Earnings $DAL reports tomorrow morning. Below are details on earnings one-day moves over the last 12 quarters.
July 11, 2019 BO +1.16%
April 10, 2019 BO +1.59%
Jan. 15, 2019 BO +0.16%
Oct. 11, 2018 BO +3.56%
July 12, 2018 BO +1.78%
April 12, 2018 BO +2.93%
Jan. 11, 2018 BO +4.76% Biggest UP
Oct. 11, 2017 BO +0.70%
July 13, 2017 BO -1.76% Biggest DOWN
April 12, 2017 BO -0.52%
Jan. 12, 2017 BO -1.06%
Oct. 13, 2016 BO +1.88%
Avg (+ or -) 1.82%
Bias 1.27%, positive bias on earnings.
With stock at 54.00 the data suggests these ranges:
Based on current IV (expected move into Friday per TOS): 51.16 to 56.84
Based on AVERAGE one-day move over last 12 quarters: 53.02 to 54.98
Based on MAXIMUM one-day move over last 12 Q’s (4.8%): 51.43 to 56.57
Based on DOWN max only (-1.8%): 53.05
Open to requests for other symbols.
DPZ closed
#Earnings Sold to close $DPZ Oct11/Oct18 242.5 #DoubleCalendar for 2.05. Bought Tuesday for 1.05. Only got filled on a 1-lot; should have forced the issue!
SPX 1-dte
#SPX1dte Sold $SPX Oct 9th 2830/2850-2955/2975 condors for 1.15, IV 16.66%, SPX 2906.
SPX 4-dte stopped
#SPX1dte . Looks like the Downside Warning may come through. BTC $SPX Oct 11th 2855/2830 put spreads for 4.00. Condors sold yesterday for 3.00. Stop breached when SPX went below 2905. Perhaps it found support at 2900, but it looks like we could be going lower so getting out while it’s cheap.
DPZ earnings analysis
#Earnings $DPZ reports tonight. Below are details on earnings one-day moves over the last 12 quarters.
July 16, 2019 BO -8.66%
April 24, 2019 BO +4.89%
Feb. 21, 2019 BO -9.14%
Oct. 16, 2018 BO -4.87%
July 19, 2018 BO -2.44%
April 26, 2018 BO +7.31% Biggest UP
Feb. 20, 2018 BO +0.33%
Oct. 12, 2017 BO -3.73%
July 25, 2017 BO -10.08% Biggest DOWN
April 27, 2017 BO +2.53%
Feb. 28, 2017 BO +2.36%
Oct. 18, 2016 BO +4.89%
Avg (+ or -) 5.10%
Bias -1.38%, negative bias on earnings.
With stock at 242.50 the data suggests these ranges:
Based on current IV (expected move into Friday per TOS): 225.42 to 259.58
Based on AVERAGE one-day move over last 12 quarters: 230.13 to 254.87
Based on MAXIMUM one-day move over last 12 Q’s (10.1%): 218.06 to 266.94
Based on UP max only (+7.3%): 260.23
Open to requests for other symbols.
SPX 4-dte
#SPX1dte Sold to Open $SPX Oct 11th 2830/2855-3005/3030 condors for 3.00, IV17.92%, SPX 2945.
SPX 1-dte
#SPX1dte BTC $SPX Oct 7th 2885 puts for .05. Taking off downside risk, allowing remainder of condor to expire (sold Friday for 1.00)
SPX 1-dte
#SPX1dte Sold to Open $SPX Oct 7th 2865/2885-2980/3000 condors for 1.00, IV: 9.92%, SPX 2943.
Expiring today (hopefully): 2820/2840-2950/2970 condors, sold yesterday for 1.20.
SPX Monday call spread closed
#SPX1dte . BTC $SPX Oct 7th 2960/2985 call spread for 1.95. Condors sold for 2.85 on Wednesday. It came within expected move today. The #VIXIndicator is getting whipsawed this time around. It will suck two get to false signals in a row, but it is shaping up that way right now. Next week will give us the answers.
COST closed
#Earnings . Sold to close $COST Oct04/Oct11 285 #DoubleCalendar for 4.00. Bought yesterday for 2.00.
I thought I was asking too much to start at 4.00, but it filled at the bell. Could have gotten more.
September Jobs Report
#Jobs — 50-year low in unemployment rate
+136,000 non-farm payroll jobs, vs. 145K expected
Unemployment at 3.5%, lowest since 1969
U6 unemployment at 6.9%, down by 0.3
Wages unchanged, 2.9% year over year
Labor force participation 63.2%, unchanged
August revised up from 130K to 168K
July revised up from 159K to 166K
SPX 1-dte
#SPX1dte Sold to Open $SPX Oct 4th 2820/2840-2950/2970 condors for 1.20, IV: 17.18%, SPX 2904.
COST dub cal
#Earnings Bought to Open $COST Oct04/Oct11 285 #DoubleCalendar for 2.00. Order was put in hours ago, took awhile to fill.
Non-Manufacturing, too?
September #ISM non-manufacturing index fell 3.8 points to 52.6 (lowest since August 2016 & well below even most pessimistic forecast in Bloomberg survey); growth in orders/business activity plunged & employment registered weakest print in more than 5y
— Liz Ann Sonders (@LizAnnSonders) October 3, 2019
COST earnings analysis
#Earnings $COST reports tonight. Below are details on earnings one-day moves over the last 12 quarters.
May 30, 2019 AC -0.81%
March 7, 2019 AC +5.08% Biggest UP
Dec. 13, 2018 AC -8.58% Biggest DOWN
Oct. 4, 2018 AC -5.55%
May 31, 2018 AC -0.55%
March 7, 2018 AC -0.89%
Dec. 14, 2017 AC +3.32%
Oct. 5, 2017 AC -5.97%
May 25, 2017 AC +1.79%
March 2, 2017 AC -4.33%
Dec. 7, 2016 AC +2.43%
Sept. 29, 2016 AC +3.40%
Avg (+ or -) 3.56%
Bias -0.89%, negative bias on earnings.
With stock at 285.00 the data suggests these ranges:
Based on current IV (expected move into Friday per TOS): 272.00 to 298.00
Based on AVERAGE one-day move over last 12 quarters: 274.86 to 295.14
Based on MAXIMUM one-day move over last 12 Q’s (-8.6%): 260.55 to 309.45
Based on DOWN max only (+5.1%): 299.48
Open to requests for other symbols.
Downside Warning in effect
#VIXIndicator So after the failure of the Upside, we entered a Downside at today’s close. This signal usually means the market goes lower over the coming days.
SPX Monday
#SPX1dte Sold to Open $SPX Oct 7th 2780/2805-2960/2985 condors for 2.80, IV 17.29%, SPX 2889. Using expected move to down side as stop; half expected move to upside.
UBER puts stopped
#PerpetualRollingStrangles BTC $UBER Oct 4th 31 puts for 2.35. Calls previously closed for .05. Strangles sold for .90 on 9/11. This strategy has worked well on UBER, but will wait a few days before starting a new one. My naked puts on $CHWY have NOT worked; underwater. The Upside Warning had me overly confident on both of these.
SPX 1-dte stopped
#SPX1dte Stop level was breached quickly this morning. BTC $SPX Oct 2nd 2890/2870 put spreads for 2.95. Condors sold yesterday for .867.Also having to close the Oct 4th spread. Stop was not breached yesterday but it was on the opening tick this morning.
Upside Warning canceled
#VIXindicator It seemed obvious days ago but it was just officially canceled. This is only the third total failure of the signal since 1999, out of 44 total, where the SPX made no new high after the signal fired, other than a brief intraday spike the very next day.
Schwab at zero
Okay who is with Schwab and can you find out how much SPX option commissions will be?
SPX 1-dte
#SPX1dte Sold to Open $SPX Oct 2nd 2870/2890-2980/3000 condors for .867, IV 13.55%, SPX 2946.
ISM disappoints
US manufacturing economy contracts to worst level in a decade
https://tradingeconomics.com/united-states/business-confidence
SPX 4-dte
#SPX1dte . Sold to Open $SPX Oct 4th 2880/2905-3030/3055 condors for 2.40, IV: 14.37%, SPX 2981.
Expiring today: Sept 30th 2865/2885-3000/3020 condors, sold Friday for 1.10
SPX 1-dte
#SPX1dte Sold $SPX Sept 30th 2865/2885-3000/3025 condors for 1.10, IV 12.31%, SPX 2956.
SPX 1-dte stopped
#SPX1dte. Bought to close $SPX Sept 27th 2935/2915 put spreads for .75. Condors sold yesterday for .95.
Closing Monday’s spread as well, and stuck with almost full loss on today’s spread.
SPX 1-dte
#SPX1dte Sold to Open $SPX Sept 27th 2915/2935-34010/3030 condors for .95, IV: 11.80%, SPX 2980.
MU earnings analysis
#Earnings $MU reports tonight. Below are details on earnings one-day moves over the last 12 quarters.
June 25, 2019 AC +13.34% Biggest UP
March 20, 2019 AC +9.61%
Dec. 18, 2018 AC -7.91%
Sept. 20, 2018 AC -2.86%
June 20, 2018 AC +0.83%
March 22, 2018 AC -7.99% Biggest DOWN
Dec. 19, 2017 AC +4.02%
Sept. 26, 2017 AC +8.51%
June 29, 2017 AC -5.11%
March 23, 2017 AC +7.40%
Dec. 21, 2016 AC +12.68%
Oct. 4, 2016 AC -0.56%
Avg (+ or -) 6.74%
Bias 2.66%, positive bias on earnings.
With stock at 49.00 the data suggests these ranges:
Based on current IV (expected move into Friday per TOS): 45.62 to 52.38
Based on AVERAGE one-day move over last 12 quarters: 45.70 to 52.30
Based on MAXIMUM one-day move over last 12 Q’s (13.3%): 42.46 to 55.54
Based on DOWN max only (-8.0%): 45.08
Open to requests for other symbols.
SPX Monday spread
#SPX1dte Sold to Open $SPX Sep 30th 2895/2920-3030/3055 condors for 2.30, IV 11.97%, SPX 2986.
Expiring today: Sep 25th 2890/2910-3005/3025 condors, sold yesterday for .90.
SPX 1-dte
#SPX1dte Sold to Open $SPX Sept 25th 2890/2910-3005/3025 condors for .90, IV: 14.73%, SPX 2965.
SPX slap
#SPX1dte. I had an order in to close this for .95 this morning. It got down to about 1.20 before the drop happened.
BTC $SPX Sep 25th 2980/2955 put spreads for 9.85. Sold for 3.00 yesterday.
Sitting on the Sept 27th 3000/2975 put spread, sold for 5.00 last week. I’m giving that some more time. If formal impeachment inquiries are announced today, I think there’s a chance the market effect will be temporary, as the process will take months, and who really knows how it would effect the economy? But certainly, I’m done with the aggressive put spreads for now.
NKE earnings analysis
#Earnings $NKE reports tomorrow morning. Below are details on earnings one-day moves over the last 12 quarters.
June 27, 2019 AC +0.34%
March 21, 2019 AC -6.61%
Dec. 20, 2018 AC +7.16%
Sept. 25, 2018 AC -1.28%
June 28, 2018 AC +11.12% Biggest UP
March 22, 2018 AC +0.32%
Dec. 21, 2017 AC -2.28%
Sept. 26, 2017 AC -1.91%
June 29, 2017 AC +10.96%
March 21, 2017 AC -7.05% Biggest DOWN
Dec. 20, 2016 AC +0.98%
Sept. 27, 2016 AC -3.77%
Avg (+ or -) 4.48%
Bias 0.67%, small positive bias on earnings.
With stock at 87.25 the data suggests these ranges:
Based on current IV (expected move into Friday per TOS): 82.82 to 91.68
Based on AVERAGE one-day move over last 12 quarters: 83.34 to 91.16
Based on MAXIMUM one-day move over last 12 Q’s (11.1%): 77.55 to 96.95
Based on DOWN max only (-7.1%): 81.10
Open to requests for other symbols.
Heavy news day
Stocks jump from session lows after Trump says transcript of his call with the Ukraine president will be released tomorrowhttps://t.co/AQCPR2cshs pic.twitter.com/ruqqTAElER
— CNBC Now (@CNBCnow) September 24, 2019
No Upside
#VIXIndicator. This Upside Warning looks to be a dud. After it fired on Thursday’s close, we only got a 0.3% intraday bump on Friday, then it’s been all lower. There’s never been a pullback this strong on an Upside Warning that ended up bouncing and coming through. This is the 43rd UpW since I started tracking in 2000, but only the fourth to not register any significant higher price after firing.

