
#VIXIndicator — Downside warning is in effect.
That was quick.
Tag Archives: VIXIndicator
Downside Signal fired
#SPXcampaign #VIXIndicator It is a rare occurrence for a new downside signal to fire so soon after a previous Warning was canceled, but it just happened today. If VIX reaches 13.26, we’ll have a full-fledged Downside Warning.
Downside Warning officially over
#VIXIndicator closed below the Fib 78.6% line, so the warning is over. Likely more upside in the coming days. Two more consecutive days below 10.65 will mean an Upside Warning.
VIX dropping
#SPXcampaign #VIXINdicator With the VIX breaking below its intraday consolidation and SPX shooting higher, I’m beginning the process of reversing my SPX campaign positions from short to long. The Downside signal will not officially be over until a close below 10.65, but today it’s certainly looking to be headed there.

VIX dropping
#VIXIndicator #Market The VIX topped at 17.28 a few hours ago but is now dropping on lower than expected inflation numbers. Looks like indices will open flat or positive.
To me it looks like an opportunity to short, but this market has been killing the dreams of bears for years.
Downside Warning has fired
#VIXindicator A second signal fired when the VIX opened about 13.26, which is 50% above the VIX low of 7/26. This means we have a Warning into effect, with the possibility of further downside in the coming days or weeks.
Downside signal fired
#VIXIndicator A downside signal has fired in the pre-markets, with VIX passing 12.41. This cancels the Upside Warning, and puts us on notice that more downside is possible. If the VIX hits 13.26, that would be a full-fledged Warning.
For those trading #VXXGame, be careful if you are carrying multiple short volatility positions. Take profits early; don’t always wait for expiration!
#vixindicator Jeff at what point…
How low can you go?
#VIXIndicator
Friday’s close of 9.36 was the lowest since Dec 1993; the second lowest close in VIX history.
Before this summer, the VIX had closed below 10 only 9 times. And it had never happened outside the months of November, December, and January.
Friday’s intraday low of 9.30 is the 4th lowest reading ever; the lowest since, again, Dec 1993.
The direction is UP
#VIXindicator… firing an Upside Warning today, means higher SPX prices or at least no downside for the next several days at least.
#SPXcampaign Sold $SPX July 17th 2450/2425 put spreads for 3.10. Expires Monday
SPX trades
#SPXcampaign #VIXIndicator The bears tried this morning but couldn’t turn the tide… provided nothing drives us lower overnight I expect and Upside Warning tomorrow, testing all-time highs tomorrow and ending the week at or above 2450. Starting to take aggressive actions…
Sold to Open $SPX July 20th 2450/2425 put spreads for 6.80. This creates an iron butterfly at 2450, since I have the 2450/2475 call spread. Perhaps we can get a pin at 2450 for the monthly series?
Sold to Open Aug 11th 2375/2350 puts spreads for 1.65.
Sold to Open Aug 11th 2495/2520 call spreads for 1.60.
Looking at options for a couple other threatened call spreads.
SPX Chart and VIX Indicator have been updated
#VIXIndicator The Downside Warning was canceled today with a VIX close below the 78.6% Fib line. If we get two more consecutive closes below 10.61, it will fire an Upside Warning.
SPX Chart and VIX Indicator have been updated
#VIXIndicator With the late day pullback the VIX remained above the 78.6% Fib line, meaning the Downside Warning remains in effect.
SPX Chart and VIX Indicator have been updated
#VIXIndicator Thursday’s Warning still looks like a possible head fake, but the VIX stayed above the cancellation level today which leaves the possibility of volatility next week.
Downside Warning fired
#VIXIndicator Look for further weakness in the market in coming days or weeks.
Downside Signal fired
#VIXIndicator VIX has breached 12.54, which is 25% above last night’s close. That fires a downside signal, and cancels upside warning. Next level is 14.06, which would fire a Downside Warning.
VIX ticking steadily higher
#VIXIndicator We just passed 12.00 and could hit the 12.54 level, which would be a first signal and end the Upside Warning.
Upside Warning comes through again
#VIXIndicator Here we go with the second surge of this Upside Warning, and a day after my long call spread expired, of course. Once again I did not put enough conviction in it, since I failed to put a new long call spread on during yesterday’s lows. I will get the timing and expiration date right someday!
Upside Warning in effect
The #VIXindicator has been updated. Accordingly, we’re looking to open at new all-time highs on SPX. I have been rolling call spreads back into put spreads.
Click “Home/REFRESH” above to keep right-column features updated.
Upside Warning, SPX all-time closing high
#VIXIndicator As if we needed more confirmation that this market is bullish.
Volatility plunging
#VIXindicator After the shortest Downside Warning ever, today we should have an Upside Warning fire. These warnings are less powerful when we are already so close to recent highs, and in this case all-time highs. Although SPX is wavering, VIX is dropping and SVXY soaring. Dow and Nasdaq a bit stronger than SPX. RUT is down.
New VIX highs overnight
#VIXIndicator Vix hit 16.30 early this morning, besting the Apr 17th high by .02. Click “Home/REFRESH” to keep VIX Indicator and other features updated.
With a new downside Warning hitting yesterday, a return to the 2400 area is unlikely for several days or weeks. Selling short-term call spreads is best bet…. further expiration dates may risk getting caught in the bounce. Going long puts or put spreads is riskier as further downside movement may not be as rapid as yesterday. But it could be! Protect your long positions.
Downside signal, Upside Warning is canceled
#VIXIndicator, #SPXcampaign
The VIX crossed 13.03, which is 25% above the 2-day closing low. This cancels the upside warning and sets us up for the possibility of a downside warning. We now need to be cautious of further weakness, but also the possibility that, without a full downside warning in effect, that we may bounce from this week’s lows. We’d have to reach 14.34 today for a Warning to go into effect.
I will be looking to manage some pressured put spreads today.
VIX Discussion on Schwab Weekly Commentary
This week VIX, also known as the “investor fear gauge”, fell to its lowest level since Dec. 27, 1993. While some investors look to VIX as an indicator of market volatility or as a contrarian indicator of market direction I thought it might be useful to simplify what VIX is and how it can be used.
VIX is the ticker for the Chicago Board of Options Exchange Volatility Index. It is a computed index that is calculated using the price of options on the S&P 500. It measures investor expectations for market turbulence going out 30-days and is used as a hedging tool for bullish investors.
To hedge a portfolio against market moving events, investors that are long stocks can go long the VIX, through an ETF or buying options on the VIX itself. If a correction in the market occurs, the VIX can spike higher resulting in gains that will offset losses in a portfolio.
Another use is to interpret VIX as a contrarian indicator. When VIX falls to extreme levels, such as what we currently have, it can signal that investors are too complacent. That can imply that everyone is already long the market and new buyers aren’t to be found. In that case, a “bump” in the stock market could quickly lead investors to over react and the market could over compensate to the downside.
While it’s a useful tool don’t use the VIX as an indicator of the market’s future direction. A low VIX doesn’t signal a market reversal is imminent. Piper Jaffrey technical analyst Craig Johnson recently noted on CNBC that when looking at historical data on the VIX, the last nine times the VIX fell below 12, the market had rallied about 75% of the time with an average return of about 4.5%. He says, “I look at this and say, it’s low, but this is a positive sign, and the VIX is not a good gauge for picking tops. It’s a better gauge for picking bottoms.”
One last note, since the VIX was created, the emergence of leveraged ETFs give investors other ways to hedge portfolios and different investments. If you want to know more about how you can buy ‘insurance’ for your portfolio and whether it’s appropriate for your investments I’d recommend discussing it with a qualified financial advisor.
SPX Chart and VIX Indicator have been updated
I made no new SPX trades today, but have finally caught up and the position chart is now up to date.
We hit a 10 year low on the VIX today, lowest since December 2006.
Upside Warning Update
#VIXIndicator Friday’s close was an all-time record, and just pennies short of the all-time intraday high. However it is only 0.5% above the close of the upside warning day (4/26). I’m including this chart again to show you the moves on all previous upside warnings. 0.5% would be one of the lowest ever, so more upside is likely.
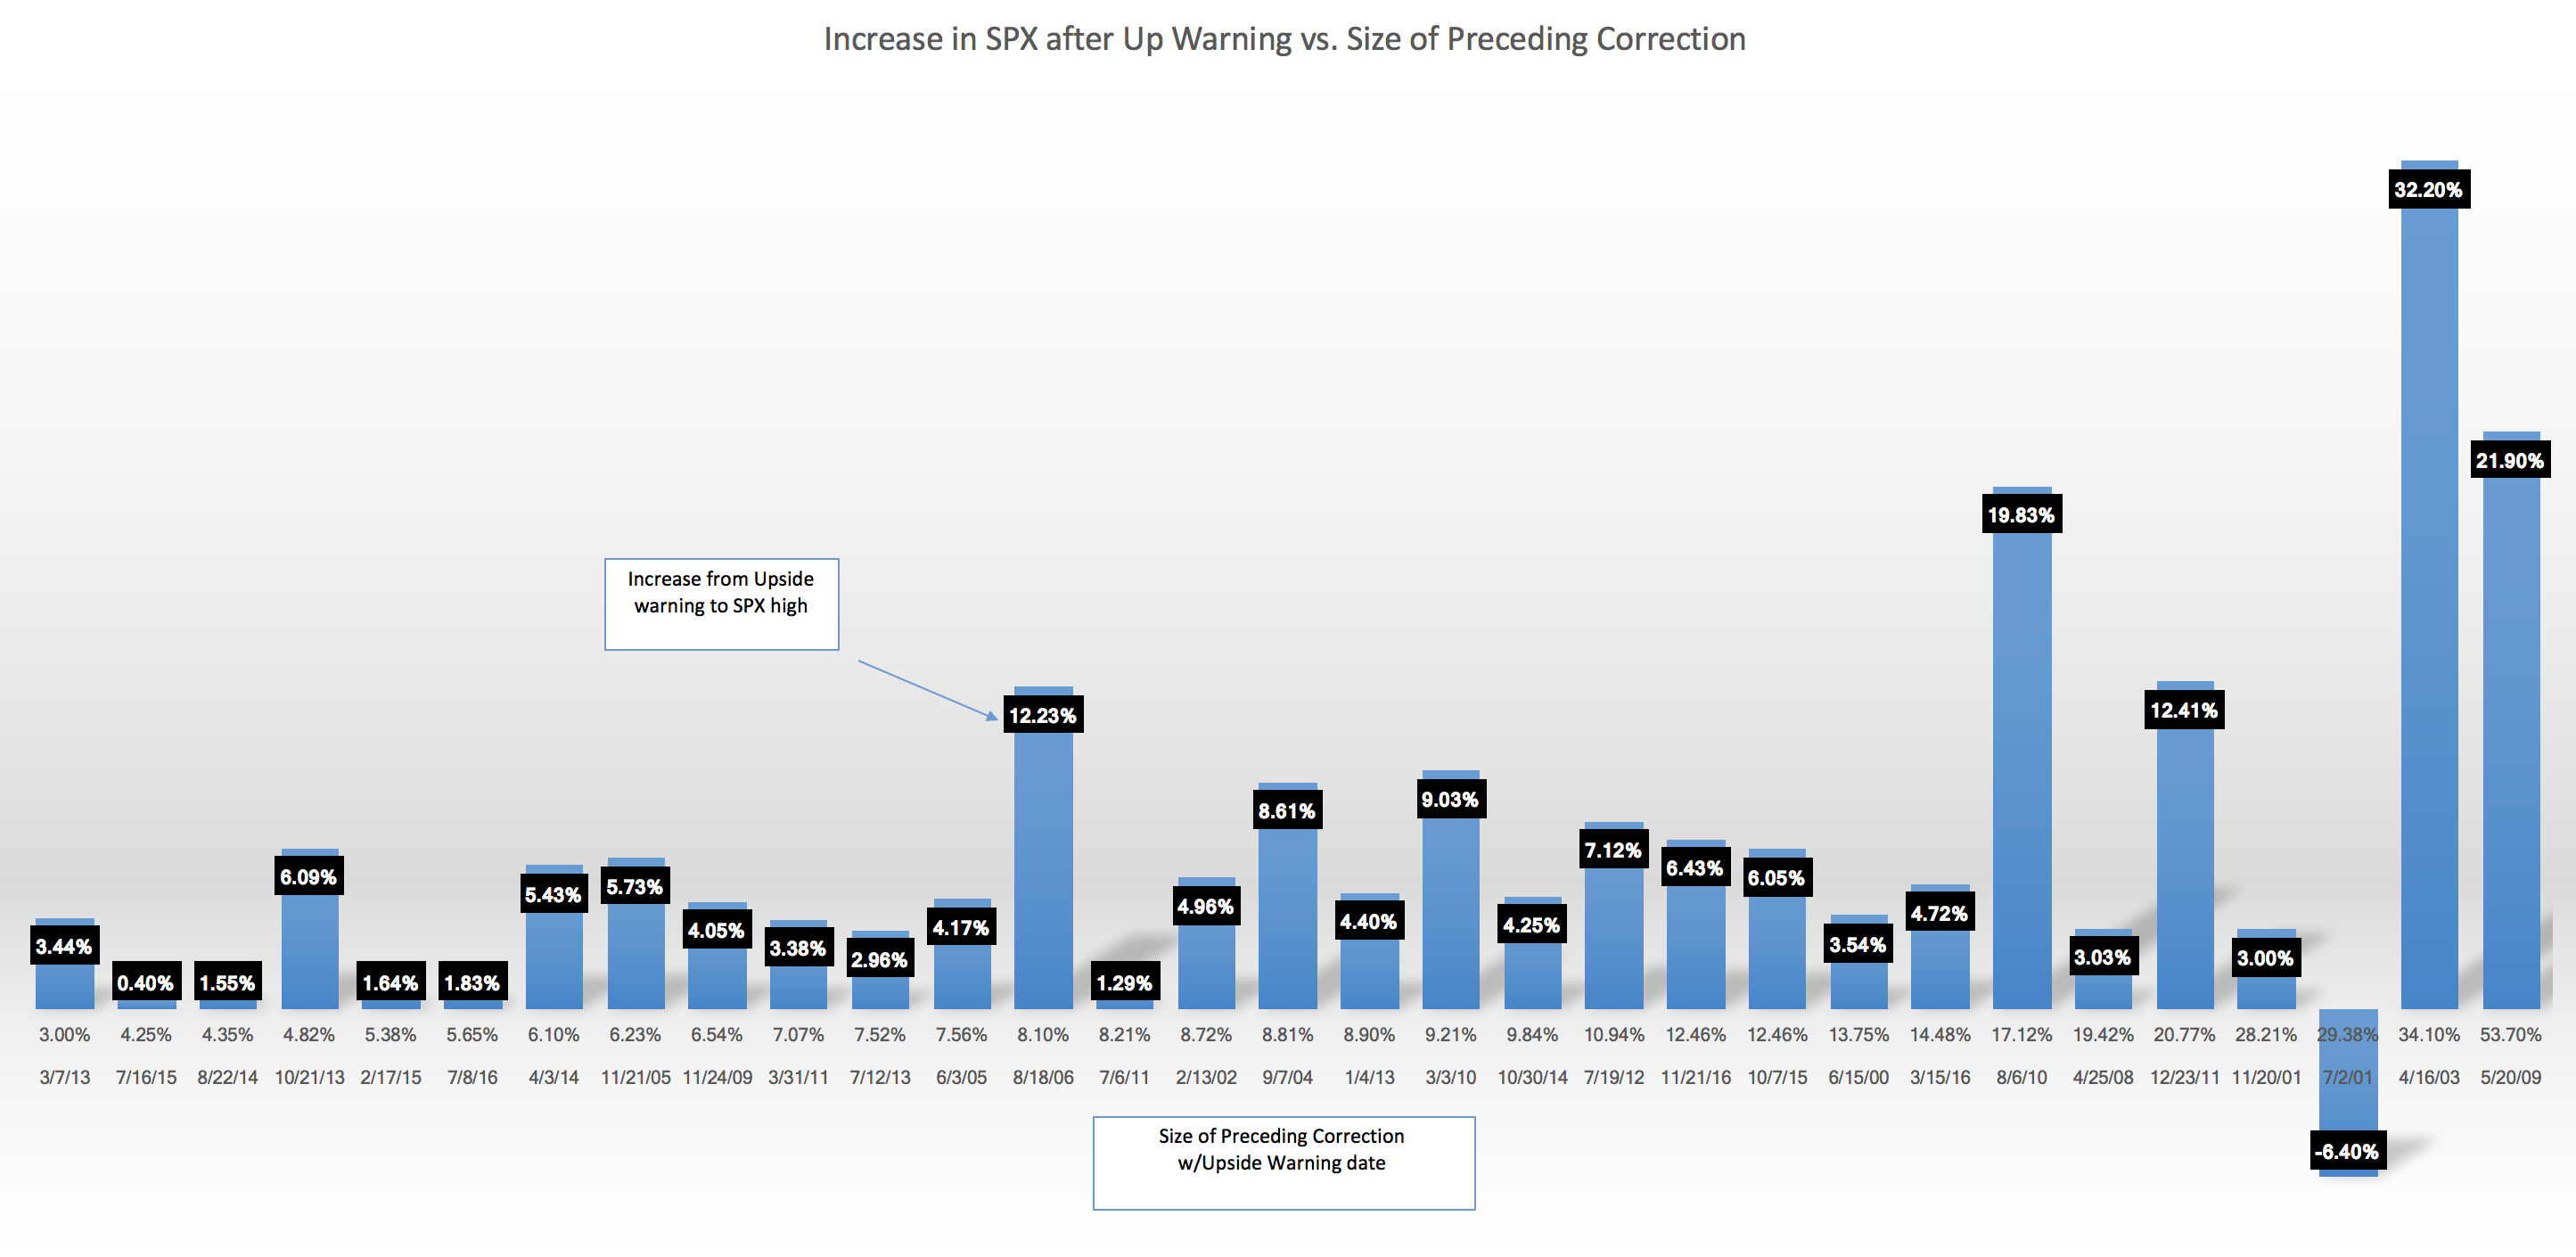
Upside Warning relative performance
#VIXIndicator #Markets
I’ve created a chart to compare the performance of Upside Warnings with the correction that precedes it. The bigger the correction, the bigger the subsequent rally in the SPX. This is no surprise, but I wanted to see how it charted from all Upside Warnings since 1999. The mini-correction we just had was exactly 3.00%, which is tied for smallest with one in 2013. So the move up we should expect now is relatively minor. The first bar on the chart is that 2013 example… SPX increased 3.44% from the close of the Upside Warning day to the next SPX high. A 3.44% move this time would be a high of 2469.58.
Let me know if you have questions!
(note the only time there was a negative performance were the days leading up to 9/11/2001)
Upside Warning Fired today
#VIXIndicator An Upside Warning fired today with the third consecutive day below the 78.6% Fib retracement. This means higher index prices are very likely in the coming days or weeks. Below is the VIX chart for the mini-correction we just completed, and today’s warning. Below that is data from last summer on the Upside Warning. I will be updating this soon.
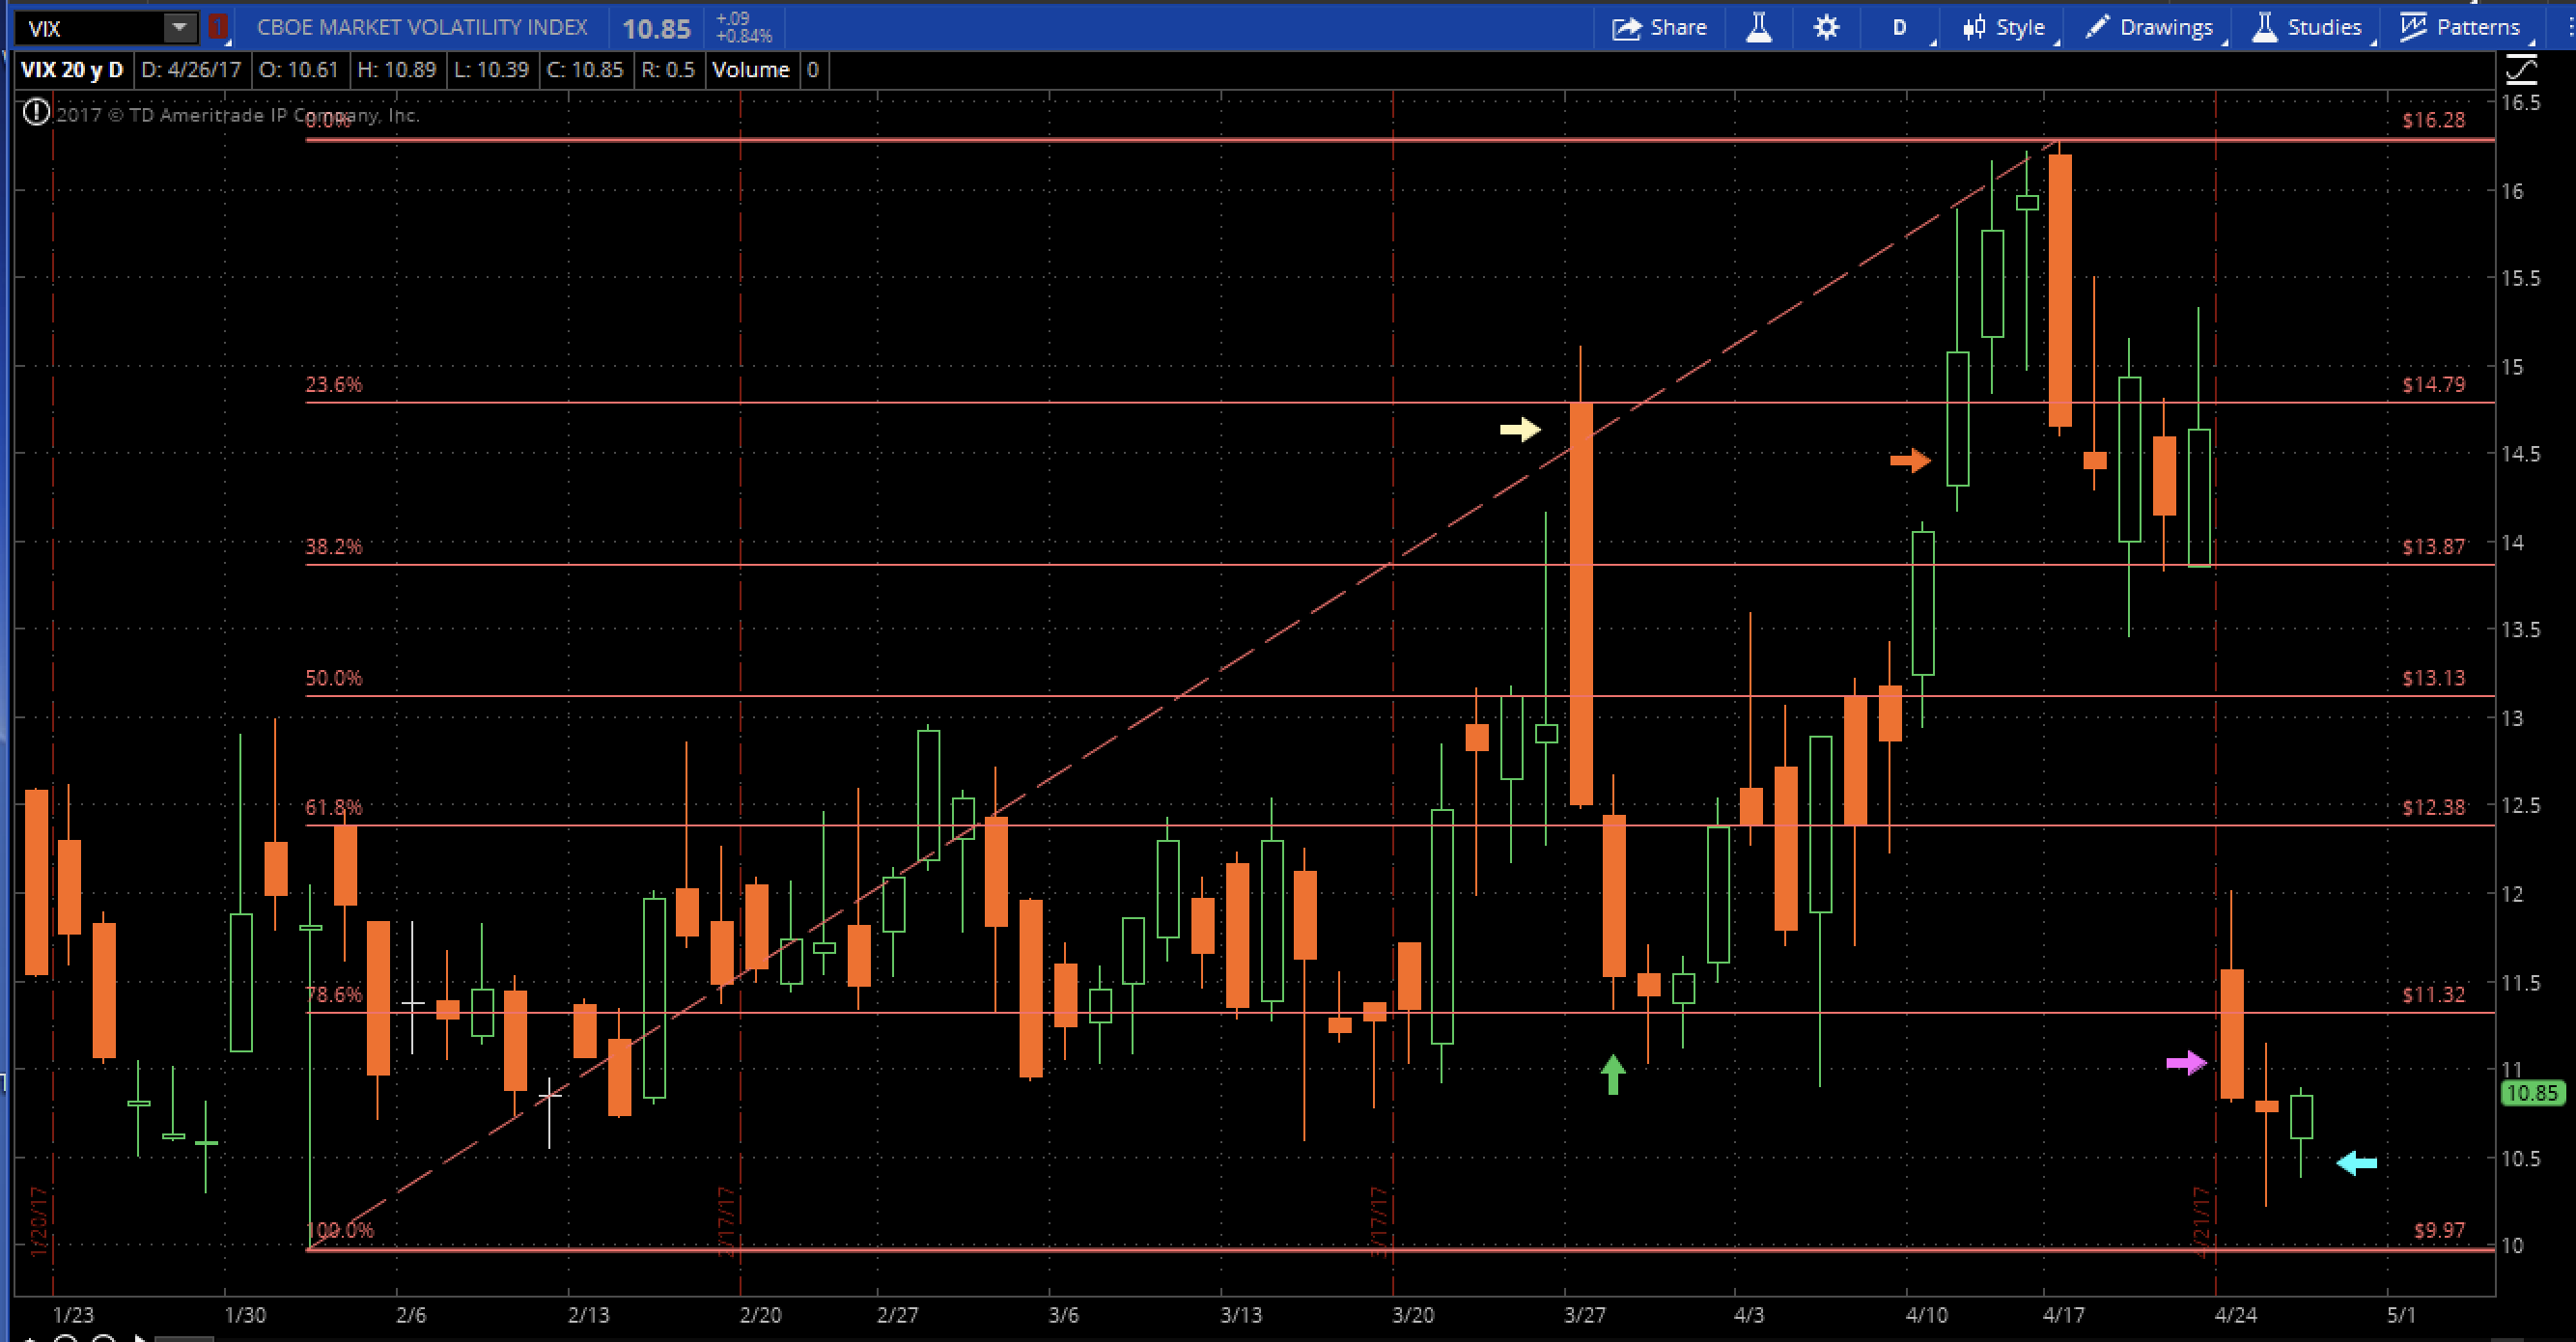
ARROWS: Yellow=1st downside signal; Green=reset 50% warning level; Red=Downside Warning; Pink=Cancel Downside Warning; Cyan=Upside Warning
Upside Warning Data as of last summer:
1. 33 corrections since Nov 1999, as determined by the VIX Indicator’s downside signals. These corrections average 12.5% each. Smallest was 3% and largest was 53.7% (2008-9).
2. Of those corrections, an Upside Warning fired 28 of the 33 times.
3. In 27 out of 28 times, the SPX continued higher after the Warning.
4. The average SPX bottom to top recovery was 16.4%. The average rise AFTER the Warning was 6.40%. This means that the Upside Warning captured an average of 38.9% of each recovery.
5. The average amount of time between an Upside Warning and the next SPX high is 2.5 months.
In summary, when an Upside Warning fires it is almost guaranteed that more upside will come, and it could last several weeks.
SPX reverse roll
#SPXcampaign Stop hit on a call spread so I reversed it, shorter term.
Bought to close $SPX May 12th 2420/2445 call spread for 4.00. Sold for 1.65 last Friday.
Sold to Open $SPX May 10th 2375/2350 put spreads for 4.15.
I had many trades yesterday I didn’t have time to post due to travels. I hope to have the chart revised today or tomorrow but let me know if there are questions on any positions.
The certainty of more upside
#VIXIndicator #Market
This is my last day of traveling so I do not have time to post statistics… you can see past posts by clicking on this: #VIXIndicator
The signal we are now building, VIX closes below the Fib 78.3% retracement, is a very reliable sign that the SPX will continue higher in the coming days. There have been over two dozen occurrences of this since 1999, and in all but one there was no significant pullback for multiple days or weeks.
I am stopping my self out of many call spreads and selling put spreads, some of the them ATM or NTM. I’ll post more stats on this later this week.
Downside Warning was canceled Monday
#VIXIndicator is updated (click “Home/REFRESH” to keep right-hand column updated)
Volatility was crushed on Monday, dropping over 25% and closing below the VIX 78.6% Fib line to cancel the Downside Warning.
Tuesday’s first warning level 13.55 (25% above 2-day closing low), and 14.96 would establish a new Downside Warning. Alternatively, three consecutive closes below 11.32 will constitute an Upside Warning.
Happy Monday from Boston Mass
It’s a holiday in this state, but the markets are open. I will be trading in the morning but then out to watch my wife run the marathon.
The VIX indicator has been updated. I’m behind on the SPX Chart but can answer any questions you have. I started selling call spreads aggressively when the #VIXIndicator fired last Tuesday, and expect more downside this week.
VIX Indicator is updated
#VIXIndicator Today the VIX surpassed 14.96, which is 50% above the VIX low of February 1. Since this is the second time it happened (the first was on March 27th), with a significant pullback between the two signals, this constitutes a Downside Warning on the Indicator I developed to warn us of the possibility of drastic moves down in the SPX.
Many Warnings only result in a small amount of volatility. But the larger market corrections have all been proceeded by these signals. So be cautious with bullish positions. I will keep the site updated as the days progress, and until the Warning is canceled. See the VIXIndicator panel in the right column. ————->
Downside Warning fired
#VIXIndicator We just got a second signal this morning so we are now under a Downside Warning for the #Market. Expect more volatility and a downward bias. Be careful selling put spreads, or avoid them. Consider call spreads on rallies and even long put positions.
I will post more details on the warning later today.
VIX Indicator signal fired
#VIXIndicator #Markets #spxcampaign
In the pre-market, the VIX peaked at 15.11 (so far) this morning and has fired a downside signal. This cancels the Upside Warning that’s been in effect since November. If we reach 16.20 today, that will fire a Downside Warning.
I will be rolling some put spreads today, selling some call spreads, and being cautious on placement of any new put spreads.
VIX Indicator and SPX Chart have been updated
#VIXIndicator $VIX 11.73 is the 78.6% Fib retracement drawn from the VIX 12/21 low and the 12/30 high. Monday was the third consecutive close below this level, which could indicate another strong push higher, like the one that began 12/7.
New all-time high on the SPX
We are still above a new low on the VIX, but this should be the second day of VIX close below 11.73…. Bullish #VIXIndicator
SPX bullish trades
#SPXcampaign As I posted yesterday, the #VIXIndicator is close to signaling another push higher in the next 10 days or so. Using this morning’s weakness to get positioned.
Sold to Open $SPX Jan 27th 2180/2155 put spreads for 1.40.
BOUGHT to open $SPX Jan 13th 2300/2325 call spreads for 1.45.
VIX-Indicator very bullish
#VIXindicator Today we are hitting a place on the Indicator that is similar to Dec 5th, which you can see was right before another huge bullish pop. Provided no bad news smacks the market, we could see a very big run up on Friday, perhaps sparked by the Jobs Report.
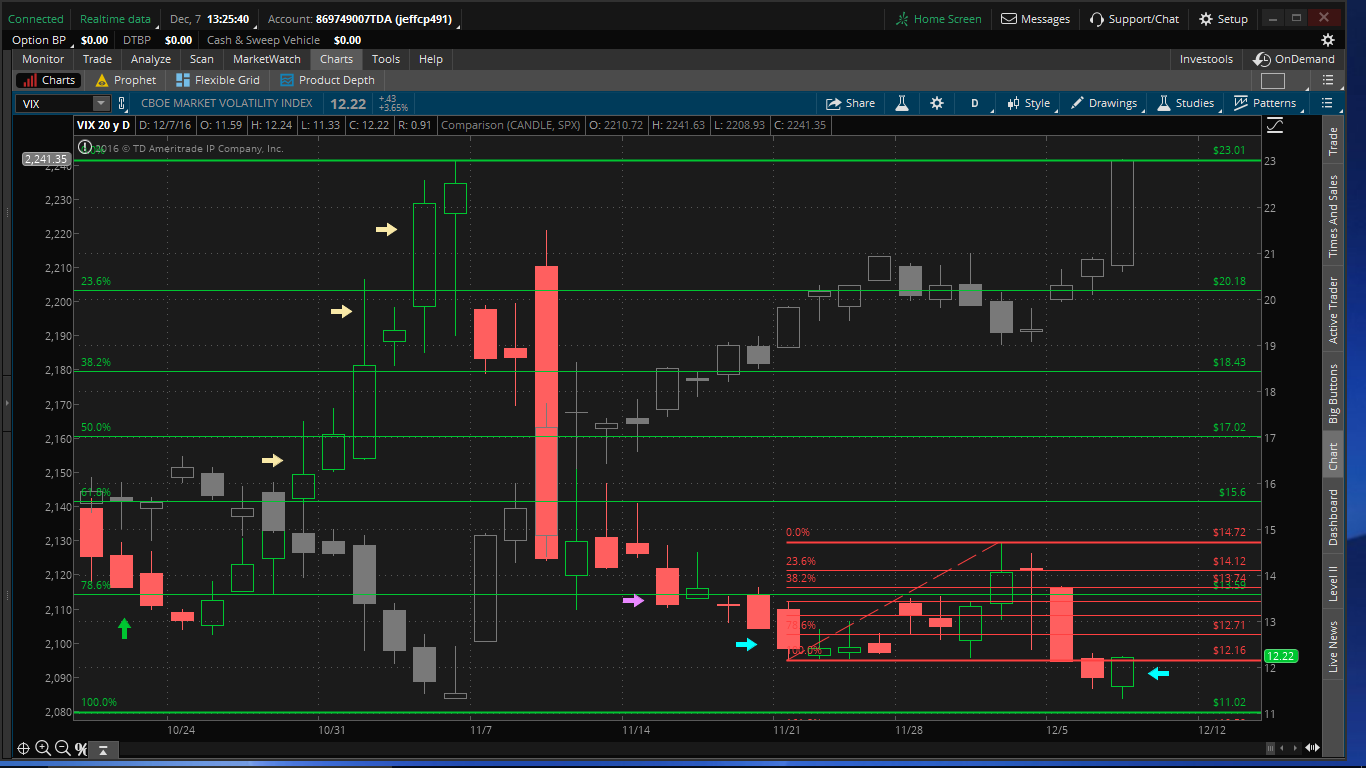
Upside warning re-validated
#VIXIndicator. On the chart below, the green/red candles are the VIX, and the gray candles are the SPX. The cyan arrows indicate the initial Upside Warning on 11/21, and then today. The smaller (red) Fib lines were not an official correction; just the weakness from last week. The 78.6% Fib line is at 12.71, and with today being the third consecutive day below that line, it is a “mini” Upside Warning, thus validating the one we were already under. I’ve seen in the past that these “mini” warnings almost always mean a follow-through of the original rally.
SPX Bam!
#SPXcampaign #VIXIndicator As I study and analyze the past performance of the VIX Indicator, I am struck at how resilient the Upside Warning is. It is a better indicator than the Downside Warning. Today we again saw its potency. After weakness last week failed to cancel the warning, we saw three consecutive days of a much lower VIX. This provides further validation of the original Upside Warning. (I will post a chart).
My account experienced a substantial drawdown today as I wasn’t able to keep up with this sharp move. I am comfortable in the fact that I know I can roll as necessary and I will make it back on the next significant pullback in the market. That could be a month or more away, but it will happen.
I stopped out on three call spreads. I have only rolled one thus far.
Bought to close $SPX Dec 9th 2230/2255 call spreads for 11.20. Sold for 1.30 on Nov 8th.
Rolled: Sold to Open $SPX Dec 23rd 2245/2270 call spreads for 9.10, and Dec 23rd 2175/2150 put spreads for 1.55. I stayed at same position size for the calls and 1.5x size for the puts, so the roll resulted in a .13 credit. The call spread is pretty close to the money, but since it is 2 weeks DTE it is more manageable than the Dec 9th spread that it replaces.
Bought to close $SPX Dec 15th 2255/2280 call spreads for 3.85. Sold for 1.30 on Nov 17th.
Bought to close $SPX Dec 23rd 2260/2285 call spreads for 5.35. Sold for 1.70 on Nov 21st.
Both of these hit my stop of 20-points OTM. I will look to roll this week.
I am still left with four call spreads that have past my stop levels. Will decide how to manage depending on how the week plays out.
Bullish VIX Indicator
#VIXIndicator #markets
On one hand, the VIX is very low and some bounce should be expected. But on other hand, today could be considered a “mini” Upside Warning, with three consecutive days under the 78.6% Fib line from the 11/21 low to the 12/1 high. I believe we are in for continued move up, although I would be surprised if the velocity is very strong.
Bistro VIX Indicator for Tuesday 11/22
AN UPSIDE WARNING FIRED ON MONDAY after the VIX closed below the 78.6% retracement for three consecutive days. This means a very high likelihood of a continued rally in the days and weeks to come.
We also established a new high in the SPX, 2198.70, and have set a new post-correction low in the VIX, 12.16.
Tuesday’s levels that would reverse course and end the Upside Warning are 15.53 (25% above the 2-day closing low), and 18.24 (50% above Nov 21 low). #VIXIndicator
Upside Warning likely today
#VIXIndicator If the VIX closes below 13.59 tonight, an Upside Warning is in effect. Here I am reposting some data I posted on July 14th.:
(An Upside Warning fires when the VIX closes below the Fib 78.6% retracement for three consecutive days)
1. 33 corrections since Nov 1999, as determined by the VIX Indicator’s downside signals. These corrections average 12.5% each. Smallest was 3% and largest was 53.7% (2008-9).
2. Of those corrections, an Upside Warning fired 28 of the 33 times.
3. In 27 out of 28 times, the SPX continued higher after the Warning.
4. The average SPX bottom to top recovery was 16.4%. The average rise AFTER the Warning was 6.40%. This means that the Upside Warning captured an average of 38.9% of each recovery.
5. The average amount of time between an Upside Warning and the next SPX high is 2.5 months.
For instance, in the recovery we are now in: SPX low was 1991 on June 27, high was 2169 on July 14. That is an 8.9% recovery. The Upside Warning fired Friday, July 8, when we closed at 2120.90. Since then, we topped out at 1.83% higher, which means the warning caught 21% of the move so far.
21% is below the 38.9% average, so more upside is definitely possible. But pullbacks can and do happen during Upside Warnings. A new spike in the VIX that triggers a Downside signal would end the Upside Warning.
In summary, when an Upside Warning fires it is almost guaranteed that more upside will come, and it could last several weeks.
SPX Position Chart and VIX Indicator are updated
#SPXcampaign Long overdue on the chart update. I have rolled my way mostly out of the election week whipsaw and have been keeping barely ahead of the rally.
#VIXIndicator If we have another close below 13.59 on Monday, it will trigger an upside warning. If it happens, watch for new all-time highs as we surge higher.
Breakout?
#VIXIndicator #Market If we close today at current VIX levels the Downside Warning will be canceled and we could be on our way to new highs. We had a spike up like this last Thursday too, but then it failed… two hours left…
SPX Position Chart updated
#SPXcampaign I included positions traded today as well. I have not yet connected all the rolls with arrows.
This is my third day straight of closing spreads close to expiry at the worst price of the day. It is quite frustrating, but part of trading. It means I will have to sell more roll-spreads to make up for the huge premium I paid to exit.
I have closed my Nov 9th 2150/2175, but will be leaving on the Nov 9th 2165/2180. One reason is that it is only a 15-point spread, which will mean even if it’s fully ITM it will be easy to roll to my usual 25-point width.
If Trump somehow pulls it out, OR if it is too close to call, we’ll go down… question is, how far and how fast? I want to be clear that I’m not commenting on my political leanings. It is just that the markets have made it clear: a Hillary win is bullish, Trump is bearish. And it seems very likely Clinton will win. If she does, I believe we will rally but I will be looking to fade it. If VIX drops below 13.59 (from the #VIXIndicator), I will look to be bullish.
New VIX signal
#VIXIndicator just surpassed 100% above the Aug 9th low, which is the 5th signal in this correction.
Fourth VIX signal
#VIXIndicator We just hit a 25% increase over the 2-day closing low, which is a fourth signal in this correction.
VIX Indicator signal fired
#VIXIndicator A third signal fired today. After the Warning fired (Oct 13th), additional warnings mean continued volatility but can also signal a market bottom. So it is best to remain on guard after the Warning until it is canceled.
Is the VIXIndicator punking us?
#VIXIndicator Well, if that was a near-term bottom today, that will be three Downside Warnings in a row that occurred on the day of the market bottom… Brexit in June, last month and this month.
That is not the historical norm, but if it’s becoming a new reality I may need to look at some adjustments. The main purpose of the Downside Warnings is to avoid huge dumps like August 2015. For the bigger corrections, it has always given fair warning before the huge dive. It may just be that it is less useful on these smaller dips.
VIX Indicator and SPX Chart updated
#VIXIndicator We are set to open with VIX above 16.53, which will fire a Downside Warning. Keep on guard for further volatility in the coming days or weeks.
Downside Signal Fired
#Market #VIXIndicator Things suddenly look dark… DB and all banks continue dropping. After last Thursday’s Downside Warning cancelation, we have a new signal this Thursday. It takes two signals for a Warning. Next level today is 16.53.
I’m looking to exit the put side of the condor I entered earlier… immediate loss on that one!
VIX Indicator and SPX Chart updated
#VIXIndicator Today we were denied a third consecutive close below the 78.5 line on the VIX (13.05), so there is no Upside Warning.
The market may react to tonight’s debate; I lean a bit bullish in sentiment as I believe it could be sell the anticipation then relax and resume buying after it’s over. But that’s only a guess and I don’t expect to be very surprised by anything tomorrow… just ready to trade it.
If there is a negative reaction, it will likely fire a signal and put us on a correction watch again.
Downside Warning canceled
#VIXIndicator With today’s close below the 78.6% Fib line on the VIX chart, the downside warning is canceled.
Of the 36 VIX Indicator corrections since 2000, a canceled Downside Warning led to an Upside Warning 26 times, or 72%. An Upside Warning occurs after three consecutive closes below the 78.6 line, which currently is 13.05 on the VIX. The average time between a canceled Downside Warning and an Upside Warning is 5.7 trading days.
(For the 10 times an Upside Warning did not follow, it was an average of 16 trading days until a new Downside signal).
We are still using the VIX Aug 9th low of 11.02. The levels for new Downside signals to fire are 15.03 (25% above 2-day closing low), and 16.53 (50% above Aug 9 low).
Volatility crashing
#VIXIndicator If we close below 13.05 the Downside Warning will be canceled.
Third signal fired on VIX Indicator
#VIXindicator A third signal just fired, after the two on Friday, as VIX is up 25% from yesterday’s close.
Of the 36 corrections since 1/1/2000, a third signal fired 29 times. A fourth signal fired 22 times. So based on that data there is just under a 25% chance that we’ve reached the bottom of the correction.
VIX Indicator
A DOWNSIDE WARNING is in effect.
It was established Friday, when VIX exceeded 14.93 (25% above the 2-day low), and 16.53 (50% above August 9 low).
Since 1/1/2000, there have been 36 downside warnings. The subsequent high in the VIX is reached on an average of 12 trading days after the Warning, which in this case would be Sept 27th. The range has been from zero days (happened 3 times) to a max of 50 days (in 2007).
After the Warning, there is usually at least some upside retracement in the SPX before the VIX high is reached, but it is usually minimal and early. The average SPX rally high is only 1.9% above the Warning-day low, and happens on an average of 4 days after the warning. This would mean a high of 2168.24 reached this coming Thursday, before we collapse to new lows. Again, this is based on averages.
Additional signals that occur now will indicate worsening conditions, but also could signal a correction bottom. Monday’s next signals are 21.88 (25% above Friday’s close), and 22.04 (100% above Aug 9th low). After a warning there is a 86% chance at least one more signal will fire, and only an 8.3% chance that the Warning day is also the VIX high.
VIX low was 11.02 on Aug 9th; VIX high Friday was is 17.54. To cancel the Downside Warning, we must have one close below the 78.6% Fib retracement, which is 12.42. This level will change anytime the VIX hits a new intraday high.
Let me know if there are any questions! #VIXIndicator
Downside Warning Fired
#VIXIndicator And there we have it… a full warning to the downside. Two signals hit today.
More downside expected in the coming days and weeks. It is very rare for the day of a warning firing to be the low.
Downside signal fired
#VIXIndicator The VIX has hit 14.93, which is 25% above the 2-day VIX closing low (11.94 close from Wednesday). This meets the criteria to fire a downside signal on the Bistro Vix Indicator. A second signal will mean we get a downside warning, which puts us on the defensive for lower SPX prices.
This signal also cancels the Upside Warning that has been in effect since July 8th.
Based on data since the beginning of 2000, there is a 72% chance we will go further down in the markets and hit a Downside Warning.
SPX Upside Warning data
I have been compiling data on the #VIXindicator. I hope to present it to everyone in a webinar soon, but since we are in an Upside Warning now, I wanted to share some points of interest.
(An Upside Warning fires when the VIX closes below the Fib 78.6% retracement for three consecutive days)
1. 33 corrections since Nov 1999, as determined by the VIX Indicator’s downside signals. These corrections average 12.5% each. Smallest was 3% and largest was 53.7% (2008-9).
2. Of those corrections, an Upside Warning fired 28 of the 33 times.
3. In 27 out of 28 times, the SPX continued higher after the Warning.
4. The average SPX bottom to top recovery was 16.4%. The average rise AFTER the Warning was 6.40%. This means that the Upside Warning captured an average of 38.9% of each recovery.
5. The average amount of time between an Upside Warning and the next SPX high is 2.5 months.
For instance, in the recovery we are now in: SPX low was 1991 on June 27, high was 2169 on July 14. That is an 8.9% recovery. The Upside Warning fired Friday, July 8, when we closed at 2120.90. Since then, we topped out at 1.83% higher, which means the warning caught 21% of the move so far.
21% is below the 38.9% average, so more upside is definitely possible. But pullbacks can and do happen during Upside Warnings. A new spike in the VIX that triggers a Downside signal would end the Upside Warning.
In summary, when an Upside Warning fires it is almost guaranteed that more upside will come, and it could last several weeks.
Bistro VIX Indicator: Upside Warning fired
#VIXIndicator An UPSIDE WARNNG fired on Friday, with three consecutive closes below the Fib 78.6% retracement line (from the recent VIX low of April 20 to high of June 27th). Watch for more upside and new all-time highs in SPX before things slow down or reverse.
We are now also establishing new VIX lows by which to measure the next correction. Friday’s low was 13.19, with a close of 13.20.
Monday’s levels that would reverse course and fire new Downside signals are 16.50 (25% above the 2-day closing low), and 19.79 (50% above July 8th low).
Bistro VIX indicator Archive
Bistro VIX Indicator for Monday 6/27
Downside WARNING fired
#VIXIndicator The Bistro VIX indicator has fired a downside warning. This means there is a high probability of a correction in the coming days or weeks. The VIX has increased 25% within 2 days, hitting 18.30, which is 25% above Thursday’s close. That was the first signal. Then we crossed 18.75, which is 50% above the most recent VIX low (12.50 from April 20th). That was the second signal, and two signals equal a WARNING.
Be leery of the downside, careful with any rolls. Historically, a bigger correction usually occurs after two signals fire; it could be this week, or it could occur weeks from now. To negate this warning, we would need new highs on the S&P (above most recent high of 2120.55, set last week), or the VIX closing three consecutive days below the 78.6% Fib retracement, or 14.32 (based on VIX intraday high of 21.01).
Upside Warning fired
#VIXIndicator UPSIDE WARNING fired. We have just hit 3 consecutive VIX closes below the Fib 78.6% retracement. This historically has meant that volatility has subsided in the near term, and we should be seeing further strength to the rally in the SPX.
This also sets a new VIX low of 16.05 from Friday, 3/4.
Tuesday’s levels that would negate this and switch us to a downside warning are 21.05 and 23.58.
This is the first time a VIX upside warning has fired since I developed the indicator, so it will be interesting to see if SPX pushes higher before any big drops. SPX has risen in the days or weeks following this signal over the majority of times it has fired since 2000.
VIX signal fired
#VIXIndicator We are already under a triple $VIX Warning, but another signal just fired, as 24.18 is 25% above yesterday’s close. The Downside risk is increasing (duh).
$VIX Downside Warning fired again
#VIXIndicator Third time since 11/13.
Good morning…
#VIXIndicator Yesterday The $VIX indicator developed for the #SPXcampaign fired a Downside Warning. This was due to a 25% rise over Tuesday’s close, and also a 50% rise from the latest VIX low on 10/28. This happened on Nov 13th as well, but then retraced back down as $SPX rallied. These are the first times since the indicator was developed that we have traded through it in real time. In backtesting, the Warning usually was followed by a correction, but sometimes it would be several weeks later. Today, we have the jobs report which could rally the market and nullify the signal, or it could lead to further downside. Watch your stops, protect your capital, take opportunities when they appear.
