
#shortputs
$INO BTC 8/21 17 put and STO 8/21/24 put at added $3 credit.
$ZM BTC 7/24 put at .05. STO 6/26 at 3.66
$STNE BTC 8/21 put at .40. STO 7/14 at 2.70
Daily Archives: Thursday, July 23, 2020
SPX spec
#SPX1dte Bought to Open $SPX July 29th 3310/3325 call spreads for 1.80. Spec play based on pullback during Upside Warning.
Markets – AAMTG
The big boys finally get hit – Tech Giants Apple, Amazon, Microsoft, Tesla, Google Tumble
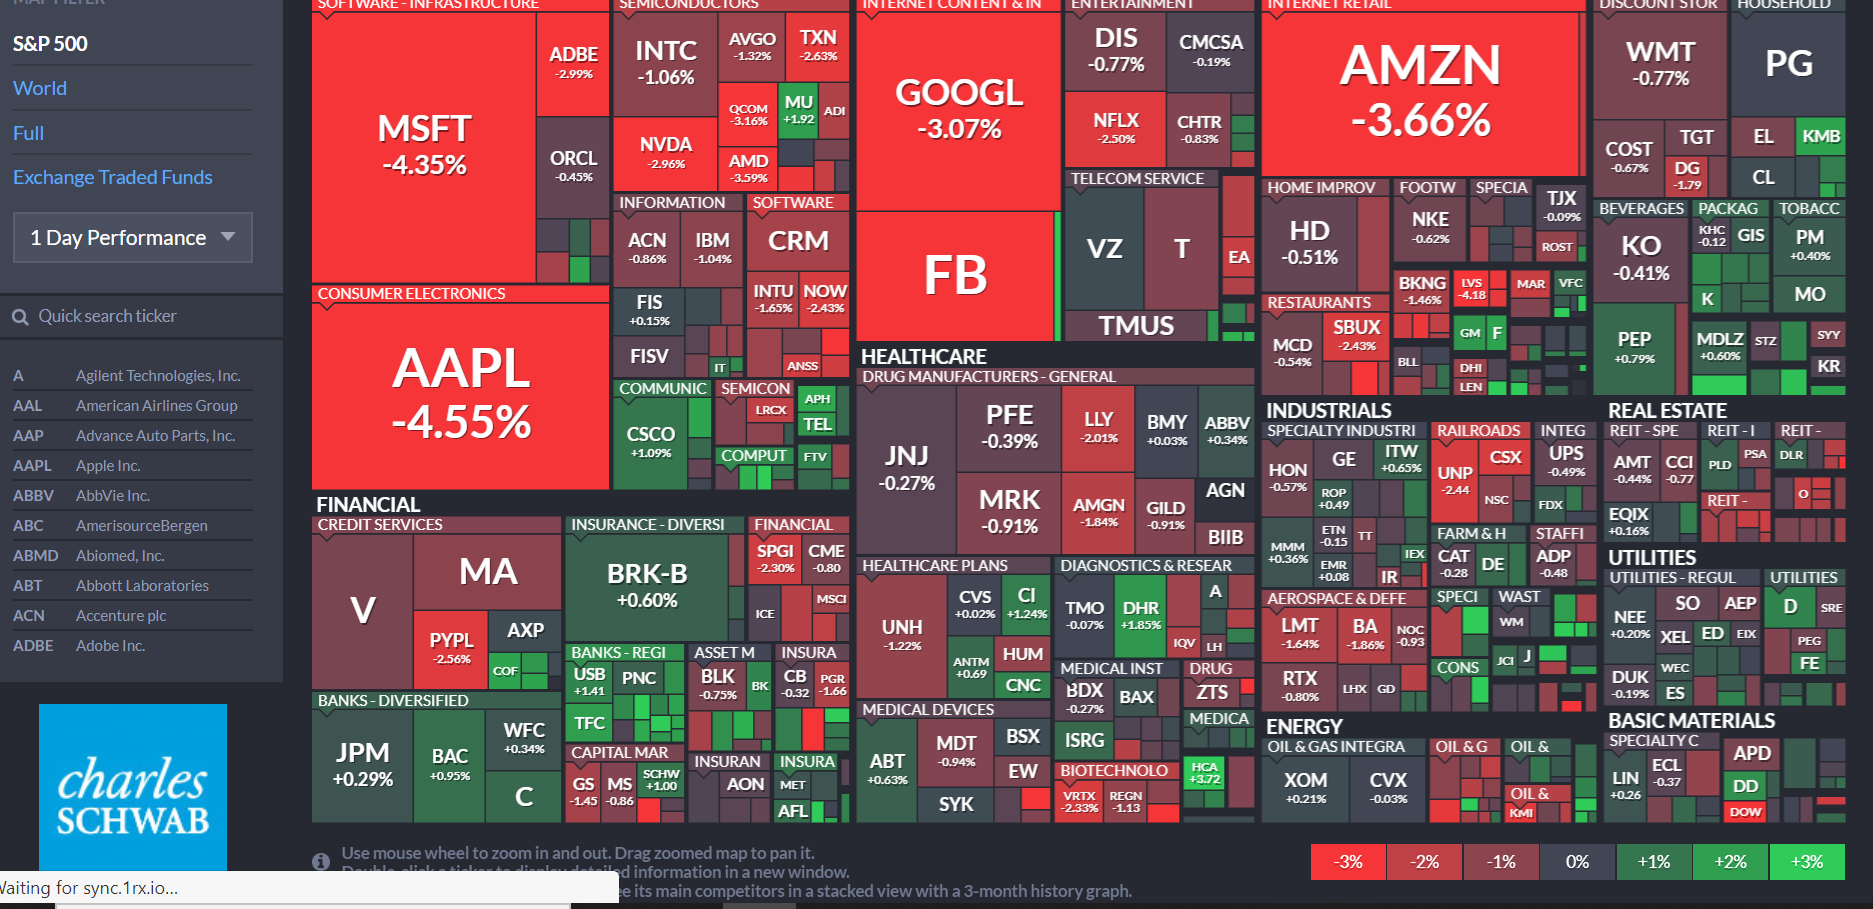
https://www.finviz.com/map.ashx?t=sec
SPX 1-dte
#SPX1te Sold to Open $SPX July 24th 3125/3145-3290/3310 condors for .95, IV 19.05%, SPX 3232, deltas: -.05, +.05.
VXX New Diagonal
Bought to Open 1 VXX Oct 16 2020 70 Call at $1.24
Sold to Open 1 VXX Jul 31 2020 32 Call at $1.36
for a Net Credit at $0.12
Pushing my (hopefully free) long position out closer to the election
VXX
Moving out to next week’s Calls for a diagonal spread.
Sold VXX JUL 31 2020 $37 Calls @ 0.57 against August and September long positions.
#DoubleDip
Doing this as VXX crosses above 30, taking all of tomorrow’s short puts out of the money.
EW earnings analysis & trade
#Earnings $EW reports tonight. Below are details on earnings one-day moves over the last 12 quarters.
April 23, 2020 AC +1.10%
Jan. 30, 2020 AC -6.03%
Oct. 23, 2019 AC +1.63%
July 23, 2019 AC +9.93% Biggest UP
April 23, 2019 AC -1.79%
Jan. 31, 2019 AC -1.00%
Oct. 23, 2018 AC -5.35%
July 26, 2018 AC -8.50%
April 24, 2018 AC -3.82%
Feb. 1, 2018 AC +3.81%
Oct. 24, 2017 AC -9.55% Biggest DOWN
July 26, 2017 AC +0.64%
Avg (+ or -) 4.43%
Bias -1.58%, negative bias on earnings.
With stock at 61.00 the data suggests these ranges:
Based on current IV (expected move into Friday per TOS): 73.37 to 83.03 (+/- 6.2%)
Based on AVERAGE one-day move over last 12 quarters: 74.74 to 81.66
Based on MAXIMUM one-day move over last 12 Q’s (9.9%): 70.43 to 85.97
Based on DOWN max only (-9.6%): 70.73
Open to requests for other symbols.
TSLA condor closed
#Earnings $TSLA July 24th 1375/1385-1880/1885 condors closed for .40. Sold yesterday for 3.45.
NVDA
#ShortPuts – Adding one the week before earnings down near the 50ma.
Sold NVDA AUG 07 2020 375.0 Put @ 2.59
AAPL
#ShortPuts – Another one for safety. Waiting for earnings now…
Bought to Close AAPL JUL 24 2020 370.0 Put @ .44 (sold for 2.30)
MSFT
#ShortPuts – Haven’t been in this one in ages. Selling at the expected move and the 50ma.
Sold MSFT AUG 21 2020 195.0 Put @ 2.60
TSLA Earnings (pre and post)
#ShortPuts #ShortStrangles #JadeLizards
Bought to Close TSLA JUL 24 2020 1500.0/1505.0 Bear Call Spread part of the Jade Lizard @ 4.49
Any fill better than 5.0 adds to the profit here. I’ll let the put side expire for net gain of 2.36.
Also:
Sold TSLA AUG 21 2020 800.0/3200.0 Strangle @ 6.10 (can do better now)
Figuring 50 percent down and 100 percent up might be safe! 🙂 🙂
Also:
Still holding 600 strike short put in Aug monthly.
#fuzzyhotair #putratioladder AAPL put ratio…
AAPL put ratio ladder, week 3 (1×2 credit ratios, 30 delta/25 delta, with a BWB hedge to extend downside)
Week 1: CLOSED
Aug 21 345/340 sold 6.70, bought 2.32
Wish I hadn’t closed this, the breakeven was super far away…should have let more juice drain off until 20 DTE
Week 2:
Aug 28 372.5/365 sold 7.12, put fly hedge 350/340/335 .90
Breakeven $340
Week 3–the Sep 4 expiration just opened today
Sep 4 360/355 sold 6.05, put fly hedge bought 345/335/330 for .93
Breakeven: $335
TSLA post-earnings condor
Sold $TSLA 8/21 1330/1350//1800/1820 iron condor @ 9.40. Leaning short with short puts and calls at 20 and 36 delta. IV rank 34.
INTC earnings analysis
#Earnings $INTC reports tonight. Below are details on earnings one-day moves over the last 12 quarters.
April 23, 2020 AC +0.37%
Jan. 23, 2020 AC +8.13%
Oct. 24, 2019 AC +8.09%
July 25, 2019 AC -1.09%
April 25, 2019 AC -8.99% Biggest DOWN
Jan. 24, 2019 AC -5.46%
Oct. 25, 2018 AC +3.11%
July 26, 2018 AC -8.58%
April 26, 2018 AC -0.60%
Jan. 25, 2018 AC +10.55% Biggest UP
Oct. 26, 2017 AC +7.37%
July 27, 2017 AC +0.97%
Avg (+ or -) 5.28%
Bias 1.16%%, positive bias on earnings.
With stock at 61.00 the data suggests these ranges:
Based on current IV (expected move into Friday per TOS): 58.17 to 63.83 (+/- 4.6%)
Based on AVERAGE one-day move over last 12 quarters: 57.78 to 64.22
Based on MAXIMUM one-day move over last 12 Q’s (10.6%): 54.56 to 67.44
Based on DOWN max only (-9.0%): 55.52
Open to requests for other symbols.
