
I think these two tweets together sum up the ridiculousness of trading off trade-deal headlines.

I think these two tweets together sum up the ridiculousness of trading off trade-deal headlines.
#Earnings $M reports tomorrow morning. Below are details on earnings one-day moves over the last 12 quarters.
Aug. 14, 2019 BO -13.22%
May 15, 2019 BO -0.45%
Feb. 26, 2019 BO +1.47%
Nov. 14, 2018 BO -7.18%
Aug. 15, 2018 BO -15.94%
May 16, 2018 BO +10.82%
Feb. 27, 2018 BO +3.46%
Nov. 9, 2017 BO +10.98% Biggest UP
Aug. 10, 2017 BO -10.24%
May 11, 2017 BO -17.00% Biggest DOWN
Feb. 21, 2017 BO -0.03%
Nov. 10, 2016 BO +5.60%
Avg (+ or -) 8.03%
Bias -2.64%, negative bias on earnings.
With stock at 15.20 the data suggests these ranges:
Based on current IV (expected move into Friday per TOS): 13.39 to 17.01
Based on AVERAGE one-day move over last 12 quarters: 13.98 to 16.42
sed on MAXIMUM one-day move over last 12 Q’s (17.0%): 12.62 to 17.78
Based on UP max only (+11.0%): 16.87
Open to requests for other symbols.
#Earnings $NTES reports tonight. Below are details on earnings one-day moves over the last 12 quarters.
Aug. 7, 2019 AC +10.26%
May 15, 2019 AC +6.51%
Feb. 20, 2019 AC -5.88%
Nov. 14, 2018 AC +5.31%
Aug. 8, 2018 AC -10.96% Biggest DOWN
May 16, 2018 AC -7.45%
Feb. 7, 2018 AC -6.27%
Nov. 15, 2017 AC +7.85%
Aug. 9, 2017 AC -9.77%
May 10, 2017 AC -0.82%
Feb. 15, 2017 AC +14.08% Biggest UP
Nov. 9, 2016 AC -9.22%
Avg (+ or -) 7.87%
Bias -0.53%, small negative bias on earnings.
With stock at 287.50 the data suggests these ranges:
Based on current IV (expected move into Friday per TOS): 266.37 to 308.63
Based on AVERAGE one-day move over last 12 quarters: 264.89 to 310.11
sed on MAXIMUM one-day move over last 12 Q’s (14.1%): 247.02 to 327.98
Based on DOWN max only (-11.0%): 255.99
Open to requests for other symbols.
#SPX1dte Sold to Open $SPX Nov 20th 3075/3095-3140/3160 condors for .95, IV: 7.44%, SPX 3124.
#Earnings $TGT reports tomorrow morning. Below are details on earnings one-day moves over the last 12 quarters.
Aug. 21, 2019 BO +20.42% Biggest UP
May 22, 2019 BO +7.78%
March 5, 2019 BO +4.58%
Nov. 20, 2018 BO -11.26%
Aug. 22, 2018 BO +3.20%
May 23, 2018 BO -5.69%
March 6, 2018 BO -4.45%
Nov. 15, 2017 BO -9.86%
Aug. 16, 2017 BO +3.60%
May 17, 2017 BO +0.93%
Feb. 28, 2017 BO -12.16% Biggest DOWN
Nov. 16, 2016 BO +6.42%
Avg (+ or -) 7.53%
Bias 0.29%, no significant bias on earnings.
With stock at 110.00 the data suggests these ranges:
Based on current IV (expected move into Friday per TOS): 102.31 to 117.69
Based on AVERAGE one-day move over last 12 quarters: 101.72 to 118.28
sed on MAXIMUM one-day move over last 12 Q’s (20.4%): 87.54 to 132.46
Based on UP max only (-12.2%): 96.62
Open to requests for other symbols.
#VXXGame Bought to open $VIX Feb 18th 19/22 call spreads for .60. Added to the Jan 21st 17/20 already holding.
#Earnings $KSS reports tomorrow morning. Below are details on earnings one-day moves over the last 12 quarters.
Aug. 20, 2019 BO -6.88%
May 21, 2019 BO -12.33% Biggest DOWN
March 5, 2019 BO +7.31%
Nov. 20, 2018 BO -9.22%
Aug. 21, 2018 BO +1.71%
May 22, 2018 BO -7.42%
March 1, 2018 BO -5.05%
Nov. 9, 2017 BO +0.93%
Aug. 10, 2017 BO -5.79%
May 11, 2017 BO -7.83%
Feb. 23, 2017 BO -2.08%
Nov. 10, 2016 BO +11.53% Biggest UP
Avg (+ or -) 6.51%
Bias -2.93%, negative bias on earnings.
With stock at 58.50 the data suggests these ranges:
Based on current IV (expected move into Friday per TOS): 53.70 to 63.30
Based on AVERAGE one-day move over last 12 quarters: 54.69 to 62.31
sed on MAXIMUM one-day move over last 12 Q’s (12.3%): 51.29 to 65.71
Based on UP max only (+11.5%): 65.25
Open to requests for other symbols.
#Earnings $HD reports tomorrow morning. Below are details on earnings one-day moves over the last 12 quarters.
Aug. 20, 2019 BO +4.39% Biggest UP
May 21, 2019 BO +0.26%
Feb. 26, 2019 BO -0.88%
Nov. 13, 2018 BO -0.23%
Aug. 14, 2018 BO -0.53%
May 15, 2018 BO -1.62%
Feb. 20, 2018 BO -0.13%
Nov. 14, 2017 BO +1.63%
Aug. 15, 2017 BO -2.65% Biggest DOWN
May 16, 2017 BO +0.59%
Feb. 21, 2017 BO +1.41%
Nov. 15, 2016 BO -2.56%
Avg (+ or -) 1.41%
Bias -0.03%, no significant bias on earnings.
With stock at 237.50 the data suggests these ranges:
Based on current IV (expected move into Friday per TOS): 229.57 to 245.43
Based on AVERAGE one-day move over last 12 quarters: 234.16 to 240.84
sed on MAXIMUM one-day move over last 12 Q’s (4.4%): 227.07 to 247.93
Based on DOWN max only (-2.7%): 231.21
Open to requests for other symbols.
#SPX1dte I’m legging in as I feel the index may continue higher into the close.
Sold $SPX Nov 18th 3085/3065 put spreads for .55. IV 5.98%, SPX 3115.
Will look to sell call side on a spike higher, or perhaps skip it since IV and premium is so low.
#Earnings Closed put side of $CSCO Nov15/Nov22 48.5 #DoubleCalendar for .00 on TOS, for a .01 debit on IB. The short calls will expire, long calls a lottery ticket for next week.
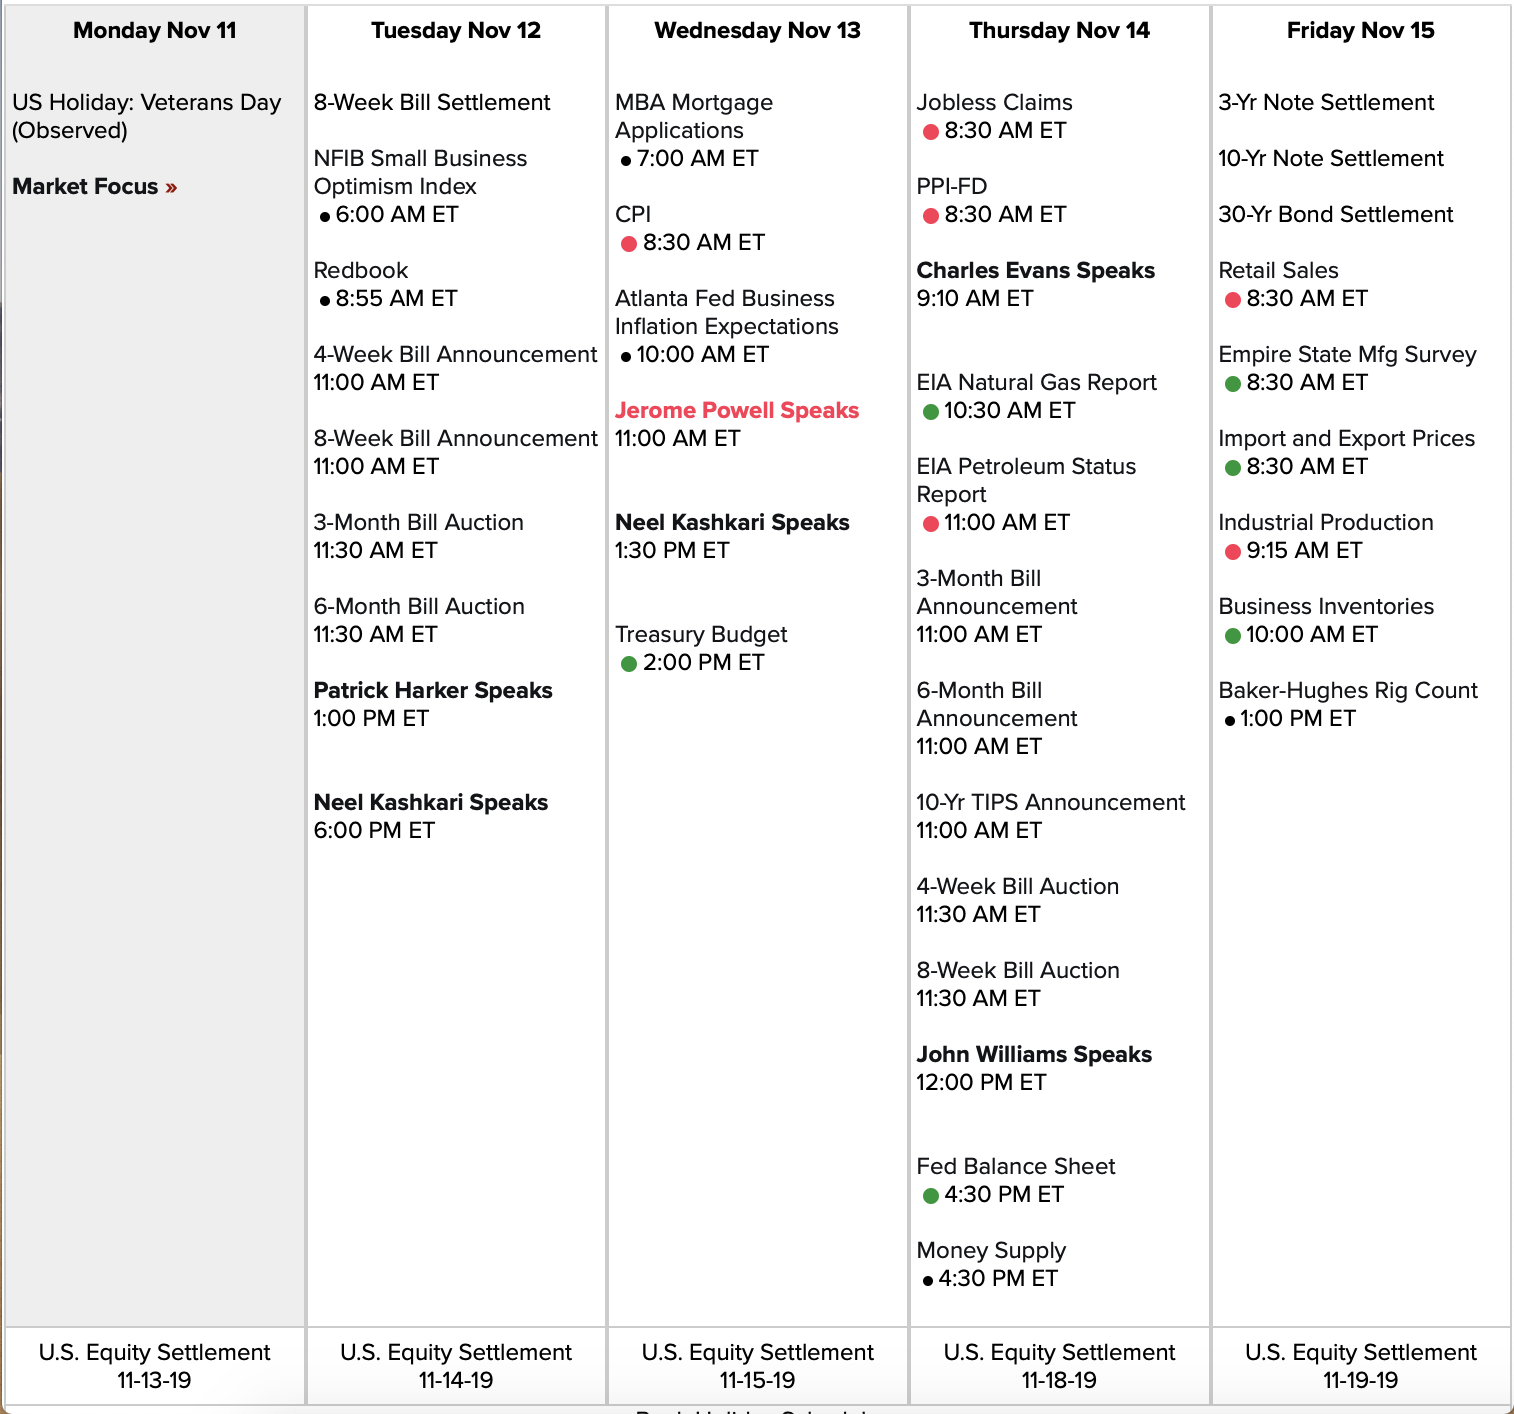
#FOMC minutes Wednesday at 2pm ET

Link to Calendar: https://us.econoday.com/byweek.asp?day=18&month=11&year=2019&cust=us&lid=0
#VXXgame Sold to close $VXX Jan 17th 20 puts for 3.50. Bought between Jan 22 and Aug 27 for avg price of 1.30. Sold four batches so far at 2.65, 3.00, 3.25, and 3.50.
Still holding a final batch. Going for 4.00.
#SPX1dte Sold to Open $SPX Nov 15th 3045/3065-3120/3140 condors for .70, IV 8.62%, SPX 3096
#Earnings Bought Nov 15th 217.5/220/222.5 call #EMButterfly for .19.
#Earnings $NVDA reports tonight. Below are details on earnings one-day moves over the last 12 quarters.
Aug. 15, 2019 AC +7.25%
May 16, 2019 AC -2.28%
Feb. 14, 2019 AC +1.81%
Nov. 15, 2018 AC -18.75% Biggest DOWN
Aug. 16, 2018 AC -4.90%
May 10, 2018 AC -2.15%
Feb. 8, 2018 AC +6.69%
Nov. 9, 2017 AC +5.26%
Aug. 10, 2017 AC -5.32%
May 9, 2017 AC +17.82%
Feb. 9, 2017 AC -2.37%
Nov. 10, 2016 AC +29.80% Biggest UP
Avg (+ or -) 8.70%
Bias 2.74%, positive bias on earnings.
With stock at 208.00 the data suggests these ranges:
Based on current IV (expected move into Friday per TOS): 194.41 to 221.59
Based on AVERAGE one-day move over last 12 quarters: 189.90 to 226.10
sed on MAXIMUM one-day move over last 12 Q’s (29.8%): 146.02 to 269.98
Based on DOWN max only (-18.8%): 169.00
Open to requests for other symbols.
#Earnings $CSCO reports tonight. Below are details on earnings one-day moves over the last 12 quarters.
Aug. 14, 2019 AC -8.61% Biggest DOWN
May 15, 2019 AC +6.65% Biggest UP
Feb. 13, 2019 AC +1.89%
Nov. 14, 2018 AC +5.50%
Aug. 15, 2018 AC +2.96%
May 16, 2018 AC -3.76%
Feb. 14, 2018 AC +4.72%
Nov. 15, 2017 AC +5.18%
Aug. 16, 2017 AC -4.01%
May 17, 2017 AC -7.21%
Feb. 15, 2017 AC +2.37%
Nov. 16, 2016 AC -4.81%
Avg (+ or -) 4.81%
Bias 0.07%, no significant bias on earnings.
With stock at 48.50 the data suggests these ranges:
Based on current IV (expected move into Friday per TOS): 46.22 to 50.78
Based on AVERAGE one-day move over last 12 quarters: 46.17 to 50.83
sed on MAXIMUM one-day move over last 12 Q’s (8.6%): 44.32 to 52.68
Based on UP max only (+6.7%): 51.73
Open to requests for other symbols.
#Earnings . Sold to close $SWKS Nov15/Nov22 101 #DoubleCalendar for 1.40. Bought yesterday for .732.
Only partial fill so far.
#Earnings $WMT reports tomorrow morning. Below are details on earnings one-day moves over the last 12 quarters.
Aug. 15, 2019 BO +6.22%
May 16, 2019 BO +1.43%
Feb. 19, 2019 BO +2.21%
Nov. 15, 2018 BO -1.96%
Aug. 16, 2018 BO +9.33%
May 17, 2018 BO -1.90%
Feb. 20, 2018 BO -10.17% Biggest DOWN
Nov. 16, 2017 BO +10.89% Biggest UP
Aug. 17, 2017 BO -1.58%
May 18, 2017 BO +3.22%
Feb. 21, 2017 BO +2.99%
Nov. 17, 2016 BO -3.08%
Avg (+ or -) 4.58%
Bias 1.47%, positive bias on earnings.
With stock at 120.00 the data suggests these ranges:
Based on current IV (expected move into Friday per TOS): 115.34 to 124.66
Based on AVERAGE one-day move over last 12 quarters: 114.50 to 125.50
ased on MAXIMUM one-day move over last 12 Q’s (10.9%): 106.93 to 133.07
Based on DOWN max only (-10.2%): 107.80
Open to requests for other symbols.
#Earnings $NTAP reports tonight. Below are details on earnings one-day moves over the last 12 quarters.
Aug. 14, 2019 AC +3.93%
May 22, 2019 AC -8.10%
Feb. 13, 2019 AC -5.47%
Nov. 14, 2018 AC -11.72% Biggest DOWN
Aug. 15, 2018 AC -3.58%
May 23, 2018 AC +1.93%
Feb. 14, 2018 AC -4.89%
Nov. 15, 2017 AC +15.91% Biggest UP
Aug. 16, 2017 AC -6.72%
May 24, 2017 AC +3.53%
Feb. 15, 2017 AC +4.18%
Nov. 16, 2016 AC +6.24%
Avg (+ or -) 6.35%
Bias -0.40%, slight negative bias on earnings.
With stock at 60.50 the data suggests these ranges:
Based on current IV (expected move into Friday per TOS): 55.03 to 65.97
Based on AVERAGE one-day move over last 12 quarters: 56.66 to 64.34
ased on MAXIMUM one-day move over last 12 Q’s (15.9%): 50.87 to 70.13
Based on DOWN max only (-11.7%): 53.41
Open to requests for other symbols.
#SPX1dte Sod to Open $SPX Nov 13th 3050/3060-3110/3120 condors for .50. Ten-wide, double position.
IV 7.61%, SPX 3088.
#Hedge I’m calling it a hedge, but I’m not net long or short so it’s really just a trade.
Bought to open $VIX Jan 21st 17/20 call spread for .80
#Earnings Bought to open $SWKS Nov15/Nov22 101 #DoubleCalendar for 0.732 (avg price).
#VXXGame Sold to close next batch of $VXX Jan 2020 long 20 puts for 3.25. Bought for avg price of 1.30. Still holding more.
#SPX1dte Bought to close $SPX Nov 15th 3050/3025 put spreads for 1.35. Sold yesterday for 1.75. I’m not liking the look of today’s action, so not going to let this get worse.
#LongLEAPs Sold to Close $TQQQ Jan 2020 66.67 long calls for 11.05.
Starting buying on Oct 4th, 2018, LAST year, for average price of 10.12 over 5 accounts.
I reduced cost basis by selling covered calls (and sometimes puts), but I’m behind on bookkeeping so not sure by how much yet. It looks like I reduced it by only a little on some accounts, up to about a half on others. I’ve decided to close now as I do not trust the market for remainder of year. I do think higher is certainly possible, but that we could also see a pullback soon that would not regain current levels until after expiration.
#Earnings $SWKS reports tonight. Below are details on earnings one-day moves over the last 12 quarters.
Aug. 7, 2019 AC +0.46%
May 2, 2019 AC -3.51%
Feb. 5, 2019 AC +11.49%
Nov. 8, 2018 AC -8.08% Biggest DOWN
July 19, 2018 AC -5.35%
May 3, 2018 AC +4.28%
Feb. 5, 2018 AC +10.44%
Nov. 6, 2017 AC -4.41%
July 20, 2017 AC -0.15%
April 27, 2017 AC -4.28%
Jan. 19, 2017 AC +13.01% Biggest UP
Nov. 3, 2016 AC +0.53%
Avg (+ or -) 5.50%
Bias 1.20%, positive bias on earnings.
With stock at 102.00 the data suggests these ranges:
Based on current IV (expected move into Friday per TOS): 95.27 to 108.73
Based on AVERAGE one-day move over last 12 quarters: 96.39 to 107.61
ased on MAXIMUM one-day move over last 12 Q’s (13.0%): 88.73 to 115.27
Based on DOWN max only (-8.1%): 93.76
Open to requests for other symbols.
#SPX1dte Sold to Open $SPX Nov 15th 3050/3025 put spreads for 1.75, IV 9.37%, SPX close 3087
Sold this after the bell. I was wrong about a rally today but still think we have higher to go before this peters out.
Expiring today: 3065/3046 put credit spread and 3110/3125 call debit spread, trades placed Friday for net credit of .40.
#Earnings Sold to close final $UVXY Jan 2020 20 puts for 4.75. Avg purchase price 1.85. Still holding long $VXX 20 puts.
The Good, Expiring worthless:
$SPX Nov 8th 3040/3060-3110/3130 condors, sold yesterday for .80
$DIS Nov 8th 130/128 put spreads, sold yesterday for .65
The Bad, although not Ugly,
$MNST Nov 8th 59/60.5/62 EM call butterfly, bought yesterday for .205
$HUM Nov 8th EM put and call butterflys, bought for .32 total on Tuesday
First time I tried these, both could have been exited for small profit at one point, but I waited to see if I could get more.
#SPX1dte After getting stopped out on call side last Friday and Monday, I am taking a bullish bet for Monday, since yesterday and today SPX was nearly flat. Time for another surge.
Sold to Open $SPX Nov 11th 3065/3045 put spread for .68 credit
Bought to open Nov 11th 3110/3125 call spreads for .28 debit
I did the above as one trade for a .40 credit. If we gap open I will look to sell the call spread early.
Link to calendar: https://us.econoday.com/byweek.asp?day=11&month=11&year=2019&cust=us&lid=0
#Earnings . Sold to close $SQ Nov08/Nov15 61 #DoubleCalendar for 1.00. Bought Wednesday for .48
#Earnings . Sold to Open $DIS Nov 8th 130/128 put spread for .65.
#SPX1dte Sold to Open $SPX Nov 8th 3040/3060-3110/3130 condors for .80, IV 7.69%, SPX 3085
#Earnings $MNST reports tonight. Below are details on earnings one-day moves over the last 12 quarters.
Aug. 7, 2019 AC +2.96%
May 2, 2019 AC +8.82%
Feb. 27, 2019 AC +8.66%
Nov. 7, 2018 AC -3.16%
Aug. 8, 2018 AC +2.65%
May 8, 2018 AC -7.47%
Feb. 28, 2018 AC -14.43% Biggest DOWN
Nov. 8, 2017 AC +1.17%
Aug. 8, 2017 AC -1.14%
May 4, 2017 AC +3.30%
March 1, 2017 AC +12.75% Biggest UP
Nov. 3, 2016 AC -3.55%
Avg (+ or -) 5.84%
Bias 0.88%, positive bias on earnings.
With stock at 56.75 the data suggests these ranges:
Based on current IV (expected move into Friday per TOS): 52.63 to 60.87
Based on AVERAGE one-day move over last 12 quarters: 53.44 to 60.06
Based on MAXIMUM one-day move over last 12 Q’s (14.4%): 48.56 to 64.94
Based on UP max only (+12.8%): 63.99
Open to requests for other symbols.
#Earnings $DIS reports tonight. Below are details on earnings one-day moves over the last 12 quarters.
Aug. 6, 2019 AC -4.94% Biggest DOWN
May 8, 2019 AC -1.03%
Feb. 5, 2019 AC -1.10%
Nov. 8, 2018 AC +1.72%
Aug. 7, 2018 AC -2.21%
May 8, 2018 AC -1.78%
Feb. 6, 2018 AC -1.32%
Nov. 9, 2017 AC +2.04%
Aug. 8, 2017 AC -3.87%
May 9, 2017 AC -2.15%
Feb. 7, 2017 AC 0.00%
Nov. 10, 2016 AC +2.86% Biggest UP
Avg (+ or -) 2.09%
Bias -0.98%, negative bias on earnings.
With stock at 132.5 the data suggests these ranges:
Based on current IV (expected move into Friday per TOS): 127.48137.42
Based on AVERAGE one-day move over last 12 quarters: 129.74 to 135.26
Based on MAXIMUM one-day move over last 12 Q’s (4.9%): 125.95 to 139.05
Based on UP max only (+2.9%): 136.29
Open to requests for other symbols.
#SPX1dte Expiring: $SPX Nov 6th 3040/3050-3100/3110 condors, sold yesterday for .50.
#Earnings $SQ reports tonight. Below are details on earnings one-day moves over the last 12 quarters.
Aug. 1, 2019 AC -14.05% Biggest DOWN
May 1, 2019 AC -7.98%
Feb. 27, 2019 AC +2.42%
Nov. 7, 2018 AC -9.02%
Aug. 1, 2018 AC +8.65%
May 2, 2018 AC +1.13%
Feb. 27, 2018 AC +0.30%
Nov. 8, 2017 AC +3.40%
Aug. 2, 2017 AC -4.68%
May 3, 2017 AC +8.86%
Feb. 22, 2017 AC +14.02% Biggest UP
Nov. 1, 2016 AC +6.41%
Avg (+ or -) 6.74%
Bias 0.79%, positive bias on earnings.
With stock at 61.00 the data suggests these ranges:
Based on current IV (expected move into Friday per TOS): 55.48 to 66.52
Based on AVERAGE one-day move over last 12 quarters: 56.89 to 65.11
Based on MAXIMUM one-day move over last 12 Q’s (14.1%): 52.43 to 69.57
Based on UP max only (+14.0%): 69.55
Open to requests for other symbols.
#Earnings $ROKU reports tonight. Below are details on earnings one-day moves over its entire history (8 quarters).
Aug. 7, 2019 AC +20.85%
May 8, 2019 AC +28.11%
Feb. 21, 2019 AC +25.23%
Nov. 7, 2018 AC -22.29% Biggest DOWN
Aug. 8, 2018 AC +21.31%
May 9, 2018 AC -1.71%
Feb. 21, 2018 AC -17.71%
Nov. 8, 2017 AC +54.93% Biggest UP
Avg (+ or -) 24.02%
Bias 13.59%, strong positive bias on earnings.
With stock at 143.00 the data suggests these ranges:
Based on current IV (expected move into Friday per TOS): 122.94 to 163.06
Based on AVERAGE one-day move over last 8 quarters: 108.65 to 177.35
Based on MAXIMUM one-day move over last 8 Q’s (54.9%): 64.45 to 221.55
Based on DOWN max only (-22.3%): 119.30
Open to requests for other symbols.
#Earnings $BIDU reports tonight. Below are details on earnings one-day moves over the last 12 quarters.
Aug. 19, 2019 AC +4.31%
May 16, 2019 AC -16.51% Biggest DOWN
Feb. 21, 2019 AC -2.70%
Oct. 30, 2018 AC +3.64%
July 31, 2018 AC -7.73%
April 26, 2018 AC +5.54%
Feb. 13, 2018 AC +4.56%
Oct. 26, 2017 AC -8.15%
July 27, 2017 AC +9.45% Biggest UP
April 27, 2017 AC -4.06%
Feb. 23, 2017 AC -5.12%
Oct. 27, 2016 AC +2.56%
Avg (+ or -) 6.19%
Bias -1.18%, negative bias on earnings.
With stock at 109.00 the data suggests these ranges:
Based on current IV (expected move into Friday per TOS): 100.94 to 117.06
Based on AVERAGE one-day move over last 12 quarters: 102.25 to 115.75
Based on MAXIMUM one-day move over last 12 Q’s (16.5%): 91.00 to 127.00
Based on UP max only (+9.5%): 119.30
Open to requests for other symbols.
#Earnings . Following @mortlightman here, although I would still like to know, Mort, why you only went with the downside. Also, what is exit plan….. do you want for price to go near your center strike or just get out quickly?
Bought $HUM Nov 8th 280/282.5/285 put butterflys for .15
Bought $HUM Nov 8th 305/307.5/310 call butterflys for .17
#SPX1dte Sold to Open $SPX 3040/3050-3100/3110 condors for .50, 10-wide, double sized.
IV 7.31%, SPX 3078.
#Earnings Bought to close $UBER Nov 8th 27.5 puts for .75. #ShortStrangles sold yesterday for 1.86. I’ll let the 33.5 calls expire.
#Earnings $CRPI reports tomorrow morning. Below are details on earnings one-day moves over the last 12 quarters.
**CPRI was formerly $KORS. The most recent 3 quarters (at top) are CPRI, the remainder are KORS.
Aug. 7, 2019 BO +3.07%
May 29, 2019 BO -9.84%
Feb. 6, 2019 BO +11.29%
—————————
Nov. 7, 2018 BO -14.62% Biggest DOWN
Aug. 8, 2018 BO +6.72%
May 30, 2018 BO -11.44%
Feb. 7, 2018 BO +1.02%
Nov. 6, 2017 BO +14.69%
Aug. 8, 2017 BO +21.54% Biggest UP
May 31, 2017 BO -8.51%
Feb. 7, 2017 BO -10.80%
Nov. 10, 2016 AC -3.97%
Avg (+ or -) 9.79%
Bias -0.07%, no sign bias on earnings.
With stock at 34.00 the data suggests these ranges:
Based on current IV (expected move into Friday per TOS): 30.13 to 37.87
Based on AVERAGE one-day move over last 12 quarters: 30.67 to 37.33
Based on MAXIMUM one-day move over last 12 Q’s (21.5%): 26.68 to 41.32
Based on DOWN max only (-14.6%): 29.03
Open to requests for other symbols.
#Earnings $HUM reports tomorrow morning. Below are details on earnings one-day moves over the last 12 quarters.
July 31, 2019 BO +4.29%
May 1, 2019 BO -3.62%
Feb. 6, 2019 BO -0.54%
Nov. 7, 2018 BO +6.68% Biggest UP
Aug. 1, 2018 BO +1.26%
May 2, 2018 BO -2.54%
Feb. 7, 2018 BO -1.56%
Nov. 8, 2017 BO -5.00% Biggest DOWN
Aug. 2, 2017 BO +4.47%
May 3, 2017 BO -0.70%
Feb. 8, 2017 BO +2.25%
Nov. 4, 2016 BO +1.27%
Avg (+ or -) 2.85%
Bias 0.52%, positive bias on earnings.
With stock at 297.50 the data suggests these ranges:
Based on current IV (expected move into Friday per TOS): 285.04 to 309.96
Based on AVERAGE one-day move over last 12 quarters: 289.03 to 305.97
Based on MAXIMUM one-day move over last 12 Q’s (6.7%): 277.63 to 317.37
Based on DOWN max only (-5.0%): 282.63
Open to requests for other symbols.
#Earnings $UBER reports tonight. Below are details on earnings one-day moves over its entire history.
Option premium and IV is high… expected move is much higher than its previous maximum move.
Aug. 8, 2019 AC -6.79%
May 30, 2019 AC +1.53%
Avg (+ or -) 4.16%
Bias -2.63%, negative bias on earnings.
With stock at 30.50 the data suggests these ranges:
Based on current IV (expected move into Friday per TOS): 26.21 to 34.79
Based on AVERAGE one-day move over last 2 quarters: 29.23 to 31.77
Based on MAXIMUM one-day move over last 2 Q’s (6.8%): 28.43 to 35.27
Based on UP max only (+1.5%): 30.97
Open to requests for other symbols.
#Earnings $REGN reports tomorrow morning. Below are details on earnings one-day moves over the last 12 quarters.
Aug. 6, 2019 BO +0.23%
May 7, 2019 BO -6.34% Biggest DOWN
Feb. 6, 2019 BO -3.43%
Nov. 6, 2018 BO +0.75%
Aug. 2, 2018 BO +6.99% Biggest UP
May 3, 2018 BO -1.25%
Feb. 8, 2018 BO -3.58%
Nov. 8, 2017 BO +2.66%
Aug. 3, 2017 BO -2.03%
May 4, 2017 BO +6.70%
Feb. 9, 2017 BO +1.91%
Nov. 4, 2016 BO +1.60%
Avg (+ or -) 3.12%
Bias 0.35%, slight positive bias on earnings.
With stock at 312.50 the data suggests these ranges:
Based on current IV (expected move into Friday per TOS): 296.19 to 328.81
Based on AVERAGE one-day move over last 12 quarters: 302.74 to 322.26
Based on MAXIMUM one-day move over last 12 Q’s (7.0%): 290.66 to 334.34
Based on DOWN max only (-6.3%): 292.69
Open to requests for other symbols.
#SPX1dte This rally is fierce; about the time I decide to stop selling the call side will probably mark the top.
Bought to close $SPX Nov 4th 3090 calls for 1.85. Looking to sell the 3100 calls to lessen the loss.
Condors sold Friday for .45
#VXXGame Closed second batch of my $VXX Jan 2020 20 puts, sold for 3.00. Bought between Jan 22 and Aug 27, avg price 1.30. Still holding several more.
#SPX1dte Sold to Open $SPX Nov 4th 3020/3030-3090/3100 condors for .45. 10-wide, double size position.
IV 5.70%, SPX 3062.

Link to calendar: https://us.econoday.com/byweek.asp?day=4&month=11&year=2019&cust=us&lid=0
#SPX1dte $SPX 3065 short calls closed for 1.75. Stop breached at the open, but couldn’t get enough pull back. Closed before ISM number hits at top of hour. Condors sold yesterday for 1.05.
#Jobs — higher than expected, given GM strike, plus upward revisions of Aug & Sept
+128,000 non-farm payroll jobs, vs. 75K expected
Unemployment at 3.6%, up by .01%
U6 unemployment at 7.0%, up by 0.1%
Wages up 0.2%, to 3.0% year over year
Labor force participation 63.3%, up by .01%
September revised up from 136K to 180K
August revised up from 158K to 219K
#SPX1dte Sold to Open $SPX Nov 1st 2970/2990-3065/3085 condors for 1.05. IV 11.62%, SPX 3029.
Slightly bullish lean, considering Upside Warning still in effect and today’s pullback. Short call delta .04, short put delta .09.
Expiring today: Oct 31st 2995/3005-3070/3080, sold yesterday for .45
#Earnings $X reports tonight. Below are details on earnings one-day moves over the last 12 quarters.
Aug. 1, 2019 AC -8.60%
May 3, 2019 BO +17.30% Biggest UP
Jan. 30, 2019 AC +1.44%
Nov. 1, 2018 AC +2.94%
Aug. 1, 2018 AC -10.27%
April 26, 2018 AC -14.13%
Jan. 31, 2018 AC -2.11%
Oct. 31, 2017 AC +7.81%
July 25, 2017 AC +7.20%
April 25, 2017 AC -26.77% Biggest DOWN
Jan. 31, 2017 AC -4.21%
Nov. 1, 2016 AC -4.75%
Avg (+ or -) 8.96%
Bias -2.85%, negative bias on earnings.
With stock at 11.50 the data suggests these ranges:
Based on current IV (expected move into Friday per TOS): 10.60 to 12.40
Based on AVERAGE one-day move over last 12 quarters: 10.47 to 12.53
Based on MAXIMUM one-day move over last 12 Q’s (-26.8%): 8.42 to 14.58
Based on UP max only (+17.3%): 13.49
Open to requests for other symbols.
#Earnings $BABA reports tomorrow morning. Below are details on earnings one-day moves over the last 12 quarters.
Aug. 15, 2019 BO +3.02%
May 15, 2019 BO +1.57%
Jan. 30, 2019 BO +6.33% Biggest UP
Nov. 2, 2018 BO -2.41%
Aug. 23, 2018 BO -3.15%
May 4, 2018 BO +3.52%
Feb. 1, 2018 BO -5.90% Biggest DOWN
Nov. 2, 2017 BO -0.68%
Aug. 17, 2017 BO +2.77%
May 18, 2017 BO +0.45%
Jan. 24, 2017 BO +3.06%
Nov. 2, 2016 BO -2.60%
Avg (+ or -) 2.96%
Bias 0.50%, positive bias on earnings.
With stock at 176.00 the data suggests these ranges:
Based on current IV (expected move into Friday per TOS): 169.14 to 182.86
Based on AVERAGE one-day move over last 12 quarters: 170.80 to 181.20
Based on MAXIMUM one-day move over last 12 Q’s (6.3%): 164.86 to 187.14
Based on DOWN max only (-5.9%): 165.62
Open to requests for other symbols.
#Earnings . Sold to close $FB Nov01/Nov08 187.5 #DoubleCalendar for 2.10. Bought yesterday for 1.00.
#Earnings $ANET reports tonight. Below are details on earnings one-day moves over the last 12 quarters.
Aug. 1, 2019 AC -10.32%
May 2, 2019 AC -10.43%
Feb. 14, 2019 AC +9.62%
Nov. 1, 2018 AC +6.97%
Aug. 2, 2018 AC -5.26%
May 3, 2018 AC -8.51%
Feb. 15, 2018 AC -18.98% Biggest DOWN
Nov. 2, 2017 AC +11.21%
Aug. 3, 2017 AC +19.43% Biggest UP
May 4, 2017 AC +3.22%
Feb. 16, 2017 AC +18.85%
Nov. 3, 2016 AC +1.49%
Avg (+ or -) 10.36%
Bias 1.44%, positive bias on earnings.
With stock at 246.50 the data suggests these ranges:
Based on current IV (expected move into Friday per TOS): 227.65 to 265.35
Based on AVERAGE one-day move over last 12 quarters: 220.97 to 272.03
Based on MAXIMUM one-day move over last 12 Q’s (19.4%): 198.61 to 294.39
Based on DOWN max only (-19.0%): 199.71
Open to requests for other symbols.
#SPX1dte Sold to Open $SPX Oct 31st 2995/3005-3070/3080. Ten-wide, double size. IV: 9.09%, SPX 3045.
Expiring: Oct 30th 2980/3000-3065/3085, sold yesterday for 1.15.
#VXXGame This is the first closing of my $VXX Jan 2020 20 puts, sold for 2.65. Bought between Jan 22 and Aug 27, avg price 1.30. Still holding several more.
#Earnings Sold to close $EA Nov01/Nov08 90.5 #DoubleCalendars for 1.19 & 1.20. Bought yesterday for .49 and .50.
#Earnings Bought to open $FB Nov01/Nov08 187.5 #DoubleCalendar for 1.00.
#Earnings $WDC reports tonight. Below are details on earnings one-day moves over the last 12 quarters.
July 31, 2019 AC +3.00%
April 29, 2019 AC +1.28%
Jan. 24, 2019 AC +7.52% Biggest UP
Oct. 25, 2018 AC -18.18% Biggest DOWN
July 26, 2018 AC -7.73%
April 26, 2018 AC -7.99%
Jan. 25, 2018 AC +1.82%
Oct. 26, 2017 AC -2.53%
July 27, 2017 AC -7.54%
April 27, 2017 AC +3.92%
Jan. 25, 2017 AC -1.93%
Oct. 26, 2016 AC +5.41%
Avg (+ or -) 5.74%
Bias -1.91%, negative bias on earnings.
With stock at 62.50 the data suggests these ranges:
Based on current IV (expected move into Friday per TOS): 58.27 to 66.73
Based on AVERAGE one-day move over last 12 quarters: 58.91 to 66.09
Based on MAXIMUM one-day move over last 12 Q’s (18.2%): 51.14 to 73.86
Based on UP max only (+7.5%): 67.20
Open to requests for other symbols.
#Earnings Sold to close $HLF Nov01/Nov08 40.5 #DoubleCalendar for .22. Bought yesterday for .38. It’s running higher with no intention of stopping…. grabbed what’s available before it gets to zero.
#Earnings $FB reports tonight. Below are details on earnings one-day moves over the last 12 quarters.
July 24, 2019 AC -1.93%
April 24, 2019 AC +5.84%
Jan. 30, 2019 AC +10.81% Biggest UP
Oct. 30, 2018 AC +3.80%
July 25, 2018 AC -18.96% Biggest DOWN
April 25, 2018 AC +9.06%
Jan. 31, 2018 AC +3.31%
Nov. 1, 2017 AC -2.04%
July 26, 2017 AC +2.91%
May 3, 2017 AC -0.62%
Feb. 1, 2017 AC -1.79%
Nov. 2, 2016 AC -5.63%
Avg (+ or -) 5.56%
Bias 0.40%, small positive bias on earnings.
With stock at 188.00 the data suggests these ranges:
Based on current IV (expected move into Friday per TOS): 175.88 to 200.12
Based on AVERAGE one-day move over last 12 quarters: 177.55 to 198.45
Based on MAXIMUM one-day move over last 12 Q’s (19.0%): 152.36 to 223.64
Based on UP max only (+10.8%): 208.32
Open to requests for other symbols.
#Earnings $AAPL reports tonight. Below are details on earnings one-day moves over the last 12 quarters.
July 30, 2019 AC +2.04%
April 30, 2019 AC +4.90%
Jan. 29, 2019 AC +6.83% Biggest UP
Nov. 1, 2018 AC -6.63% Biggest DOWN
July 31, 2018 AC +5.89%
May 1, 2018 AC +4.41%
Feb. 1, 2018 AC -4.33%
Nov. 2, 2017 AC +2.61%
Aug. 1, 2017 AC +4.72%
May 2, 2017 AC -0.30%
Jan. 31, 2017 AC +6.09%
Oct. 25, 2016 AC -2.24%
Avg (+ or -) 4.25%
Bias 2.00%, positive bias on earnings.
With stock at 242.50 the data suggests these ranges:
Based on current IV (expected move into Friday per TOS): 231.15 to 253.85
Based on AVERAGE one-day move over last 12 quarters: 232.20 to 252.80
Based on MAXIMUM one-day move over last 12 Q’s (6.8%): 225.94 to 259.06
Based on DOWN max only (-6.6%): 226.42
Open to requests for other symbols.
#SPX1dte Sold $SPX Oct 30th 2980/3000-3065/3085 condors for 1.10. IV 10.62%, SPX 3038.
IV and premium slightly higher due to FOMC tomorrow, I’m guessing.
#Earnings $HLF reports tonight. Below are details on earnings one-day moves over the last 12 quarters.
Aug. 1, 2019 AC -6.77% Biggest DOWN
May 2, 2019 AC -4.51%
Feb. 19, 2019 AC -2.01%
Oct. 30, 2018 AC -2.61%
Aug. 1, 2018 AC +13.03% Biggest UP
May 3, 2018 AC +4.47%
Feb. 22, 2018 AC +3.00%
Nov. 2, 2017 AC -2.92%
Aug. 1, 2017 AC -1.95%
May 4, 2017 AC +11.57%
Feb. 23, 2017 AC -4.51%
Nov. 1, 2016 AC -6.19%
Avg (+ or -) 5.30%
Bias 0.05%, no significant bias on earnings.
With stock at 40.40 the data suggests these ranges:
Based on current IV (expected move into Friday per TOS): 36.92 to 43.88
Based on AVERAGE one-day move over last 12 quarters: 38.26 to 42.54
Based on MAXIMUM one-day move over last 12 Q’s (13.0%): 35.14 to 45.66
Based on DOWN max only (-6.8%): 37.66
Open to requests for other symbols.
#Earnings $EA reports tonight. Below are details on earnings one-day moves over the last 12 quarters.
July 30, 2019 AC +4.43%
May 7, 2019 AC +1.24%
Feb. 5, 2019 AC -13.30% Biggest DOWN
Oct. 30, 2018 AC -4.05%
July 26, 2018 AC -5.70%
May 8, 2018 AC +5.74%
Jan. 30, 2018 AC +6.95%
Oct. 31, 2017 AC -4.28%
July 27, 2017 AC +0.55%
May 9, 2017 AC +12.65% Biggest UP
Jan. 31, 2017 AC -0.51%
Nov. 1, 2016 AC +1.64%
Avg (+ or -) 5.09%
Bias 0.45%, positive bias on earnings.
With stock at 95.00 the data suggests these ranges:
Based on current IV (expected move into Friday per TOS): 88.42 to 101.58
Based on AVERAGE one-day move over last 12 quarters: 90.17 to 99.83
Based on MAXIMUM one-day move over last 12 Q’s (13.3%): 82.37 to 107.64
Based on UP max only (+12.7%): 107.02
Open to requests for other symbols.
#Earnings $AMD reports tonight. Below are details on earnings one-day moves over the last 12 quarters.
July 30, 2019 AC -10.09%
April 30, 2019 AC -2.96%
Jan. 29, 2019 AC +19.94% Biggest UP
Oct. 24, 2018 AC -15.44%
July 25, 2018 AC +14.33%
April 25, 2018 AC +13.69%
Jan. 30, 2018 AC +6.75%
Oct. 24, 2017 AC -13.47%
July 25, 2017 AC +4.60%
May 1, 2017 AC -24.22% Biggest DOWN
Jan. 31, 2017 AC +16.29%
Oct. 20, 2016 AC -6.32%
Avg (+ or -) 12.34%
Bias 0.26%, no significant bias on earnings.
With stock at 33.00 the data suggests these ranges:
Based on current IV (expected move into Friday per TOS): 29.76 to 36.24
Based on AVERAGE one-day move over last 12 quarters: 28.93 to 37.07
Based on MAXIMUM one-day move over last 12 Q’s (24.2%): 25.01 to 40.99
Based on UP max only (+19.9%): 39.58
Open to requests for other symbols.
#Earnings $BYND reports tomorrow morning. Below are details on earnings one-day moves over its entire history, only 2 quarters.
July 29, 2019 AC -12.32%
June 6, 2019 AC +39.34%
Avg (+ or -) 25.83%
Bias 13.51%, positive bias on earnings.
With stock at 101.75 the data suggests these ranges:
Based on current IV (expected move into Friday per TOS): 84.00 to 119.50
Based on AVERAGE one-day move over last 2 quarters: 75.47 to 128.03
Based on MAXIMUM one-day move over last 12 Q’s (39.3%): 61.72 to 141.78
Based on DOWN max only (-12.3%): 89.21
Open to requests for other symbols.
#Earnings $GOOGL reports tomorrow morning. Below are details on earnings one-day moves over the last 12 quarters.
July 25, 2019 AC +9.62% Biggest UP
April 29, 2019 AC -7.50% Biggest DOWN
Feb. 4, 2019 AC +0.91%
Oct. 25, 2018 AC -1.79%
July 23, 2018 AC +3.89%
April 23, 2018 AC -4.76%
Feb. 1, 2018 AC -5.28%
Oct. 26, 2017 AC +4.26%
July 24, 2017 AC -2.93%
April 27, 2017 AC +3.71%
Jan. 26, 2017 AC -1.39%
Oct. 27, 2016 AC +0.27%
Avg (+ or -) 3.86%
Bias -0.08%, no significant bias on earnings.
With stock at 1,295.00 the data suggests these ranges:
Based on current IV (expected move into Friday per TOS): 1,234.29 to 1,355.71
Based on AVERAGE one-day move over last 12 quarters: 1,245.02 to 1,344.98
Based on MAXIMUM one-day move over last 12 Q’s (9.6%): 1,170.42 to 1,419.58
Based on DOWN max only (-7.5%): 1,197.88
Open to requests for other symbols.
#SPX1dte Issue finally resolved and orders went through. Lucky for all of us, SPX moved in a straight line while this was happening. Otherwise, there would have been millions of dollars of claims against IB. I imagine there still will be a mess, but fortunately I got out for less that I originally would have.
Bought to close $SPX Oct 28th 3045 calls for 1.60. Condors sold for .45 on Friday.
I’m going to look for a spike higher to sell the 3055 long calls.
#SPX1dte . I’m unable to trade on $SPX with Interactive Brokers. I have passed my stop level, trying to close the calls on my 1-dte. Been on the phone, but they say there’s an issue with the exchange and they can’t get any orders through. This should be interesting.
#SPX1dte Sold $SPX Oct 28th 2975/2985-3045/3055 condors for .45, 10-wide, double size, IV 5.80%, SPX 3021.
Expiring, Oct 25th 2950/2970-3030/3050, sold yesterday for .80.
