
#Earnings . Bought to Open $ACN Dec20/Dec27 202.5 #DoubleCalendar for .55. Only partial fill. Probably need to bid higher now to get filled.
Author Archives: Jeff
ACN earnings analysis
#Earnings $ACN reports tomorrow morning. Below are details on earnings one-day moves over the last 12 quarters.
Sept. 26, 2019 BO +0.65%
June 27, 2019 BO -0.16%
March 28, 2019 BO +5.19%
Dec. 20, 2018 BO -4.94%
Sept. 27, 2018 BO -1.68%
June 28, 2018 BO +5.89% Biggest UP
March 22, 2018 BO -7.28% Biggest DOWN
Dec. 21, 2017 BO +1.61%
Sept. 28, 2017 BO -0.23%
June 22, 2017 BO -3.95%
March 23, 2017 BO -4.52%
Dec. 21, 2016 BO -4.99%
Avg (+ or -) 3.42%
Bias -1.20%, negative bias on earnings.
With stock at 204.00 the data suggests these ranges:
Based on current IV (expected move into Friday per TOS): 195.74 to 212.26
Based on AVERAGE one-day move over last 12 quarters: 197.01 to 210.99
sed on MAXIMUM one-day move over last 12 Q’s (7.3%): 189.15 to 218.85
Based on UP max only (+5.9%): 216.02
Open to requests for other symbols.
MU earnings analysis
#Earnings $MU reports tonight. Below are details on earnings one-day moves over the last 12 quarters.
Sept. 26, 2019 AC -11.09% Biggest DOWN
June 25, 2019 AC +13.34% Biggest UP
March 20, 2019 AC +9.61%
Dec. 18, 2018 AC -7.91%
Sept. 20, 2018 AC -2.86%
June 20, 2018 AC +0.83%
March 22, 2018 AC -7.99%
Dec. 19, 2017 AC +4.02%
Sept. 26, 2017 AC +8.51%
June 29, 2017 AC -5.11%
March 23, 2017 AC +7.40%
Dec. 21, 2016 AC +12.68%
Avg (+ or -) 7.61%
Bias 1.79%, positive bias on earnings.
With stock at 53.00 the data suggests these ranges:
Based on current IV (expected move into Friday per TOS): 49.56 to 56.44
Based on AVERAGE one-day move over last 12 quarters: 48.97 to 57.03
sed on MAXIMUM one-day move over last 12 Q’s (13.3%): 45.93 to 60.07
Based on DOWN max only (-11.1%): 47.12
Open to requests for other symbols.
SPX 1-dte
#SPX1dte Sold $SPX Dec 18th 3150/3170-3220/3240 condors for .80, IV 7.89%, SPX 3195.
Since Upside Warning s firing today, this leans bullish, with usual .06 delat on call side but .10 on put side.
FDX dub cal
#Earnings Bought to Open $FDX Dec20/Dec27 162.5 #DoubleCalendar for .85.
FDX earnings analysis
#Earnings $FDX reports tonight. Below are details on earnings one-day moves over the last 12 quarters.
Sept. 17, 2019 AC -12.91% Biggest DOWN
June 25, 2019 AC +2.52%
March 19, 2019 AC -3.49%
Dec. 18, 2018 AC -12.16%
Sept. 17, 2018 AC -5.53%
June 19, 2018 AC -2.69%
March 20, 2018 AC -1.17%
Dec. 19, 2017 AC +3.51% Biggest UP
Sept. 19, 2017 AC +2.08%
June 20, 2017 AC +1.60%
March 21, 2017 AC +2.12%
Dec. 20, 2016 AC -3.33%
Avg (+ or -) 4.43%
Bias -2.45%, negative bias on earnings.
With stock at 162.50 the data suggests these ranges:
Based on current IV (expected move into Friday per TOS): 150.97 to 174.03
Based on AVERAGE one-day move over last 12 quarters: 155.31 to 169.69
sed on MAXIMUM one-day move over last 12 Q’s (12.9%): 141.52 to 183.48
Based on UP max only (+3.5%): 168.20
Open to requests for other symbols.
SPX 6-dte
#SPX1dte In honor of likely Upside Warning: Sold $SPX Dec 23rd 3160/3135 put spreads for 2.00.
I saw Santa kissing 3200
#VIXIndicator An Upside Warning will go into effect Tuesday with a VIX close at 12.82 or lower.
SPX closed
#SPX1dte BTC $SPX Dec 16th 3200 calls for .20. Condors sold for .80 on Friday.
AXSM
#ShortPuts Followed @optioniceman with the high vol stock that @330nick found
Sold $AXSM Dec 20th 25 puts for 1.70
Sold $AXSM Dec 20th 22.5 puts for 1.35
Don’t do these wild ones much anymore, but the low stock price limits the risk.
SPX 1-dte
#SPX1dte Sold to Open $SPX Dec 16th 3090/3110-3200/3220 condors for .80. IV 9.21%, SPX 3168.
Expiring: Dec 13th 3090/3110-3205/3225 condors, sold yesterday for .80.
Econ Calendar for week of 12/16/19
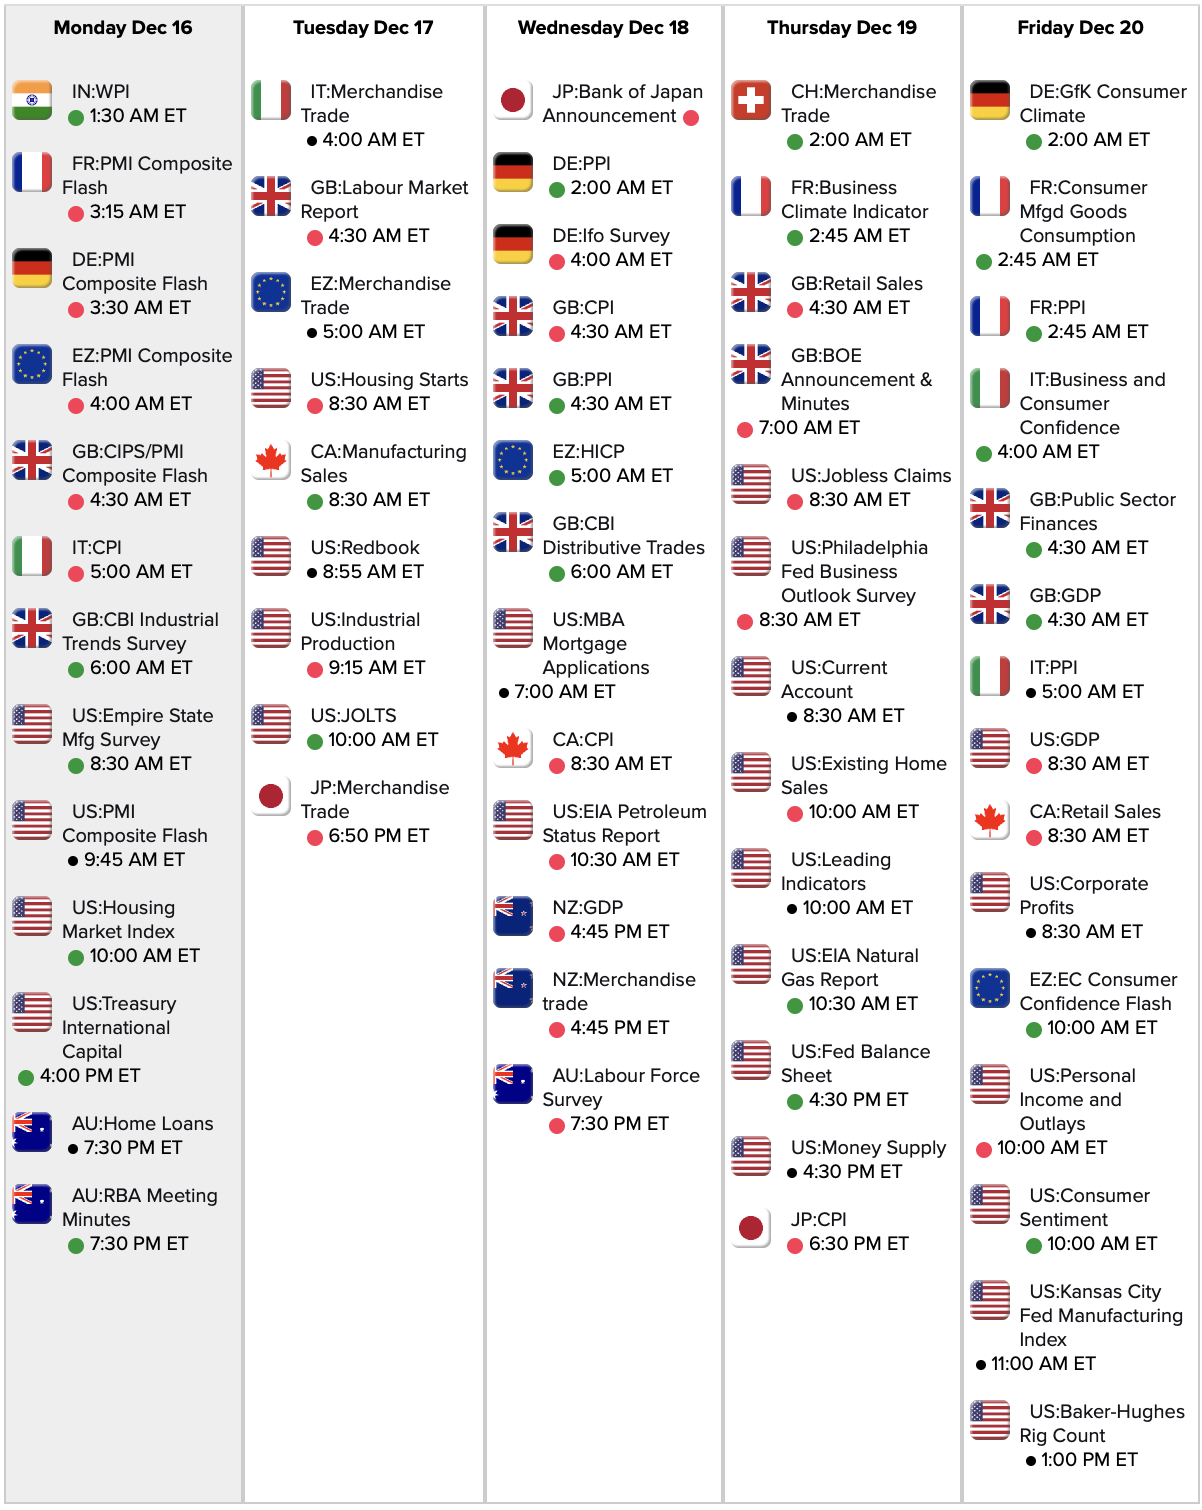

Link to calendar: https://research.investors.com/economic-calendar/
COST earnings analysis
#Earnings $COST reports tonight. Below are details on earnings one-day moves over the last 12 quarters.
Oct. 3, 2019 AC +0.92%
May 30, 2019 AC -0.81%
March 7, 2019 AC +5.08% Biggest UP
Dec. 13, 2018 AC -8.58% Biggest DOWN
Oct. 4, 2018 AC -5.55%
May 31, 2018 AC -0.55%
March 7, 2018 AC -0.89%
Dec. 14, 2017 AC +3.32%
Oct. 5, 2017 AC -5.97%
May 25, 2017 AC +1.79%
March 2, 2017 AC -4.33%
Dec. 7, 2016 AC +2.43%
Avg (+ or -) 3.35%
Bias -1.10%, negative bias on earnings.
With stock at 297.50 the data suggests these ranges:
Based on current IV (expected move into Friday per TOS): 287.83 to 307.17
Based on AVERAGE one-day move over last 12 quarters: 287.53 to 307.47
sed on MAXIMUM one-day move over last 12 Q’s (-8.6%): 271.97 to 323.03
Based on UP max only (+5.1%): 312.61
Open to requests for other symbols.
SPX 1-dte
#SPX1dte Sold to Open $SPX Dec 13th 3090/3110-3205/3225 condors for .80. IV: 12.95%, SPX 3167
SPX calls stopped
#SPX1dte BTC $SPX Dec 16th 3200/3225 call spreads for 1.80. Condors sold for 1.75 on Monday. I’ll look to close the puts before the weekend.
ADBE earnings analysis
#Earnings $ADBE reports tonight. Below are details on earnings one-day moves over the last 12 quarters.
Sept. 17, 2019 AC -1.74%
June 18, 2019 AC +5.21% Biggest UP
March 14, 2019 AC -3.95%
Dec. 13, 2018 AC -7.28% Biggest DOWN
Sept. 13, 2018 AC +2.29%
June 14, 2018 AC -2.43%
March 15, 2018 AC +3.05%
Dec. 14, 2017 AC +1.43%
Sept. 19, 2017 AC -4.24%
June 20, 2017 AC +2.36%
March 16, 2017 AC +3.80%
Dec. 15, 2016 AC -1.47%
Avg (+ or -) 3.27%
Bias -0.25%, negative bias on earnings.
With stock at 304.00 the data suggests these ranges:
Based on current IV (expected move into Friday per TOS): 293.08 to 314.92
Based on AVERAGE one-day move over last 12 quarters: 295.02 to 314.98
sed on MAXIMUM one-day move over last 12 Q’s (7.3%): 282.80 to 327.20
Based on UP max only (+5.2%): 320.89
Open to requests for other symbols.
AVGO earnings analysis
#Earnings $AVGO reports tonight. Below are details on earnings one-day moves over the last 12 quarters.
Sept. 12, 2019 AC -3.41%
June 13, 2019 AC -5.56% Biggest DOWN
March 14, 2019 AC +8.23%
Dec. 6, 2018 AC +0.58%
Sept. 6, 2018 AC +7.69%
June 7, 2018 AC -2.53%
March 15, 2018 AC -4.81%
Dec. 6, 2017 AC 0.00%
Aug. 24, 2017 AC -3.70%
June 1, 2017 AC +8.49% Biggest UP
March 1, 2017 AC +0.99%
Dec. 8, 2016 AC +4.90%
Avg (+ or -) 4.24%
Bias 0.91%, positive bias on earnings.
With stock at 327.50 the data suggests these ranges:
Based on current IV (expected move into Friday per TOS): 312.80 TOO 342.20
Based on AVERAGE one-day move over last 12 quarters: 313.61 TO 341.39
sed on MAXIMUM one-day move over last 12 Q’s (8.5%): 299.70 TO 355.30
Based on DOWN max only (-5.6%): 309.29
Open to requests for other symbols.
AEO closed
#Earnings BTC $AEO Dec 13th 15 put for .50. #LongStraddle sold for 1.35 on Tuesday. Closed for a total of .55.
Downside Warning canceled
#VIXIndicator The Downside Warning is officially canceled as the SPX notched a new all-time high. However, this high was driven by a tweet that we humans understand, based on recent history, really doesn’t mean anything. The algos respond and drive us higher. If no trade deal is reached by Sunday, or there’s no agreement to delay the tariffs, we could re-enter a Downside Warning quickly and easily.
My opinion: I don’t think a trade deal will be reached until after the election. However, I do think the tariffs will be delayed. I don’t know how that will affect the markets, but Monday we could be anywhere.
SPXpire
#SPX1dte Expired today: $SPX Dec 11th 3075/3095-3160/3180 condors, sold yesterday for 1.05.
IV and premium high this week due to Sunday’s tariff deadline. I have a 7-dte expiring Monday that has not changed in price despite two days passing and no movement in SPX.
CIEN earnings analysis
#Earnings $CIEN reports tomorrow morning. Below are details on earnings one-day moves over the last 12 quarters.
Sept. 5, 2019 BO -3.83%
June 6, 2019 BO +26.78% Biggest UP
March 5, 2019 BO -4.88%
Dec. 13, 2018 BO +8.61%
Aug. 30, 2018 BO +12.44%
May 31, 2018 BO -4.19%
March 6, 2018 BO +10.05%
Dec. 7, 2017 BO -1.93%
Aug. 31, 2017 BO -10.96% Biggest DOWN
June 1, 2017 BO +15.80%
March 8, 2017 BO -8.40%
Dec. 8, 2016 BO +15.13%
Avg (+ or -) 10.25%
Bias 4.55%, positive bias on earnings.
With stock at 35.50 the data suggests these ranges:
Based on current IV (expected move into Friday per TOS): 32.28 to 38.72
Based on AVERAGE one-day move over last 12 quarters: 31.86 to 39.14
Based on MAXIMUM one-day move over last 12 Q’s (26.8%): 25.99 to 45.01
Based on DOWN max only (-11.0%): 31.61
Open to requests for other symbols.
AEO closing
#Earnings BTC $AEO Dec 13th 15 calls for .05. Holding puts for a spike higher. Sold #LongStraddle for 1.35 yesterday.
LULU earnings analysis
#Earnings $LULU reports tonight. Below are details on earnings one-day moves over the last 12 quarters.
Sept. 5, 2019 AC +7.81%
June 12, 2019 AC +2.12%
March 27, 2019 AC +14.12%
Dec. 6, 2018 AC -13.36%
Aug. 30, 2018 AC +13.08%
May 31, 2018 AC +16.31% Biggest UP
March 27, 2018 AC +9.21%
Dec. 6, 2017 AC +6.42%
Aug. 31, 2017 AC +7.19%
June 1, 2017 AC +11.54%
March 29, 2017 AC -23.43% Biggest DOWN
Dec. 7, 2016 AC +15.04%
Avg (+ or -) 11.64%
Bias 5.50%, positive bias on earnings.
With stock at 230.00 the data suggests these ranges:
Based on current IV (expected move into Friday per TOS): 212.70 to 247.30
Based on AVERAGE one-day move over last 12 quarters: 203.24 to 256.76
sed on MAXIMUM one-day move over last 12 Q’s (23.4%): 176.11 to 283.89
Based on UP max only (+16.3%): 267.51
Open to requests for other symbols.
DRIP closed
#ContangoETFs . Just noticed I was filled yesterday:
BTC $DRIP Jan 17th 150 calls for .45. Sold for 4.50 on Dec 3rd.
AEO straddle
#Earnings Sold to Open $AEO Dec 11th 15 #LongStraddle for 1.35. Needs over an 11% move before losses; avg move has been 6.6%.
SPX 1-dte
#SPX1dte Sold to Open $SPX Dec 11th 3075/3095-3160/3180 condors for 1.05. IV: 10.67%, SPX 3136.
AEO earnings analysis
#Earnings $AEO reports tomorrow morning. Below are details on earnings one-day moves over the last 12 quarters.
Sept. 4, 2019 BO -11.61%
June 5, 2019 BO +0.10%
March 6, 2019 AC -0.37%
Dec. 11, 2018 AC +2.94%
Aug. 29, 2018 BO -6.52%
May 31, 2018 BO -1.81%
March 8, 2018 BO -9.43%
Dec. 6, 2017 BO +2.42%
Aug. 23, 2017 BO +7.76% Biggest UP
May 17, 2017 BO -14.73% Biggest DOWN
March 1, 2017 BO -9.52%
Nov. 30, 2016 BO -12.42%
Avg (+ or -) 6.64%
Bias -4.43%, strongly negative bias on earnings.
With stock at 15.30 the data suggests these ranges:
Based on current IV (expected move into Friday per TOS): 13.90 to 16.70
Based on AVERAGE one-day move over last 12 quarters: 14.28 to 16.32
sed on MAXIMUM one-day move over last 12 Q’s (14.7%): 13.05 to 17.55
Based on UP max only (+7.8%): 16.49
Open to requests for other symbols.
PLCE earnings analysis
#Earnings $PLCE reports tomorrow morning. Below are details on earnings one-day moves over the last 12 quarters.
Aug. 21, 2019 BO -2.44%
May 15, 2019 BO -6.90%
March 5, 2019 BO +5.70%
Dec. 6, 2018 BO -13.38% Biggest DOWN
Aug. 23, 2018 BO -1.27%
May 17, 2018 BO -7.94%
March 20, 2018 BO -7.91%
Nov. 15, 2017 BO +5.92%
Aug. 9, 2017 BO -4.57%
May 18, 2017 BO -0.44%
March 8, 2017 BO +18.26% Biggest UP
Nov. 17, 2016 BO +13.24%
Avg (+ or -) 7.33%
Bias -0.14%, no significant bias on earnings.
With stock at 69.50 the data suggests these ranges:
Based on current IV (expected move into Friday per TOS): 61.31 to 77.69
Based on AVERAGE one-day move over last 12 quarters: 64.41 to 74.59
sed on MAXIMUM one-day move over last 12 Q’s (18.3%): 56.81 to 82.19
Based on DOWN max only (-13.4%): 60.20
Open to requests for other symbols.
SPX 7-dte
#SPX1dte Sold to Open $SPX Dec 16th 2985/3010-3200/3225 condors for 1.75, IV 14.25%, SPX 3142.
Expiring today:
Dec 9th 3095/3105-3175/3185 condors, sold Friday for .45
Dec 9th 3190/3215 call spreads, sold in a condor last Monday, put side was rolled to:
Dec 9th 3150/3175 call spreads, sold Tuesday for 1.60
MDB earnings analysis
#Earnings $MDB reports tonight. Below are details on earnings one-day moves over its entire history (8 quarters).
Sept. 4, 2019 AC -5.18% Biggest DOWN
June 5, 2019 AC -0.75%
March 13, 2019 AC +25.58% Biggest UP
Dec. 4, 2018 AC +8.37%
Sept. 5, 2018 AC +9.17%
June 6, 2018 AC -3.27%
March 13, 2018 AC +7.42%
Dec. 12, 2017 AC -5.68%
Avg (+ or -) 8.18%
Bias 4.46%, positive bias on earnings.
With stock at 133.00 the data suggests these ranges:
Based on current IV (expected move into Friday per TOS): 120.31 to 145.69
Based on AVERAGE one-day move over last 12 quarters: 122.12 to 143.88
sed on MAXIMUM one-day move over last 12 Q’s (25.6%): 98.98 to 167.02
Based on DOWN max only (-5.7%): 125.45
Open to requests for other symbols.
AZO earnings analysis
#Earnings $AZO reports tomorrow morning. Below are details on earnings one-day moves over the last 12 quarters.
Sept. 24, 2019 BO -4.41%
May 21, 2019 BO +5.56%
Feb. 26, 2019 BO +5.10%
Dec. 4, 2018 BO +6.74% Biggest UP
Sept. 18, 2018 BO -1.97%
May 22, 2018 BO -9.48%
Feb. 27, 2018 BO -11.06% Biggest DOWN
Dec. 5, 2017 BO +0.42%
Sept. 19, 2017 BO -5.00%
May 23, 2017 BO -11.84%
Feb. 28, 2017 BO -0.58%
Dec. 6, 2016 BO +0.43%
Avg (+ or -) 5.22%
Bias -2.17%, negative bias on earnings.
With stock at 1177.50 the data suggests these ranges:
Based on current IV (expected move into Friday per TOS): 1121.65 to 1233.35
Based on AVERAGE one-day move over last 12 quarters: 1116.08 to 1238.92
sed on MAXIMUM one-day move over last 12 Q’s (11.8%): 1038.08 to 1316.92
Based on UP max only (+6.7%): 1256.86
Open to requests for other symbols.
SPX 1-dte
#SPX1dte Sold to Open $SPX Dec 9th 3095/3105-3175/3185 condors for .45. 10-wide, doiuble sized position. IV: 7.01%, SPX 3149.
SPX stop-loss
#SPX1dte BTC $SPX Dec 6th 3145 calls for 2.60. Condors sold yesterday for .80
Another Downside bust
#VIXIndicator Well, that’s two Downside Warnings in a row that turned out to be only one-day warnings for a brief intraday low, then rocket back to the skies. I’m going to keep tracking them, but include a notice that they have not always been working. Meanwhile, I will research the history to determine if there are any concurrent indicators that can distinguish between accurate and inaccurate warnings.
For 2019, the Warning on 4/5 was good; 8/1 was okay; but 10/2 and 12/2 were head fakes.
UBER strangle
#PerpetualRollingStrangles Sold to Open $UBER Jan 10th 25.5/31.5 strangles for .80
MRVL closed
#Earnings . BTC $MRVL Dec 6th 25 puts for .80. #LongStraddle sold for 1.65 on Tuesday. Closed for 1.00 total.
DRIP dropped
#ContangoETFs BTC $DRIP Dec 20th 115 calls for .80. Sold for 8.60 on July 23rd.
November Jobs Report
#Jobs — Blowout numbers
+266,000 non-farm payroll jobs, vs. 187K expected
Unemployment at 3.5%, down by 0.1%
U6 unemployment at 6.9%, down by 0.1%
Wages up 0.3%, to 3.1% year over year
Labor force participation 63.2%, down by .01%
October revised up from 128K to 156K
September revised up from 180K to 193K
SPX 1-dte
#SPX1dte Sold to Open $SPX 3055/3075-3145/3165 condors for .80. IV: 10.10%, SPX 3115.
Take FIVE
#Earnings BTC $FIVE Dec 6th 115 puts for .05. The 115/113 spreads sold for .763 (avg price) yesterday. Holding long 113 puts, expiration lottery ticket.
ULTA earnings analysis
#Earnings $ULTA reports tonight. Below are details on earnings one-day moves over the last 12 quarters.
Aug. 29, 2019 AC -29.55% Biggest DOWN
May 30, 2019 AC +1.50%
March 14, 2019 AC +8.28% Biggest UP
Dec. 6, 2018 AC -13.12%
Aug. 30, 2018 AC +6.37%
May 31, 2018 AC -0.71%
March 15, 2018 AC +7.63%
Nov. 30, 2017 AC -4.11%
Aug. 24, 2017 AC -9.13%
May 25, 2017 AC +3.19%
March 9, 2017 AC +4.62%
Dec. 1, 2016 AC -1.56%
Avg (+ or -) 7.48%
Bias -2.22%, negative bias on earnings.
With stock at 242.00 the data suggests these ranges:
Based on current IV (expected move into Friday per TOS): 219.79 to 264.21
Based on AVERAGE one-day move over last 12 quarters: 223.90 to 260.10
sed on MAXIMUM one-day move over last 12 Q’s (29.6%): 170.49 to 313.51
Based on UP max only (+8.3%): 262.04
Open to requests for other symbols.
SIG closed
#Earnings BTC $SIG Dec 6th 17 #LongStraddle for 1.75 (1.50 calls, .25 puts). Sold yesterday for 2.86.
SPX closed
#SPX1dte Bought to close $SPX Dec 4th 3120 calls for .20. Condors sold yesterday for .80.
SIG alert
#Earnings Sold to Open $SIG Dec 6th 17 #LongStraddle for 2.86. Stock must move over 16.7% to become a loser. Avg move has been 14.57%.
FIVE earnings analysis & trade
#Earnings $FIVE reports tonight. Below are details on earnings one-day moves over the last 12 quarters.
Aug. 28, 2019 AC +6.27%
June 5, 2019 AC -1.00%
March 27, 2019 AC +8.15%
Dec. 6, 2018 BO -2.66%
Sept. 6, 2018 AC +13.31%
June 6, 2018 AC +21.86% Biggest UP
March 21, 2018 AC +4.20%
Nov. 30, 2017 AC -0.46%
Aug. 30, 2017 AC -3.45% Biggest DOWN
June 1, 2017 AC +0.50%
March 22, 2017 AC +10.80%
Dec. 1, 2016 AC +9.87%
Avg (+ or -) 6.88%
Bias 5.62%, robustly positive bias on earnings.
With stock at 117.00 the data suggests these ranges:
Based on current IV (expected move into Friday per TOS): 107.13 to 126.87
Based on AVERAGE one-day move over last 12 quarters: 108.95 to 125.05
sed on MAXIMUM one-day move over last 12 Q’s (21.9%): 91.42 to 142.58
Based on DOWN max only (-3.5%): 112.96
Open to requests for other symbols.
SIG earnings analysis
#Earnings $SIG reports tomorrow morning. Below are details on earnings one-day moves over the last 12 quarters.
Sept. 5, 2019 BO +26.88% Biggest UP
June 6, 2019 BO -1.23%
April 3, 2019 BO +0.54%
Dec. 6, 2018 BO -18.04%
Aug. 30, 2018 BO +23.84%
June 6, 2018 BO +18.39%
March 14, 2018 BO -20.22%
Nov. 21, 2017 BO -30.39% Biggest DOWN
Aug. 24, 2017 BO +16.66%
May 25, 2017 BO -7.75%
March 9, 2017 BO +8.72%
Nov. 22, 2016 BO +2.14%
Avg (+ or -) 14.57%
Bias 1.63%, positive bias on earnings.
With stock at 16.50 the data suggests these ranges:
Based on current IV (expected move into Friday per TOS): 13.80 to 19.20
Based on AVERAGE one-day move over last 12 quarters: 14.10 to 18.90
sed on MAXIMUM one-day move over last 12 Q’s (30.4%): 11.49 to 21.51
Based on UP max only (26.9%): 20.94
Open to requests for other symbols.
RH earnings analysis
#Earnings $RH reports tonight. Below are details on earnings one-day moves over the last 12 quarters.
Sept. 10, 2019 AC +5.07%
June 12, 2019 AC +15.82%
March 28, 2019 AC -21.96%
Dec. 3, 2018 AC +10.90%
Sept. 4, 2018 AC -13.06%
June 11, 2018 AC +30.54%
March 27, 2018 AC +22.48%
Dec. 5, 2017 AC +0.79%
Sept. 6, 2017 AC +44.75% Biggest UP
June 1, 2017 AC -25.69% Biggest DOWN
March 28, 2017 AC +14.94%
Dec. 8, 2016 AC -18.13%
Avg (+ or -) 18.68%
Bias 5.54%, positive bias on earnings.
With stock at 204.00 the data suggests these ranges:
Based on current IV (expected move into Friday per TOS): 181.93 to 226.07
Based on AVERAGE one-day move over last 12 quarters: 165.90 to 242.10
sed on MAXIMUM one-day move over last 12 Q’s (44.8%): 112.71 to 295.29
Based on DOWN max only (-25.7%): 151.59
Open to requests for other symbols.
MRVL straddle
#Earnings BTC $MRVL Dec 6th 25 calls for .20. #ShortStraddle sold yesterday for 1.65. Will close puts on the rebound.
SPX 7-dte stopped
#SPX1dte BTC $SPX Dec 9th 3025/3000 put spreads for 1.90, at the close. Condors sold yesterday for 1.75. Letting the 3190/3215 call side expire.
#ReverseRoll Sold $SPX Dec 9th 3150/3175 call spreads for 1.60. Believing there is more downside ahead, but will be wary of a big up day, which is always possible in volatile times.
SPX 1-dte
#SPX1dte Sold to Open $SPX Dec 4th 3010/3030-3120/3140 condors for .80, IV: 13.26%, SPX 3086
MRVL earnings analysis & trade
#Earnings $MRVL reports tonight. Below are details on earnings one-day moves over the last 12 quarters.
Aug. 29, 2019 AC -0.95%
May 30, 2019 AC +0.49%
March 7, 2019 AC -2.55%
Dec. 4, 2018 AC +3.80%
Sept. 6, 2018 AC -0.05%
May 31, 2018 AC +2.92%
March 8, 2018 AC +0.08%
Nov. 28, 2017 AC -4.55% Biggest DOWN
Aug. 24, 2017 AC +7.50%
May 25, 2017 AC +4.30%
March 2, 2017 AC +1.51%
Nov. 17, 2016 AC +10.77% Biggest UP
Avg (+ or -) 3.29%
Bias 1.94%, strong positive bias on earnings.
With stock at 25.00 the data suggests these ranges:
Based on current IV (expected move into Friday per TOS): 23.29 to 26.71
Based on AVERAGE one-day move over last 12 quarters: 24.18 to 25.82
sed on MAXIMUM one-day move over last 12 Q’s (10.8%): 22.31 to 27.69
Based on DOWN max only (-4.6%): 23.86
Open to requests for other symbols.
DRIP calls
#ContangoETFs At the highs this morning, Sold $DRIP Jan 17th 150 calls for 4.50.
CRM earnings analysis
#Earnings $CRM reports tonight. Below are details on earnings one-day moves over the last 12 quarters.
Aug. 22, 2019 AC +2.24%
June 4, 2019 AC +5.05%
March 4, 2019 AC -0.96%
Nov. 27, 2018 AC +10.27% Biggest UP
Aug. 29, 2018 AC -1.71%
May 29, 2018 AC +1.90%
Feb. 28, 2018 AC +2.73%
Nov. 21, 2017 AC -1.81% Biggest DOWN
Aug. 22, 2017 AC +0.12%
May 18, 2017 AC -0.39%
Feb. 28, 2017 AC +3.02%
Nov. 17, 2016 AC +3.43%
Avg (+ or -) 2.80%
Bias 1.99%, strong positive bias on earnings.
With stock at 160.00 the data suggests these ranges:
Based on current IV (expected move into Friday per TOS): 152.37 to 167.63
Based on AVERAGE one-day move over last 12 quarters: 155.52 to 164.48
sed on MAXIMUM one-day move over last 12 Q’s (10.3%): 143.57 to 176.43
Based on DOWN max only (-1.8%): 157.10
Open to requests for other symbols.
Downside Warning in effect
#VIXIndicator The $VIX close today was 14.91, which is over 25% higher than Wednesday’s close, triggering a Downside Warning. Based on past behavior, the chance for a further drop in the coming days or weeks is high. That said, the last one (on Oct 2nd) didn’t pan out, with only a slightly lower intraday low the next day, before cruising into record highs after that.
SPX closed
#SPX1dte BTC $SPX Dec 2nd 3115/3095 put spreads for .25. Sold Friday for .50.
Expiring: Dec 2nd 3165/3185 call spreads, sold Friday for .50
Upside Warning canceled
#VIXIndicator The intraday $VIX spike has canceled the Upside Warning, which had been in effect since Oct 16th.
SPX 7-dte
#SPX1dte Sold $SPX Dec 9th 3000/3025-3190/3215 condors for 1.70, IV 11.65%, Exp move: +/-43.12, SPX 3134.
Haven’t done a multi-dayer in a few weeks, and I’m going with .06-.08 delta range.
Econ Calendar for week of 12/2/19


SPX 1-dte
#SPX1dte Unsurprisingly, I got the intraday move exactly backwards. Was planning to sell call spread when index went higher, but instead I’m stuck selling it lower. Sold call side for .50, so now my trade for Monday is:
Sold $SPX Dec 2nd 3095/3115-3165/3185 condors for 1.00.
Expiring: Nov 29th 3135/3115 put spreads, sold Wednesday for .60.
NYSE Tick
TICK is not working today on TOS. Anyone else see this? Nothing after end of day Wednesday.
SPX 1-dte
#SPX1dte Sold $SPX Dec 2nd 3115/3095 put spreads for .50, IV 6.19%, SPX 3147.
Will sell call side on a move higher.
SPX roll
#SPX 1-dte . Buying to close $SPX Nov 29th 3165/3185 call spreads for .80. Condors sold for .85 this morning, so (hopefully) the .05 profit will cover commissions. If it doesn’t fill, I will have to up my bid.
#ReverseRoll Sold to Open Nov 29th 3135/3115 put spreads for .60.
ADSK closed
#Earnings Sold to close $ADSK Nov29/Dec06 170 #DoubleCalendar for .92. Bought for .65 yesterday.
Started the morning nicely, but looks like a runner.
SPX 1-dte
#SPX1dte Sold $SPX Nov 29th 3090/3110-3165/3185 condor for .85, IV 6.42%, SPX 3144.
Trying something different: selling in the morning so I can grab some premium before it evaporates. I don’t expect SPX to move too much in the next day and a half of holiday trading.
No SPX
Not enough premium so I did not sell #SPX1dte.
ADSK dub cal
#Earnings Bought to Open $ADSK Nov29/Dec06 170 #DoubleCalendar for .65. Had the order on for a couple hours… just filled on one. As has been the case with these trades, they can fill slowly as we near the bell.
Lower probability as ADSK has moved on earnings a fair amount. But most recent quarters has below average moves.
VMW reports tonight
#Earnings $VMW reports tonight. Below are details on earnings one-day moves over the last 12 quarters.
Aug. 22, 2019 AC -9.94%
May 30, 2019 AC -11.53% Biggest DOWN
Feb. 28, 2019 AC +3.71%
Nov. 29, 2018 AC +3.62%
Aug. 23, 2018 AC -2.19%
May 31, 2018 AC +6.14% Biggest UP
March 1, 2018 AC -5.91%
Nov. 30, 2017 AC +3.60%
Aug. 24, 2017 AC +1.89%
June 1, 2017 AC -2.09%
Jan. 26, 2017 AC +3.49%
Oct. 26, 2016 AC +3.35%
Avg (+ or -) 4.79%
Bias -0.49%, negative bias on earnings.
With stock at 167.00 the data suggests these ranges:
Based on current IV (expected move into Friday per TOS): 156.28 to 177.72
Based on AVERAGE one-day move over last 12 quarters: 159.00 to 175.00
sed on MAXIMUM one-day move over last 12 Q’s (-11.5%): 147.74 to 186.26
Based on UP max only (+6.1%): 177.25
Open to requests for other symbols.
HD closed
#Earnings Sold $HD stock for 220.50.
Nov22/Nov29 237.5 #DoubleCalendar bought for .82 on monday Nov 18th
#Assignment on stock for 237.50 on the 21st
Sold Nov 29th long puts for 18.20 on the 21st
Sold stock today for 220.50
Profit on trade: +0.38
Trades can work even when they initially fail… if you can carry the stock and hold it through dips. Not advised during a correction but it worked in this environment.
DE earnings analysis
#Earnings $DE reports tonight. Below are details on earnings one-day moves over the last 12 quarters.
Aug. 16, 2019 BO +3.84%
May 17, 2019 BO -7.65%Biggest DOWN
Feb. 15, 2019 BO -2.11%
Nov. 21, 2018 BO +2.42%
Aug. 17, 2018 BO +2.35%
May 18, 2018 BO +5.74%
Feb. 16, 2018 BO +1.57%
Nov. 22, 2017 BO +4.32%
Aug. 18, 2017 BO -5.37%
May 19, 2017 BO +7.30%
Feb. 17, 2017 BO +1.00%
Nov. 23, 2016 BO +11.04% Biggest UP
Avg (+ or -) 4.56%
Bias 2.04%, positive bias on earnings.
With stock at 177.50 the data suggests these ranges:
Based on current IV (expected move into Friday per TOS): 169.40 to 185.60
Based on AVERAGE one-day move over last 12 quarters: 169.41 to 185.59
sed on MAXIMUM one-day move over last 12 Q’s (11.0%): 157.90 to 197.10
Based on DOWN max only (-7.7%): 163.92
Open to requests for other symbols.
ADSK earnings analysis
#Earnings $ADSK reports tonight. Below are details on earnings one-day moves over the last 12 quarters.
Aug. 27, 2019 AC -6.74%
May 23, 2019 AC -4.90%
Feb. 28, 2019 AC -1.98%
Nov. 20, 2018 AC +9.74%
Aug. 23, 2018 AC +15.32% Biggest UP
May 24, 2018 AC -4.44%
March 6, 2018 AC +14.87%
Nov. 28, 2017 AC -15.85% Biggest DOWN
Aug. 24, 2017 AC +3.94%
May 18, 2017 AC +14.69%
March 2, 2017 AC -2.29%
Nov. 29, 2016 AC -3.52%
Avg (+ or -) 8.19%
Bias 1.57%, positive bias on earnings.
With stock at 250.00 the data suggests these ranges:
Based on current IV (expected move into Friday per TOS): 156.50 to 183.50
Based on AVERAGE one-day move over last 12 quarters: 156.08 to 183.92
sed on MAXIMUM one-day move over last 12 Q’s (15.9%): 143.06 to 196.95
Based on UP max only (+15.3%): 196.04
Open to requests for other symbols.
BBY closed
#Earnings Sold ro close $BBY Nov29/Dec06 74 #DoubleCalendar for .30. Bought yesterday for .54. My bad streak on earnings continues, but not painful today.
ANF closed
#Earnings Sold to close $ANF Nov 29th 16/16.5 strangles for .926. Bought yesterday for 1.99.
Didn’t get the move so worked aggressively to unload at the open when volatility still high, rather than wait to see if the stock will move enough to become profitable.
The move came in BBY, which is where I didn’t want it.
Holiday schedule
Stock market open full day Wednesday, closed Thursday, then half-day Friday (closes at 1pm ET).
NUGT closed
#ContangoETFs BTC $NUGT Jan 17th 40 call for .25. Sold for 2.10 on March 25th. Not sure if that long wait was worth it. Now flat in NUGT.
BBY dub cal
#Earnings Bought to Open $BBY Nov29/Dec06 74 #DoubleCalendar for .50. Partial fill so far, not raising my price.
