
#SPX1dte Sold $SPX Sept 6th 2910/2930-3015/3045 condors for .85 and .90. IV 12.58%, SPX 2980
Author Archives: Jeff
SPX spread stopping
#SPX1dte Today’s rally already blew past my stop for the call side of the $SPX Sep 11th 2825/2845-2995/3015 condor, sold yesterday for 2.20. I closed the put spread for .20 and looking to close the call side (at a loss) before the close.
LULU earnings analysis
#Earnings $LULU reports tonight. Below are details on earnings one-day moves over the last 12 quarters.
June 12, 2019 AC +2.12%
March 27, 2019 AC +14.12%
Dec. 6, 2018 AC -13.36%
Aug. 30, 2018 AC +13.08%
May 31, 2018 AC +16.31% Biggest UP
March 27, 2018 AC +9.21%
Dec. 6, 2017 AC +6.42%
Aug. 31, 2017 AC +7.19%
June 1, 2017 AC +11.54%
March 29, 2017 AC -23.43% Biggest DOWN
Dec. 7, 2016 AC +15.04%
Sept. 1, 2016 AC -10.55%
Avg (+ or -) 11.86%
Bias 3.97%, positive bias on earnings.
With stock at 185.00 the data suggests these ranges:
Based on current IV (expected move into Friday per TOS): 167.54 to 202.46
Based on AVERAGE one-day move over last 12 quarters: 163.05 to 206.95
Based on MAXIMUM one-day move over last 12 Q’s (23.4%): 141.65 to 228.35
Based on UP max only (+16.3%): 215.17
Open to requests for other symbols.
SPX 1dte stopped
#SPX1dte Bought to close $SPX Sept 4th 2935 calls for 2.50, a couple minutes before the close. Condors sold for 1.60 yesterday.
Also, after the bell: Sold $SPX Sept 11th 2825/2845-2995/3015 condors for 2.20.
PANW earnings analysis
#Earnings $PANW reports tonight. Below are details on earnings one-day moves over the last 12 quarters.
May 29, 2019 AC -5.11%
Feb. 26, 2019 AC +8.20%
Nov. 29, 2018 AC -1.76%
Sept. 6, 2018 AC +3.28%
June 4, 2018 BO -0.52%
Feb. 26, 2018 AC +2.31%
Nov. 20, 2017 AC +4.82%
Aug. 31, 2017 AC +10.53%
May 31, 2017 AC +17.20% Biggest UP
Feb. 28, 2017 AC -24.15% Biggest DOWN
Nov. 21, 2016 AC -13.24%
Aug. 30, 2016 AC -7.16%
Avg (+ or -) 8.19%
Bias -0.47%, slight negative bias on earnings.
With stock at 200.00 the data suggests these ranges:
Based on current IV (expected move into Friday per TOS): 184.58 to 215.42
Based on AVERAGE one-day move over last 12 quarters: 183.62 to 216.38
Based on MAXIMUM one-day move over last 12 Q’s (24.2%): 151.70 to 248.30
Based on UP max only (+17.2%): 234.40
Open to requests for other symbols.
SPX 1-dte
#SPX1dte Sold $SPX Sept 4th 2825/2845-2935/2955 condors for 1.60. IV: 15.90%, SPX 2899.
Expiring: Sept 3rd 2820/2840-2975/2995 condors, sold Friday for 1.60.
AMBA miss
#Earnings. Wrong about the trade, but right about it being low probability.
Closed call side of $AMBA Aug30/Sept06 46.5 #DoubleCalendar for .00 to avoid assignment. Bought yesterday for .369
SPX 1-dte
#SPX1dte Sold to Open $SPX Sept 3rd 2820/2840-2975/2995 condors for 1.60. IV: 13.48%, SPX: 2923
Expiring: Aug 30th 2845/2865-2955/2975 condors, sold yesterday for 1.10.
Econ Calendar for week of 9/2/19
#Jobs report is Friday, 8:30am ET
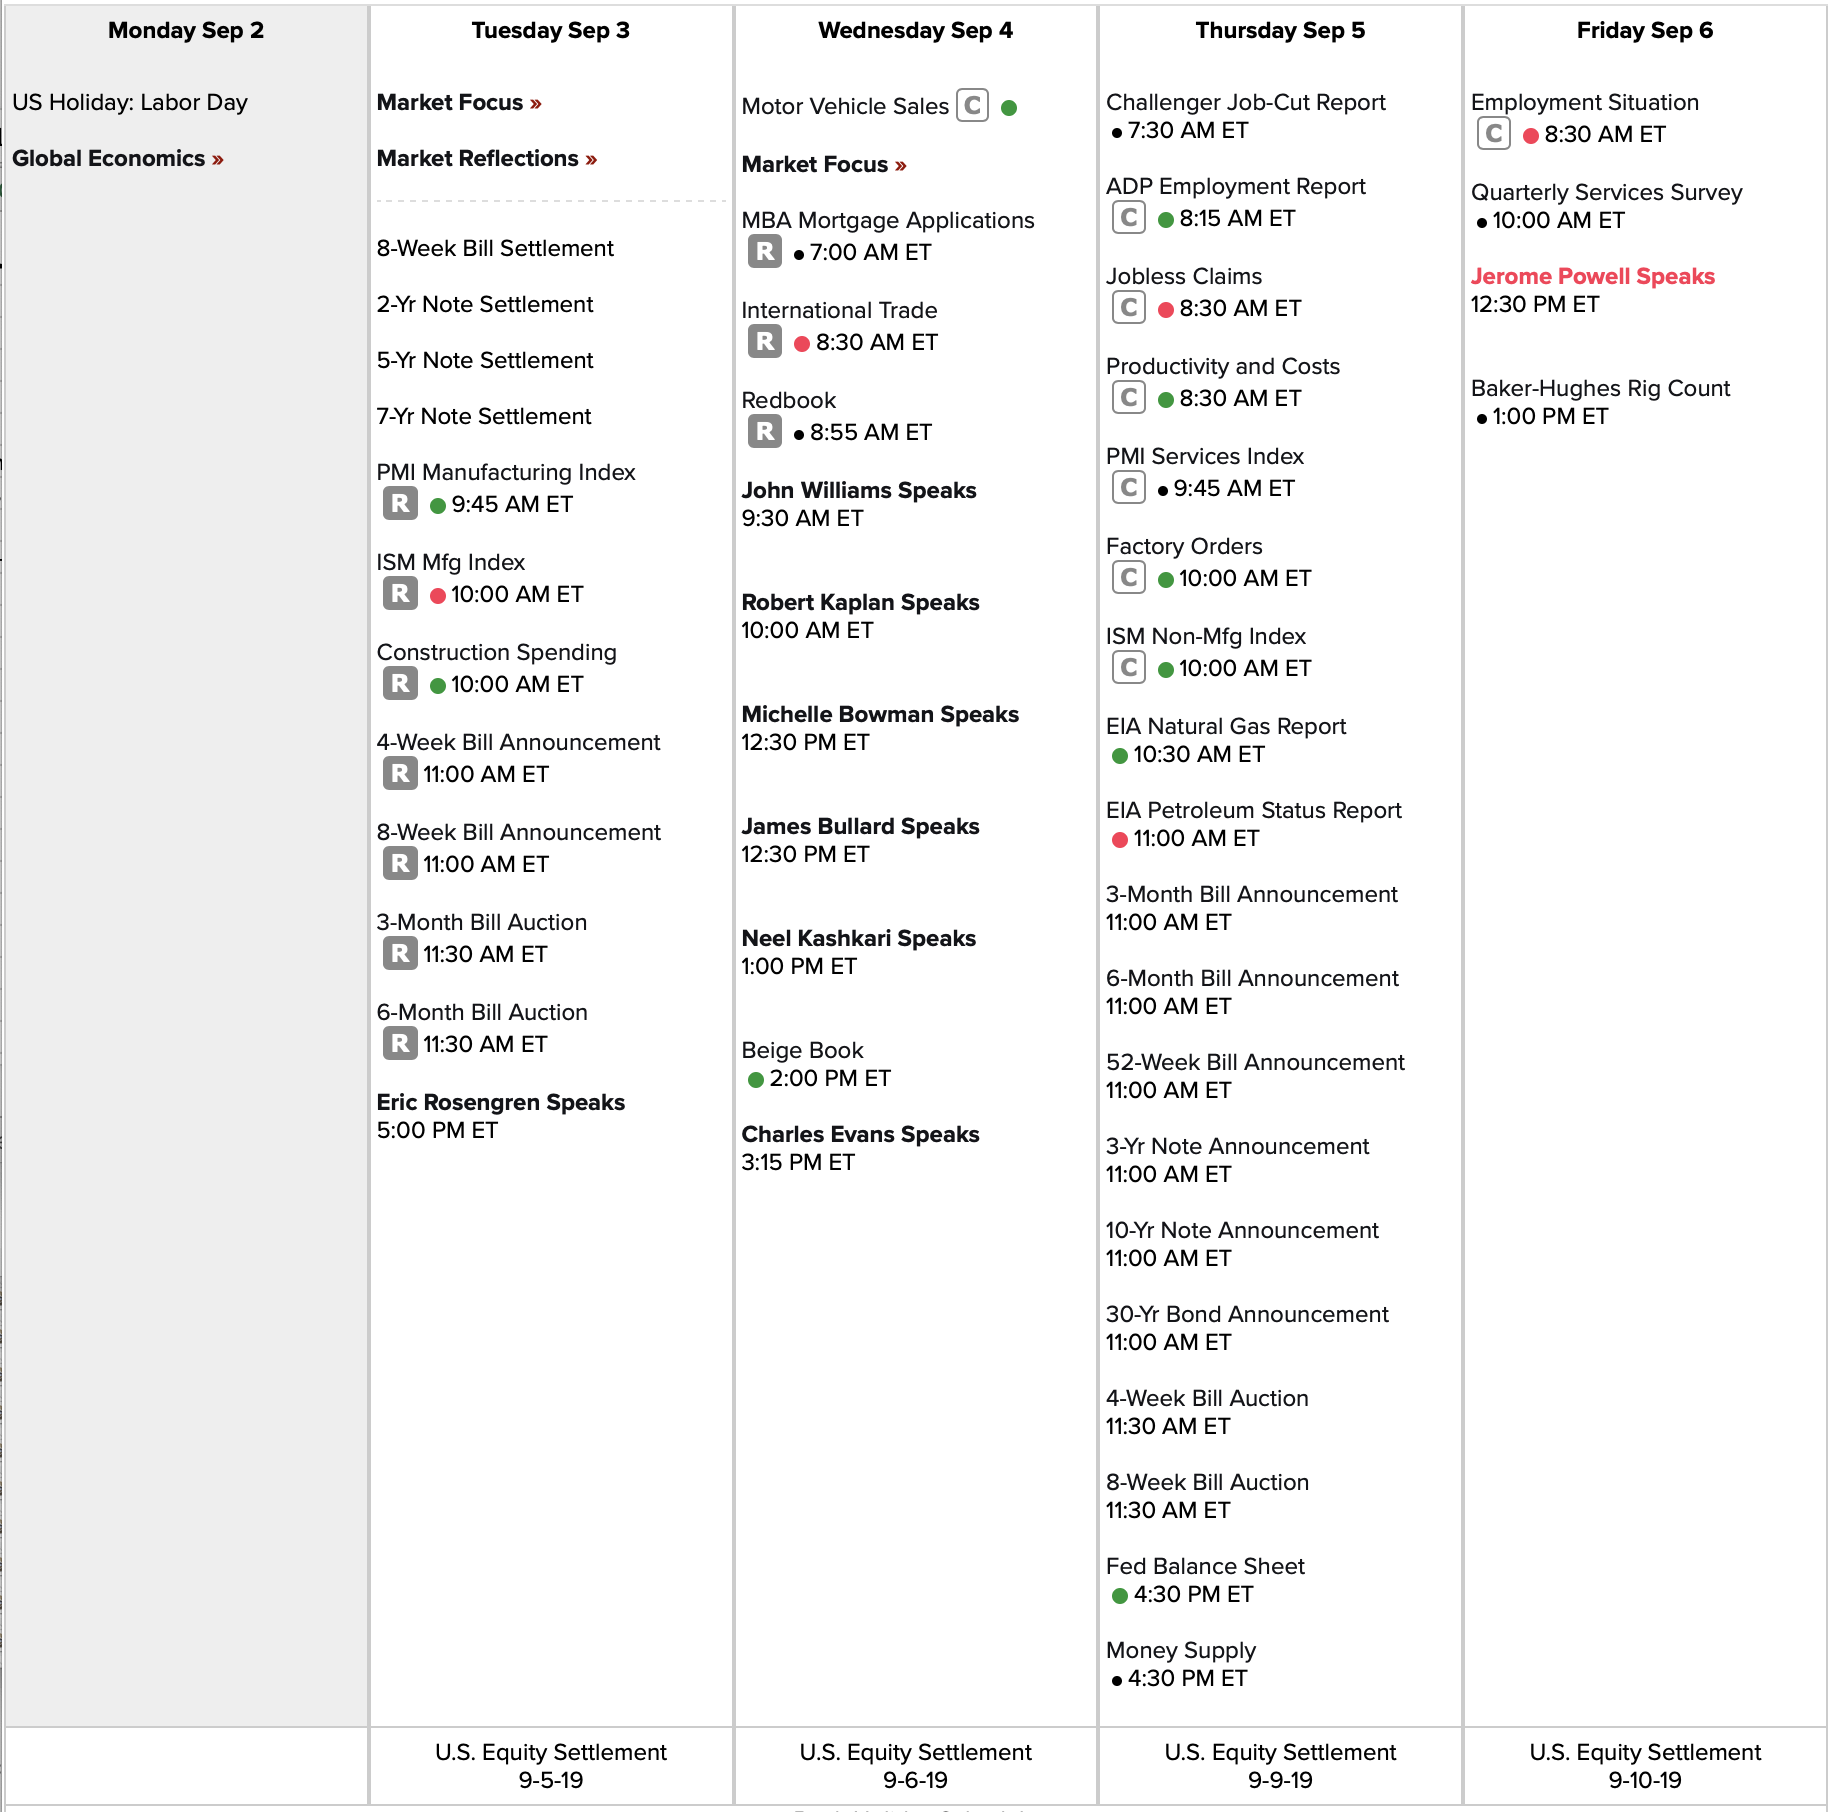

Link to calendar: https://us.econoday.com/byweek.asp?day=2&month=9&year=2019&cust=us&lid=0
SPX 1-dte
#SPX1dte. Sold to Open Aug 30th $SPX 2845/2865-2955/2975 condors for 1.10. Was on the road, so stopped in time to place order just after market close.
AMBA earnings analysis
#Earnings $AMBA reports tonight. Below are details on earnings one-day moves over the last 12 quarters.
June 4, 2019 AC +0.07%
March 5, 2019 AC +3.74%
Nov. 29, 2018 AC +18.48% Biggest UP
Aug. 30, 2018 AC -3.62%
June 5, 2018 AC -12.93%
March 1, 2018 AC +13.46%
Nov. 30, 2017 AC +14.29%
Aug. 31, 2017 AC -22.35% Biggest DOWN
June 6, 2017 AC -10.24%
Feb. 28, 2017 AC -4.42%
Dec. 1, 2016 AC -11.27%
Sept. 1, 2016 AC -6.67%
Avg (+ or -) 10.13%
Bias -1.79%, slight negative bias on earnings.
With stock at 46.50 the data suggests these ranges:
Based on current IV (expected move into Friday per TOS): 42.36 to 50.64
Based on AVERAGE one-day move over last 12 quarters: 41.79 to 51.21
Based on MAXIMUM one-day move over last 12 Q’s (22.4%): 36.11 to 56.89
Based on UP max only (+18.5%): 55.09
Open to requests for other symbols.
ULTA earnings analysis
#Earnings $ULTA reports tonight. Below are details on earnings one-day moves over the last 12 quarters.
May 30, 2019 AC +1.50%
March 14, 2019 AC +8.28% Biggest UP
Dec. 6, 2018 AC -13.12% Biggest DOWN
Aug. 30, 2018 AC +6.37%
May 31, 2018 AC -0.71%
March 15, 2018 AC +7.63%
Nov. 30, 2017 AC -4.11%
Aug. 24, 2017 AC -9.13%
May 25, 2017 AC +3.19%
March 9, 2017 AC +4.62%
Dec. 1, 2016 AC -1.56%
Aug. 25, 2016 AC -6.11%
Avg (+ or -) 5.53%
Bias -0.26%, no significant bias on earnings.
With stock at 115.00 the data suggests these ranges:
Based on current IV (expected move into Friday per TOS): 311.92 to 358.08
Based on AVERAGE one-day move over last 12 quarters: 310.30 to 346.62
Based on MAXIMUM one-day move over last 12 Q’s (13.1%): 285.37 to 371.55
Based on UP max only (+8.3%): 355.66
Open to requests for other symbols.
ANF closing
#Earnings. closed first batch of $ANF 16.5 puts for 2.00. Long Strangles bought yesterday for 2.50. Waiting to see if we might drop further.
Good morning from Seattle
#Markets Opening was highest $TICK since Feb 2018. Is it over?
SPX 5-dte
#SPX1dte. Sold $SPX 2760/2785-2950/2975 condors for 3.00, IV: 16.78%, SPX 2884
ANF long strangle
#earnings. Bought to open $ANF Aug 30th 16.5/17 long strangles for 2.50.
ANF earnings analysis
#Earnings $ANF reports tomorrow morning. Below are details on earnings one-day moves over the last 12 quarters.
May 29, 2019 BO -26.46% Biggest DOWN
March 6, 2019 BO +20.37%
Nov. 29, 2018 BO +20.91%
Aug. 30, 2018 BO -17.15%
June 1, 2018 BO -8.72%
March 7, 2018 BO +11.90%
Nov. 17, 2017 BO +23.90% Biggest UP
Aug. 24, 2017 BO +17.06%
May 25, 2017 BO +8.99%
March 2, 2017 BO +13.94%
Nov. 18, 2016 BO -13.76%
Aug. 30, 2016 BO -20.30%
Avg (+ or -) 16.96%
Bias 2.56%, positive bias on earnings.
With stock at 16.60 the data suggests these ranges:
Based on current IV (expected move into Friday per TOS): 13.99 to 19.21
Based on AVERAGE one-day move over last 12 quarters: 13.79 to 19.41
Based on MAXIMUM one-day move over last 12 Q’s (26.5%): 12.21 to 20.99
Based on UP max only (+23.9%): 20.57
Open to requests for other symbols.
FIVE earnings analysis
#Earnings $FIVE reports tonight (added late, so I missed it on the calendar). Below are details on earnings one-day moves over the last 12 quarters.
June 5, 2019 AC -1.00%
March 27, 2019 AC +8.15%
Dec. 6, 2018 BO -2.66%
Sept. 6, 2018 AC +13.31%
June 6, 2018 AC +21.86% Biggest UP
March 21, 2018 AC +4.20%
Nov. 30, 2017 AC -0.46%
Aug. 30, 2017 AC -3.45% Biggest DOWN
June 1, 2017 AC +0.50%
March 22, 2017 AC +10.80%
Dec. 1, 2016 AC +9.87%
Aug. 31, 2016 AC -1.14%
Avg (+ or -) 6.45%
Bias 5.00%, strong positive bias on earnings.
With stock at 115.00 the data suggests these ranges:
Based on current IV (expected move into Friday per TOS): 105.84 to 124.16
Based on AVERAGE one-day move over last 12 quarters: 107.58 to 122.42
Based on MAXIMUM one-day move over last 12 Q’s (21.9%): 89.86 to 140.14
Based on DOWN max only (-3.5%): 111.03
Open to requests for other symbols.
SPX 4-dte closed early
#SPX1dte. BTC $SPX Aug 30th 2745/2765-2935/2955 condors for .85. Sold Monday for 3.00.
Today’s 2780/2800-2920/2940 condors look good to expire, sold yesterday for 1.00.
TIF closing
#Earnings. Closed first batch for 1.00. $TIF Aug30/Sep06 85 #DoubleCalendar bought yesterday for .48.
SPX 1-dte
#SPX1dte Sold $SPX Aug 28th 2780/2800-2920/2940 condors for 1.00. IV 17.96%, SPX 2871.
VXX added
#VXXGame. Bought $VXX Jan 2020 20 puts for 1.00, adding to my position. Avg price now 1.302, started on Jan 22nd, 2019.
TIF earnings analysis
#Earnings $TIF reports tomorrow morning. Below are details on earnings one-day moves over the last 12 quarters.
June 4, 2019 BO +2.59%
March 22, 2019 BO +3.14%
Nov. 28, 2018 BO -11.82% Biggest DOWN
Aug. 28, 2018 BO +0.99%
May 23, 2018 BO +23.28% Biggest UP
March 16, 2018 BO -5.06%
Nov. 29, 2017 BO -1.58%
Aug. 24, 2017 BO -1.31%
May 24, 2017 BO -8.70%
March 17, 2017 BO +2.71%
Nov. 29, 2016 BO +3.14%
Aug. 25, 2016 BO +6.40%
Avg (+ or -) 5.89%
Bias 1.15%, positive bias on earnings.
With stock at 85.00 the data suggests these ranges:
Based on current IV (expected move into Friday per TOS): 78.66 to 91.34
Based on AVERAGE one-day move over last 12 quarters: 79.99 to 90.01
Based on MAXIMUM one-day move over last 12 Q’s (23.3%): 65.21 to 104.79
Based on DOWN max only (-11.8%): 74.95
Open to requests for other symbols.
ADSK earnings analysis
#Earnings $ADSK reports tonight. Below are details on earnings one-day moves over the last 12 quarters.
May 23, 2019 AC -4.90%
Feb. 28, 2019 AC -1.98%
Nov. 20, 2018 AC +9.74%
Aug. 23, 2018 AC +15.32% Biggest UP
May 24, 2018 AC -4.44%
March 6, 2018 AC +14.87%
Nov. 28, 2017 AC -15.85% Buggest DOWN
Aug. 24, 2017 AC +3.94%
May 18, 2017 AC +14.69%
March 2, 2017 AC -2.29%
Nov. 29, 2016 AC -3.52%
Aug. 25, 2016 AC +8.11%
Avg (+ or -) 8.30%
Bias 2.81%, positive bias on earnings.
With stock at 150.00 the data suggests these ranges:
Based on current IV (expected move into Friday per TOS): 137.13 to 162.87
Based on AVERAGE one-day move over last 12 quarters: 137.54 to 162.46
Based on MAXIMUM one-day move over last 12 Q’s (15.9%): 126.23 to 173.78
Based on UP max only (+15.3%): 172.98
Open to requests for other symbols.
SPX 4-dte
#SPX1dte Sold to Open $SPX Aug 30th 2745/2765-2935/2955 condors for 3.00. IV 21.3%, SPX 2867.
SPX 1-dte remove risk
#SPX1dte Bought to close $SPX Aug 26th 2755 put for .05. Don’t trust downside… just a tweet or Chinese government statement away from 100-pt drop!
2735/2755-2915/2935 condors sold for 1.30 on Friday.
Downside Warning again
#VIXindicator This is one of the more whipsaw-y corrections I can remember. Today was our fifth warning. I don’t think the bottom is in yet, but betting on that after the Aug 14th warning got me ripped up as the bounce was strong and protracted. (arrows represent the 4 Downside Warnings)

SPX 1-dte
#SPX1dte. The market was so volatile before the close I waited until after the close to sell this.
Sold $SPX Aug 26th 2735/2755-2915/2935 condors for 1.30. IV 17.82%, SPX closed at 2848.
Rough week
Even though I ended the week with a couple of decent earnings trades (INTU and GPS), I took a pretty big hit on poorly managed SPX spreads in the whipsaw, and also a week-ending surge in NUGT and DRIP.
Expiring at max profit:
$GPS 15.5/20 strangles, sold yesterday for .62
Almost expired at max profit
$SPX 2915/2940-2980/3005 condors, sold for 2.90 on Monday. I closed the short puts for .30 in the last minute because I couldn’t trust it.
Expiring at max loss:
$SPLK 124/130/133 #BrokenWingButterfly, bought for 2.02 on Wednesday
INTC closed
#PieTrades. Another one I’m closing with only minor loss, as I don’t want to deal with ITM naked puts or stock holdings in this market.
BTC $INTC Sep 6th 46 puts for 1.61. Sold for 1.49 on Aug 12th.
KHC puts & stock closed
#PieTrades BTC $KHC Aug 23rd 27 puts for 1.45.
That is only a third of my position; the other third was assigned. I was set to allow all of it to be assigned, but rather not carry burden of stock. So also unloaded the stock. Since I sold the puts for 1.23 on Aug 8th, this is closing at almost breakeven.
Sold to close $KHC stock for 25.58. Cost basis 25.67.
SPX smackdown
#SPX1dte. Didn’t follow my rules rigidly enough and waited too long to close these. May mean I got out near the bottom rather than when stops were first hit, when I could have gotten out when SPX was around 2888.
BTC $SPX Aug 23rd 2860/2840 put spreads for 5.60. Condors sold yesterday for 1.10.
BTC $SPX Aug 26th 2845/2820 put spreads for 6.75. Condors sold Wednesday for 3.15
I went past my stops on Wednesday on the up side, when SPX just couldn’t get any higher after briefly touching 2930. But the call side premium is much lower when almost ATM on expiration day than put side is, so it’s less risky. That one expired worthless. This one may, too, but after missing fills on every bounce before this, I couldn’t risk another tweet-driven violent drop.
Econ Calendar for week of 8/26/19
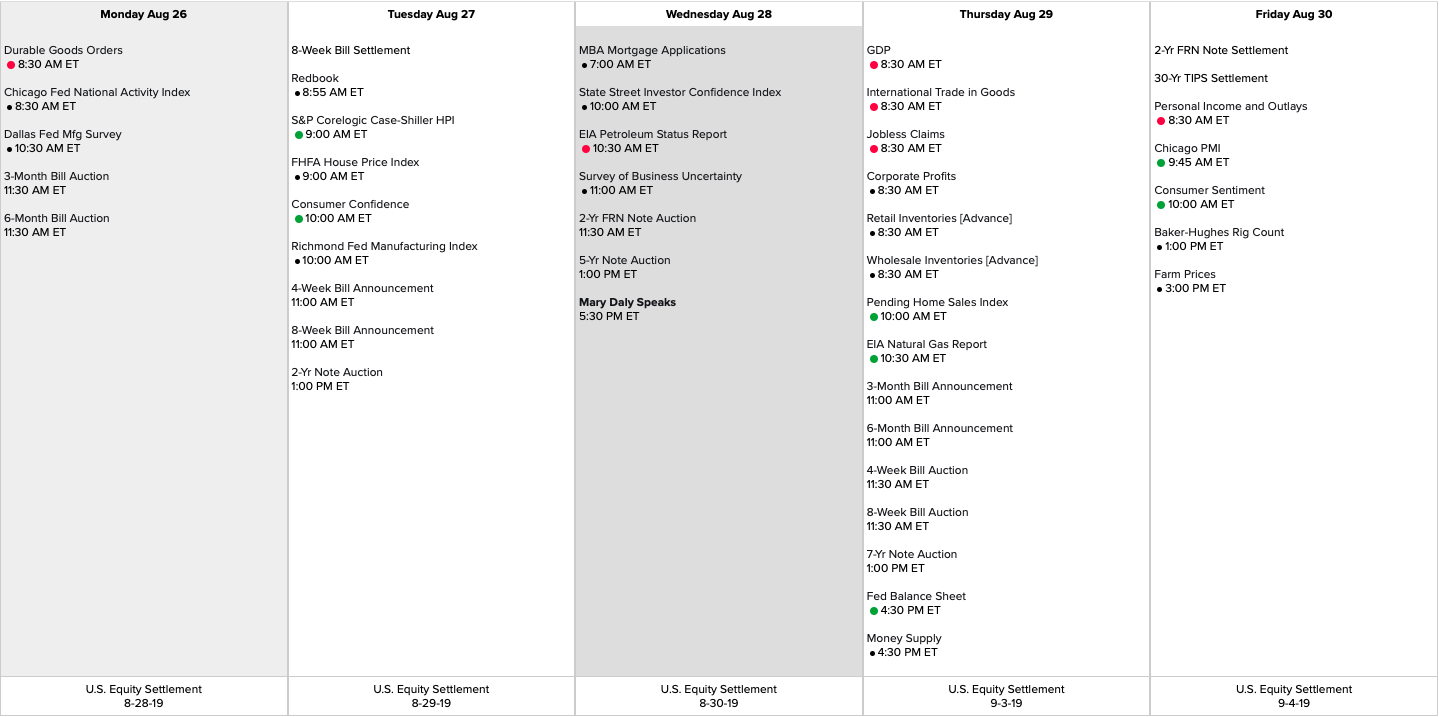
Link to calendar: https://us.econoday.com/byweek.asp?day=26&month=8&year=2019&cust=us&lid=0
INTU closing
#Earnings It would have been a good exit right at the open, but now we’re getting a second shot as price retreats.
Sold to close in phases: .90, 1.20, then when I realized it could drop, I waited for 2.20 on the most recent batch. Now watching to see how much lower it will go for my final lots, driving the premium higher as it gets closer to flat-on-day.
#DoubleCalendar bought yesterday for 1.69.
Consent de’CREE
#Earnings. I must consent that this trade failed.
Paid .01 to close $CREE 58.5 Aug23/Aug30 put calendar. Leaving call side to expire, and be a lottery ticket for next week. #DoubleCalendar bought Tuesday for .67.
SPX 1-dte
#SPX1dte Sold $SPX Apr 23rd 2840/2860-2965/2985 condors for 1.05, IV: 15.95%, SPX 2924.
GPS earnings analysis
#Earnings $GPS reports tonight. Below are details on earnings one-day moves over the last 12 quarters.
May 30, 2019 AC -9.32%
Feb. 28, 2019 AC +16.18% Biggest UP
Nov. 20, 2018 AC +4.66%
Aug. 23, 2018 AC -8.60%
May 24, 2018 AC -14.56%
March 1, 2018 AC +7.82%
Nov. 16, 2017 AC +6.98%
Aug. 17, 2017 AC -0.13%
May 18, 2017 AC -3.92%
Feb. 23, 2017 AC +3.04%
Nov. 17, 2016 AC -16.60% Biggest DOWN
Aug. 18, 2016 AC +3.90%
Avg (+ or -) 7.98%
Bias -0.88%, negative bias on earnings.
With stock at 17.75 the data suggests these ranges:
Based on current IV (expected move into Friday per TOS): 15.54 to 19.96
Based on AVERAGE one-day move over last 12 quarters: 16.33 to 19.17
Based on MAXIMUM one-day move over last 12 Q’s (16.6%): 14.80 to 20.70
Based on UP max only (+16.2%): 20.62
Open to requests for other symbols.
INTU dub cal
#Earnings Bought to open $INTU Aug23/Aug30 275 #DoubleCalendar for 1.69. Pretty good range of profitability: 262 to 288, or 4.7% either way.
INTU earnings analysis
#Earnings $INTU reports tonight. Below are details on earnings one-day moves over the last 12 quarters.
May 23, 2019 AC +6.70% Biggest UP
Feb. 21, 2019 AC +6.76%
Nov. 19, 2018 AC -2.03%
Aug. 23, 2018 AC +1.96%
May 22, 2018 AC +2.98%
Feb. 22, 2018 AC -0.18%
Nov. 20, 2017 AC -3.79% Biggest DOWN
Aug. 22, 2017 AC -1.90%
May 23, 2017 AC +6.72%
Feb. 23, 2017 AC +6.05%
Nov. 17, 2016 AC +1.91%
Aug. 23, 2016 AC -3.50%
Avg (+ or -) 3.71%
Bias 1.81%, positive bias on earnings.
With stock at 275.00 the data suggests these ranges:
Based on current IV (expected move into Friday per TOS): 260.65 to 289.35
Based on AVERAGE one-day move over last 12 quarters: 264.81 to 285.19
Based on MAXIMUM one-day move over last 12 Q’s (6.8%): 256.41 to 293.59
Based on DOWN max only (-3.8%): 264.58
Open to requests for other symbols.
SPX dte Monday
#SPX1dte. Another condor, licking wound from smashed call spread this week. Sold a few minutes after release of FOMC minutes.
Sold $SPX Aug 26th 2820/2845-2975/3000 condors for 3.15.
SPLK trade
#Earnings. Bought to Open $SPLK 124/130/133 #BrokenWingButterfly for 2.02. Breakeven is down around 125.00, so some room below. No upside risk.
SPLK earnings analysis
#Earnings $SPLK reports tonight. Below are details on earnings one-day moves over the last 12 quarters.
May 23, 2019 AC -7.32%
Feb. 28, 2019 AC -0.90%
Nov. 29, 2018 AC +9.93%
Aug. 23, 2018 AC +14.81%
May 24, 2018 AC -5.20%
March 1, 2018 AC +9.26%
Nov. 16, 2017 AC +17.89% Biggest UP
Aug. 24, 2017 AC +8.47%
May 25, 2017 AC -6.97%
Feb. 23, 2017 AC -3.23%
Nov. 29, 2016 AC +0.41%
Aug. 25, 2016 AC -10.10% Biggest DOWN
Avg (+ or -) 7.87%
Bias 2.25%, positive bias on earnings.
With stock at 129.00 the data suggests these ranges:
Based on current IV (expected move into Friday per TOS): 118.69 to 139.31
Based on AVERAGE one-day move over last 12 quarters: 118.84 to 139.16
Based on MAXIMUM one-day move over last 12 Q’s (17.9%): 105.92 to 152.08
Based on DOWN max only (-10.1%): 115.97
Open to requests for other symbols.
CRM earnings analysis (tomorrow)
#Earnings $CRM reports TOMORROW after the bell; by request I’m posting analysis today . Below are details on earnings one-day moves over the last 12 quarters.
June 4, 2019 AC +5.05%
March 4, 2019 AC -0.96%
Nov. 27, 2018 AC +10.27% Biggest UP
Aug. 29, 2018 AC -1.71%
May 29, 2018 AC +1.90%
Feb. 28, 2018 AC +2.73%
Nov. 21, 2017 AC -1.81%
Aug. 22, 2017 AC +0.12%
May 18, 2017 AC -0.39%
Feb. 28, 2017 AC +3.02%
Nov. 17, 2016 AC +3.43%
Aug. 31, 2016 AC -4.41% Biggest DOWN
Avg (+ or -) 2.98%
Bias 1.44%%, positive bias on earnings.
With stock at 147.50 the data suggests these ranges:
Based on current IV (expected move into Friday per TOS): 139.86 to 155.14
Based on AVERAGE one-day move over last 12 quarters: 143.10 to 151.90
Based on MAXIMUM one-day move over last 12 Q’s (10.3%): 132.35 to 162.65
Based on DOWN max only (-4.4%): 141.00
Open to requests for other symbols.
CREE earnings analysis
#Earnings $CREE reports tonight. Below are details on earnings one-day moves over the last 12 quarters.
May 1, 2019 AC +2.17%
Jan. 30, 2019 AC +2.04%
Oct. 16, 2018 AC +5.11%
Aug. 14, 2018 AC -7.77%
April 24, 2018 AC -0.27%
Jan. 23, 2018 AC +2.74%
Oct. 17, 2017 AC +16.42% Biggest UP
Aug. 22, 2017 AC -3.56%
April 25, 2017 AC -11.07%
Jan. 24, 2017 AC +5.18%
Oct. 18, 2016 AC -11.07%
Aug. 16, 2016 AC -14.91% Biggest DOWN
Avg (+ or -) 6.86%
Bias -1.25%, negative bias on earnings.
With stock at 58.50 the data suggests these ranges:
Based on current IV (expected move into Friday per TOS): 53.27 to 63.73
Based on AVERAGE one-day move over last 12 quarters: 54.49 to 62.51
Based on MAXIMUM one-day move over last 12 Q’s (16.4%): 48.89 to 68.11
Based on DOWN max only (-14.9%): 49.78
Open to requests for other symbols.
CREE calendar
#Earnings Kind of asleep at the wheel today, got to earnings very late. Buying a $CREE 58.5dub cal – will post details in a moment.
SPX 1-dte
#SPX1dte Sold to Open $SPX Aug 21st 2840/2850-2945/2955 condors for .55. 10-wide, double sized. IV 14.15%, 2906.
Closed Aug 21st 2900/2925 call spreads of ra loss at 12.00. Sold for 5.00 last week. Let this run too long, but at least a pullback came today. A weakness in my strategy I must address.
UBER strangle
#PerpetualRollingStrangles Sold to Open $UBER Sept 13th 32.5/38 strangles for 1.12
SPX 4-dte
#SPX1dte Sold $SPX Aug 23rd 2815/2840-2980/3005 condors for 2.90. IV 16.68%, SPX 2926.
DRIP dropped
#ContangoETFs Bought to close $DROP Sept 20th 175 call for 2.00. Sold for 6.70 last Wednesday. Take a cue from Ramie and closing these far OTM calls when I can to help chip away at the burden of short 115 calls that have gone ITM a few times.
HD earnings analysis
#Earnings $HD reports tomorrow morning. Below are details on earnings one-day moves over the last 12 quarters.
May 21, 2019 BO +0.26%
Feb. 26, 2019 BO -0.88%
Nov. 13, 2018 BO -0.23%
Aug. 14, 2018 BO -0.53%
May 15, 2018 BO -1.62%
Feb. 20, 2018 BO -0.13%
Nov. 14, 2017 BO +1.63% Biggest UP
Aug. 15, 2017 BO -2.65% Biggest DOWN
May 16, 2017 BO +0.59%
Feb. 21, 2017 BO +1.41%
Nov. 15, 2016 BO -2.56%
Aug. 16, 2016 BO -0.60%
Avg (+ or -) 1.09%
Bias -0.44%, negative bias on earnings.
With stock at 207.00 the data suggests these ranges:
Based on current IV (expected move into Friday per TOS): 198.50 to 215.50
Based on AVERAGE one-day move over last 12 quarters: 204.74 to 209.26
Based on MAXIMUM one-day move over last 12 Q’s (2.7%): 201.51 to 212.49
Based on UP max only (1.6%): 210.37
Open to requests for other symbols.
SPX 1-dte stopped
#SPX1dte Opened 5 points above stop level, but was able to get out as it faded.
BTC $SPX Aug 19th 2930/2950 for 2.00. Condors sold Friday for 1.15
BIDU earnings analysis
#Earnings $BIDU reports tonight. Below are details on earnings one-day moves over the last 12 quarters.
May 16, 2019 AC -16.51% Biggest DOWN
Feb. 21, 2019 AC -2.70%
Oct. 30, 2018 AC +3.64%
July 31, 2018 AC -7.73%
April 26, 2018 AC +5.54%
Feb. 13, 2018 AC +4.56%
Oct. 26, 2017 AC -8.15%
July 27, 2017 AC +9.45% Biggest UP
April 27, 2017 AC -4.06%
Feb. 23, 2017 AC -5.12%
Oct. 27, 2016 AC +2.56%
July 28, 2016 AC -3.64%
Avg (+ or -) 6.14%
Bias -1.85%, negative bias on earnings.
With stock at 103.00 the data suggests these ranges:
Based on current IV (expected move into Friday per TOS): 92.21 to 113.79
Based on AVERAGE one-day move over last 12 quarters: 96.68 to 109.32
Based on MAXIMUM one-day move over last 12 Q’s (16.5%): 85.99 to 120.01
Based on UP max only (+9.5%): 112.73
Open to requests for other symbols.
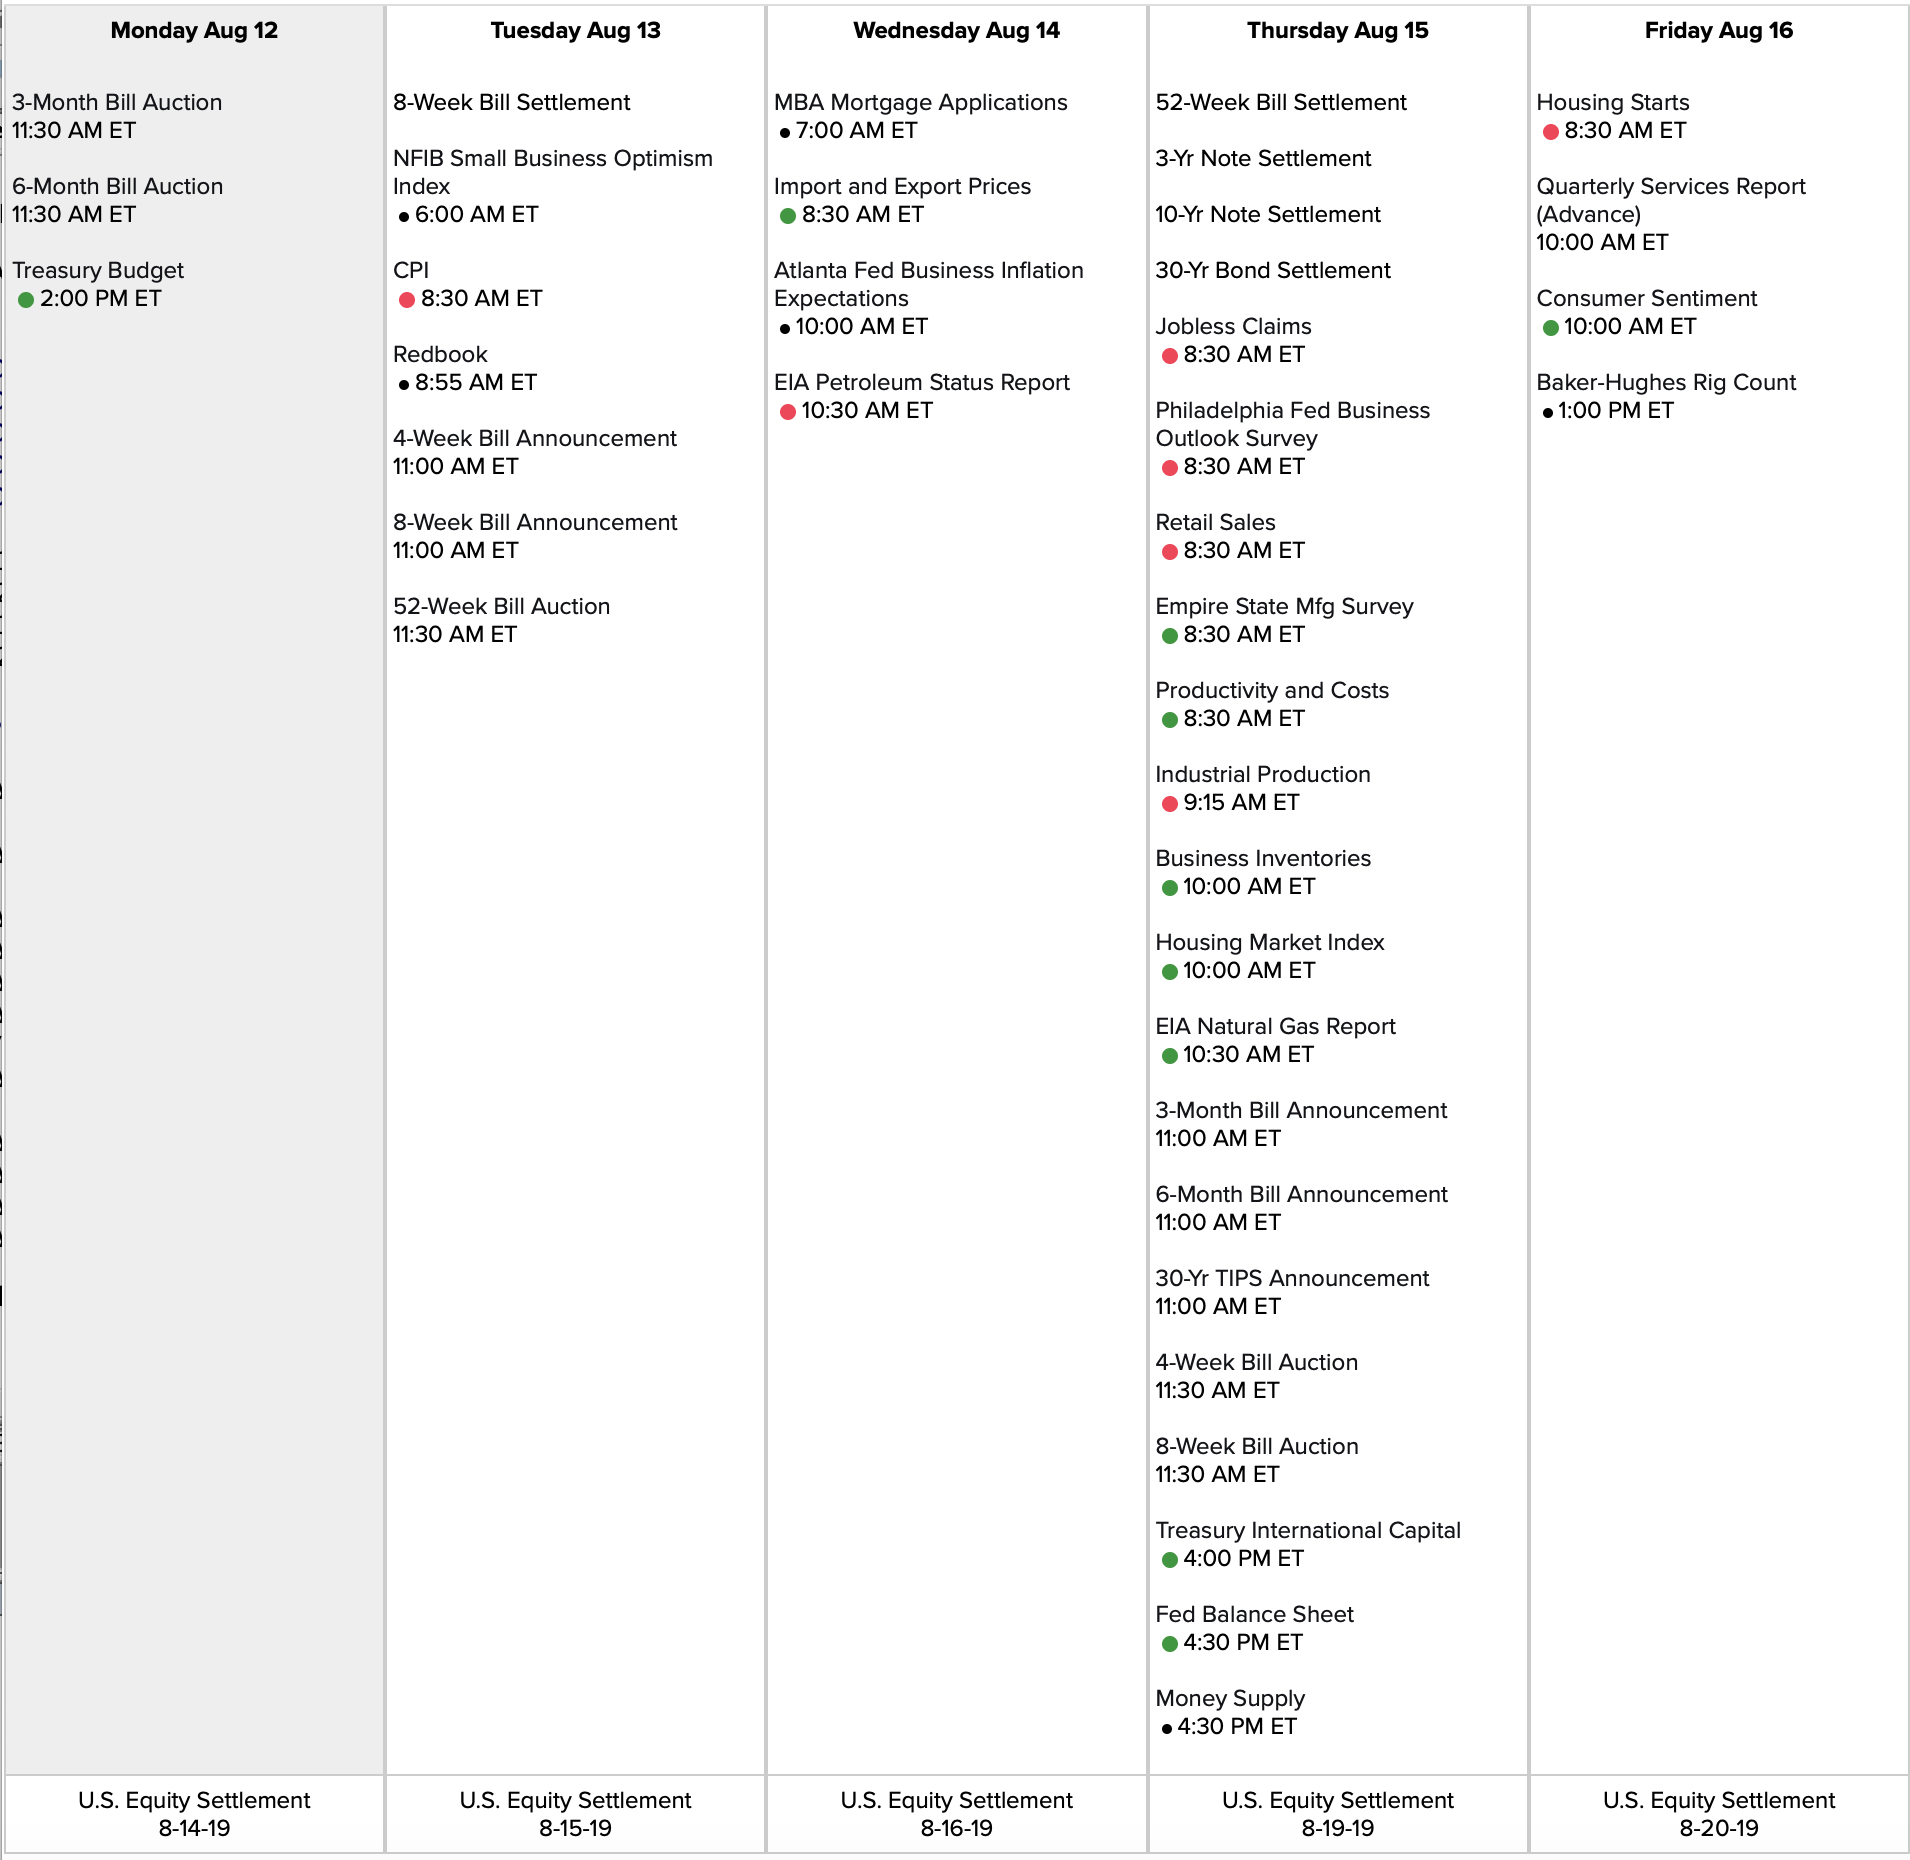
Econ Calendar for week of 8/19/19
#Fed minutes Wednesday, Jerome Powell speaks Friday

Link to calendar: https://us.econoday.com/byweek.asp?day=19&month=8&year=2019&cust=us&lid=0
TLRY burned out
#Earnings Looked like it might light up on Wednesday, but this is dropping like a stoned.
$TLRY 40.5/44.5/48.5 #IronButterfly, sold for 2.94 on Tuesday, expiring ITM for 4.00 debit, 1.06 loss.
SPX 1-dte
#SPX1dte Sold $SPX Aug 19th 2795/2815-2930/2950 condors for 1.15.
Expiring today: Had to watch this all day but looks like I’ll escape with nary a scratch:
Aug 16th 2750/2770-2900/2920 condors, sold yesterday for 1.15
Also closed: Aug 21st 2725/2700 put spreads for .25, sold Wednesday for 2.70.
Getting crushed on a 2900/2925 call spread for Aug 21st… holding for the weekend as I think we still have some more correcting to do.
SPX 1-dte
#SPX1dte Sold $SPX Aug 16th 2750/2770-2900/2920 condors for 1.15, IV 20.82%, SPX 2846
DE earnings analysis
#Earnings $DE reports tomorrow morning. Below are details on earnings one-day moves over the last 12 quarters.
May 17, 2019 BO -7.65% Biggest DOWN
Feb. 15, 2019 BO -2.11%
Nov. 21, 2018 BO +2.42%
Aug. 17, 2018 BO +2.35%
May 18, 2018 BO +5.74%
Feb. 16, 2018 BO +1.57%
Nov. 22, 2017 BO +4.32%
Aug. 18, 2017 BO -5.37%
May 19, 2017 BO +7.30%
Feb. 17, 2017 BO +1.00%
Nov. 23, 2016 BO +11.04%
Aug. 19, 2016 BO +13.49% Biggest UP
Avg (+ or -) 5.36%
Bias 2.84%, Strongly positive bias on earnings.
With stock at 142.50 the data suggests these ranges:
Based on current IV (expected move into Friday per TOS): 135.54 to 149.46
Based on AVERAGE one-day move over last 12 quarters: 134.86 to 150.14
Based on MAXIMUM one-day move over last 12 Q’s (13.5%): 123.28 to 161.72
Based on DOWN max only (-7.7%): 131.60
Open to requests for other symbols.
SPX 6-dte
#SPX1dte Sold to Open $SPX Aug 21st 2900/2925 call spreads for 5.00. This offsets 2725/2700 put side sold yesterday. Call side is more aggressive as I believe we are headed lower over coming days. A fourth Downside Warning fired at yesterday’s close, and I don’t think it was the bottom.
NVDA earnings analysis
#Earnings $NVDA reports tonight. Below are details on earnings one-day moves over the last 12 quarters.
May 16, 2019 AC -2.28%
Feb. 14, 2019 AC +1.81%
Nov. 15, 2018 AC -18.75% Biggest DOWN
Aug. 16, 2018 AC -4.90%
May 10, 2018 AC -2.15%
Feb. 8, 2018 AC +6.69%
Nov. 9, 2017 AC +5.26%
Aug. 10, 2017 AC -5.32%
May 9, 2017 AC +17.82%
Feb. 9, 2017 AC -2.37%
Nov. 10, 2016 AC +29.80% Biggest UP
Aug. 11, 2016 AC +5.59%
Avg (+ or -) 8.56%
Bias 2.60%, Positive bias on earnings.
With stock at 150.00 the data suggests these ranges:
Based on current IV (expected move into Friday per TOS): 139.23 to 160.77
Based on AVERAGE one-day move over last 12 quarters: 137.16 to 162.84
Based on MAXIMUM one-day move over last 12 Q’s (29.8%): 105.30 to 194.70
Based on DOWN max only (-18.8%): 121.88
Open to requests for other symbols.
SPX 7-dte
#SPX1dte Sold $SPX Aug 21st 2725/2700 put spreads for 2.70. I’m delaying the call side until we get a bounce.
DRIP up
#ContangoETFs Sold to Open $DRIP Sep 20th 175 calls for 6.70. This should help ease the burden of carrying short 115 calls ITM.
VXX long game
#VXXGame Bought to Open $UVXY Jan 2020 20 puts for 1.95. First purchase of this symbol for the long put play.
Also, adding to my position on $VXX:
Bought $VXX Jan 2020 20 puts for 1.25 back on Aug 5th,
Bought more for 1.20 today.
Avg price on my whole batch is now 1.40.
SPX puts closed
#SPX1dte BTC $SPX May 16th 2775/2750 put spreads for 2.40. This was a thoroughly annoying one. Not only could I have closed it yesterday for probably .20, but I tried to close at the open for under 1.00. Missing my fill, I ended up chasing it down, trying to fill on each bounce, until finally I just had to pull the cord. At least I got the 1.00 profit. I’ll let the calls expire, even through that side traded as high as 8.00 yesterday.
Condors sold Monday for 3.45.
SPX 1-dte stopped
#SPX1dte My stop was hit at the open so my order to close put side filled on the little spike up we just had.
BTC $SPX Aug 14th 2865/2845 put spreads for 3.00. Condors sold yesterday for 1.05.
Also, working to close the Aug 16th 2775/2750 put spreads which were sold Monday in a condor. Should have closed yesterday except for deer-in-headlights syndrome.
SPX 1-dte
#SPX1dte Sold to Open $SPX Aug 14th 2845/2865-2965/2985 condors for 1.05, IV: 15.76%, SPX 2923
TLRY trade
#Earnings Sold to Open $TLRY 40.5/44.5/48.5 #IronButterfly for 2.95. Risking 1.00 to make 2.95. This has a decent chance of max loss, but the R/R make it worth the shot. Also, three days for it to return to the middle if it moves far tonight.
TLRY earnings analysis
#Earnings $TLRY reports tonight. Below are details on earnings one-day moves over the last 4 quarters, which represent its entire history of earnings reports.
May 14, 2019 AC +0.32%
March 18, 2019 AC -3.39%
Nov. 13, 2018 AC -8.25% Biggest DOWN
Aug. 28, 2018 AC +20.64% Biggest UP
Avg (+ or -) 8.15%
Bias 2.33%, positive bias on earnings.
With stock at 43.00 the data suggests these ranges:
Based on current IV (expected move into Friday per TOS): 38.02 to 47.98
Based on AVERAGE one-day move over last 12 quarters: 39.50 to 46.50
Based on MAXIMUM one-day move over last 12 Q’s (20.6%): 34.12 to 51.88
Based on DOWN max only (-8.3%): 39.45
Open to requests for other symbols.
UBER strangle stopped
#PerpetualRollingStrangles BTC $UBER Aug 30th 37 put for 1.50. The 37/43.5 strangles sold for 1.08 on Friday.
Nice thing about these is how small the loss is if your strike is breached. I will allow the call to close for .05.
I will give it a day or two before selling a new one.
Headline sensitive, anyone?
BREAKING: Stocks jump to session highs, Apple surges more than 4.5% after USTR removes items from China tariff list, delays some others including those on cell phones and laptops https://t.co/4gGcxyFOnV pic.twitter.com/AMmid6LZJY
— CNBC Now (@CNBCnow) August 13, 2019
SPX 4-dte
#SPX1dte Sold $SPX Aug 16th (Friday PM) 2750/2775-2950/2975 condors for 3.45, IV 22.57%, SPX 2880.
INTC puts
#PieTrades Sold to Open $INTC Sept 6th 46 puts for 1.50.
Since my on-going favorite $T is not near 52-week lows, I’ve switched to $KHC and INTC for my PieTrades.
YELP closed
#Earnings Sold to close $YELP 34.5 calls for 3.00 average price. Got a couple sold for a small profit this morning, but made the mistake of waiting for it to go higher and it collapsed instead. These are usually winners, but pretty tough to manage. I think I need to try trailing stops.
#LongStrangles bought yesterday for 4.23. This loss and the UBER win cancel each other out.
SPX 1-dte
#SPX1dte Sold $SPX Aug 12th 2840/2860-2970/2990 condors for 1.10. IV: 11.71%, SPX 2929
Expiring today: Aug 9th 2840/2860-2960/2980 condors, sold yesterday for 1.35
UBER strangles
#Earnings #PerpetualRollingStrangles
Since today’s 39.5/45.5 earnings strangle look to be expiring worthless, I’m resuming what worked for me for a couple months after my earnings losing trade in May:
Sold $UBER Aug 30th 37/43.5 strangles for 1.08
Econ Calendar for week of 8/12/19
Link to calendar: https://us.econoday.com/byweek.asp?day=12&month=8&year=2019&cust=us&lid=0
