
#Earnings Bought to open $BURL Mar 8th 167.5/172.5/175 #BrokenWingButterfly (calls) for 1.40. No upside risk…
Max loss debit paid (1.40) if below 167.25.
Breakeven 168.85.
Max gain, 3.60 if Friday pin at 172.50.
Capped gain if over 175.00, 1.10.
#Earnings Bought to open $BURL Mar 8th 167.5/172.5/175 #BrokenWingButterfly (calls) for 1.40. No upside risk…
Max loss debit paid (1.40) if below 167.25.
Breakeven 168.85.
Max gain, 3.60 if Friday pin at 172.50.
Capped gain if over 175.00, 1.10.
#Earnings — $KR reports tomorrow morning. Below are details on earnings one-day moves over the last 12 quarters.
Dec. 6, 2018 BO +3.21%
Sept. 13, 2018 BO -9.92%
June 21, 2018 BO +9.74% Biggest UP
March 8, 2018 BO -12.39%
Nov. 30, 2017 BO +6.07%
Sept. 8, 2017 BO -7.50%
June 15, 2017 BO -18.89% Biggest DOWN
March 2, 2017 BO -4.33%
Dec. 1, 2016 BO +3.28%
Sept. 9, 2016 BO +0.63%
June 16, 2016 BO -0.67%
March 3, 2016 BO -7.01%
Avg (+ or -) 6.97%
Bias -3.15%, strong negative bias on earnings.
With stock at 28.80 the data suggests these ranges:
Based on current IV (expected move into Friday per TOS): 26.65 to 30.95
Based on AVERAGE move over last 12 quarters: 26.79 to 30.81
Based on MAXIMUM move over last 12 Q’s (18.9%): 23.36 to 34.24
Based on Max UP only (9.7%): 31.61
Open to requests for other symbols.
#Earnings — $BURL reports tomorrow morning. Below are details on earnings one-day moves over the last 12 quarters.
I’m posting this one because it has a remarkably bullish response to earnings. Also, in a very long weekly squeeze. Will probably do a bullish butterfly, or maybe try my first #JadeLizard.
Nov. 28, 2018 BO +12.78%
Aug. 30, 2018 BO -0.86%
May 31, 2018 BO +7.11%
March 8, 2018 BO +5.84%
Nov. 21, 2017 BO -1.51%
Aug. 24, 2017 BO +1.36%
May 25, 2017 BO +4.90%
March 2, 2017 BO +6.66%
Nov. 22, 2016 BO +15.98% Biggest UP
Aug. 25, 2016 BO +3.12%
May 26, 2016 BO +7.44%
March 3, 2016 BO -2.78% Biggest DOWN
Avg (+ or -) 5.86%
Bias 5.00%, very strong positive bias on earnings.
With stock at 170.00 the data suggests these ranges:
Based on current IV (expected move into Friday per TOS): 158.81 to 181.19
Based on AVERAGE move over last 12 quarters: 160.04 to 179.96
Based on MAXIMUM move over last 12 Q’s (16.0%): 142.83 to 197.17
Based on Max DOWN only (-2.8%): 165.27
Open to requests for other symbols.
#Earnings #LongStraddle Sold to close half of $ANF March 8th 21.5 calls for 3.40 and 3.80. #LongStraddle bought yesterday for 2.94. Holding the rest to see how high we can go.
DLTR 95 #DoubleCalendar, front week premium not going down much yet so sitting on this one for awhile.
#Earnings Bought to close $CRM March 8th 150/152.5/175/177.5 condors for .23. Sold for 1.15 yesterday.
#LongLEAPs #SyntheticCoveredCalls Sold to Open $SQ Mar 15th 79 calls for 1.00
#Earnings #LongStraddle Bought $ANF March 8th 21.5 straddle for 2.94. Avg Move on earnings: 14.7%. I need a 13.7% move to breakeven.
Also trying for a #DoubleCalendar on $DLTR. Only if I can get filled for .40. Low probability, since it moves decently, but low risk worth the shot.
#earnings Z
This took a couple weeks. Feb. 21, sold a March 15, 30/40 strangle for 1.35, with Z around 35. It jumped to a little over 44 and is settling down now below 40. Bought today for .90.
#Earnings — $ANF reports tomorrow morning. Below are details on earnings one-day moves over the last 12 quarters.
Nov. 29, 2018 BO +20.91%
Aug. 30, 2018 BO -17.15%
June 1, 2018 BO -8.72%
March 7, 2018 BO +11.90%
Nov. 17, 2017 BO +23.90% Biggest UP
Aug. 24, 2017 BO +17.06%
May 25, 2017 BO +8.99%
March 2, 2017 BO +13.94%
Nov. 18, 2016 BO -13.76%
Aug. 30, 2016 BO -20.30% Biggest DOWN
May 26, 2016 BO -15.66%
March 2, 2016 BO +3.64%
Avg (+ or -) 14.66%
Bias 2.06%, Positive bias on earnings.
With stock at 21.50 the data suggests these ranges:
Based on current IV (expected move into Friday per TOS): 18.76 to 24.24
Based on AVERAGE move over last 12 quarters: 18.35 to 24.65
Based on MAXIMUM move over last 12 Q’s (23.9%): 16.36 to 26.64
Open to requests for other symbols.
#Earnings — $DLTR reports tomorrow morning. Below are details on earnings one-day moves over the last 12 quarters.
Nov. 29, 2018 BO +6.13%
Aug. 30, 2018 BO -15.54% Biggest DOWN
May 31, 2018 BO -14.28%
March 7, 2018 BO -14.47%
Nov. 21, 2017 BO +2.41%
Aug. 24, 2017 BO +5.62%
May 25, 2017 BO +0.92%
March 1, 2017 BO +0.20%
Nov. 22, 2016 BO +8.15%
Aug. 25, 2016 BO -9.93%
May 26, 2016 BO +12.77% Biggest UP
March 1, 2016 BO +2.21%
Avg (+ or -) 7.72%
Bias -1.32%, negative bias on earnings.
With stock at 95.00 the data suggests these ranges:
Based on current IV (expected move into Friday per TOS): 88.39 to 101.61
Based on AVERAGE move over last 12 quarters: 87.67 to 102.33
Based on MAXIMUM move over last 12 Q’s (15.5%): 80.24 to 109.76
Open to requests for other symbols.
#earnings CRM
Yesterday sold April 18, 125/185 strangle for 1.47, bought this morning for .69
#earnings CRM
Sold April 18, 125/185 strangle for 1.47, thanks for the data Jeff
#Earnings Sold to Open $CRM March 8th 150/152.5-175/177.5 #IronCondor for 1.15. I put the order in earlier and didn’t expect it to drop this much. But still looking okay based on historical moves (analysis posted Friday.)
Biggest UP move: 11.0%, Biggest DOWN move: -4.4%, Average move: 3.7%. This is trade is +11.5% and -2.9% OTM.
#optionsexpiration
$SPX 2740/2760/2830/2810 IC 1 DTE Thank you @jeffcp66
$NFLX 370 calls (covered)
#rolling
$SQ BTC 4/18 60/70 BUPS and STO 4/18 65/75 BUPS for added a.12 credit. Thank you @ramie77
#earnings
$NVDA BTC 3/15 120/185 straddle @ .20 STO 2/14 for 1.74 Thank you @thomberg1201
#Earnings Sold to Close $VMW #DoubleCalendar final lots for 2.36 and 2.03. Bought for 1.23 yesterday. Avg close price 2.62.
$SPLK splunked out… the only time profit was available was first 5 minutes of the day. Bought for 1.20 yesterday.
Expiring:
$SPX 2740/2760-2810/2830 condors, sold yesterday for 1.10.
$AZO 860/855 put spreads. Call side closed for .35 on Wednesday. Condor sold for 2.28 on Monday.
$SQ 85 calls, sold for 1.08 on Wednesday.
Lottery tickets for next week:
$BUD 75 long puts
$MSTR 58 and 54 long puts
#earnings #assignment AAPL
In December I was assigned shares on 3 different trades from post earnings put spreads as AAPL went from 220 down to 145 from late October to the December market sell off, my timing being impeccable. Fortunately they were put spreads and the long puts provided significant support. I sold the last of the shares after selling covered calls, actually making a little on each set of shares. Whew
#Earnings — $CRM reports Monday at the close. Below are details on earnings one-day moves over the last 12 quarters. (5-day moves are not significantly different)
Nov. 27, 2018 AC +10.27%
Aug. 29, 2018 AC -1.71%
May 29, 2018 AC +1.90%
Feb. 28, 2018 AC +2.73%
Nov. 21, 2017 AC -1.81%
Aug. 22, 2017 AC +0.12%
May 18, 2017 AC -0.39%
Feb. 28, 2017 AC +3.02%
Nov. 17, 2016 AC +3.43%
Aug. 31, 2016 AC -4.41% Biggest DOWN
May 18, 2016 AC +4.13%
Feb. 24, 2016 AC +11.03% Biggest UP
Avg (+ or -) 3.75%
Bias 2.36%, strong positive bias on earnings.
With stock at 164.00 the data suggests these ranges:
Based on current IV (expected move into Friday per TOS): 153.49 to 174.51
Based on AVERAGE move over last 12 quarters: 157.86 to 170.14
Based on MAXIMUM move over last 12 Q’s (11.0%): 145.91 to 182.09
Open to requests for other symbols.
#Earnings #DoubleCalendar Closed first batch of $VMX Mar01/Mar08 dbl cals for 2.90. Bought yesterday for 1.30. These higher priced stocks always produce the bigger profits. This winner will easily overtake the small losses in MNST and BUD for the week.
#Earnings Sold to close $BUD 75 call calendar for .07. This one moved farther up today, so profit’s not possible. Closed the call side to avoid assignment.
$MNST I’ll get a small profit out of the 62 calendar, but not moving down enough to make the ATM 58 #DoubleCalendar work. Will be closing the call side to avoid assignment, but will wait until later in case we get a drop.
$VMW This one moved up, but should still turn a small profit.
$SPLK #BrokenWingButterfly Looking for this to rise into the close so I can take profit. It passed through my center strike in the morning but volatility was too wild to close with enough profit.
#Earnings #JadeLizard – Bought to Close ADSK MAR 1 2019 150.0/170.0/172.5 Jade Lizard @ .17 (sold for 3.25)
GPS #earnings
This one is going to hurt anyone with short calls…
#Earnings — $VMW reports tonight. Below are details on earnings one-day moves over the last 12 quarters.
Nov. 29, 2018 AC +3.62%
Aug. 23, 2018 AC -2.19%
May 31, 2018 AC +6.14%
March 1, 2018 AC -5.91%
Nov. 30, 2017 AC +3.60%
Aug. 24, 2017 AC +1.89%
June 1, 2017 AC -2.09%
Jan. 26, 2017 AC +3.49%
Oct. 26, 2016 AC +3.35%
July 18, 2016 AC +9.04%
April 19, 2016 AC +13.73% Biggest UP
Jan. 26, 2016 AC -9.82% Biggest DOWN
Avg (+ or -) 5.41%
Bias 2.07%, strong positive bias on earnings.
With stock at 173.00 the data suggests these ranges:
Based on current IV (expected move into Friday per TOS): 163.23 to 182.77
Based on AVERAGE move over last 12 quarters: 163.65 to 182.35
Based on MAXIMUM move over last 12 Q’s (13.7%): 149.25 to 196.75
Open to requests for other symbols.
#Earnings – Nice bounce today. I’ll take the small winner and move along…
Bought to Close SQ MAR 1 2019 83.0/78.0 Bull Put Spread @ 1.65 (sold for 2.76)
#earnings
FL
STO FL Mar01 50/68 Short Strangle -0.84
#Earnings #BrokenWingButterfly This trade worked last quarter, and with positive bias in $SPLK I like it. Still, the stock is a bit extended so I see it as riskier than last quarter.
Bought $SPLK March 1st 137/142/145 Broken wing CALL butterfly for 1.20. buy (1) 137, sell (2) 142, buy (1) 145
(stock at 137.00 at time of trade)
Trade has no upside risk. Max loss, debit paid (1.20). Max gain: 3.80 (if pin at 142). Capped gain: .80 if above 145. Goal will be to close for profit during the day when price passes through the 142 area. If it explodes higher or gaps lower, trade can be ignored for exercise to cancel out (or, if above 145, close all to avoid exercise fees). BUT if price ends day between 137 and 145, you WILL BE ASSIGNED if you don’t close the necessary options. I can help if you follow this trade.
#Earnings — $FL reports tonight. Below are details on earnings one-day moves over the last 12 quarters.
Nov. 20, 2018 AC +14.90%
Aug. 24, 2018 BO -9.17%
May 25, 2018 BO +20.15%
March 2, 2018 BO -12.72%
Nov. 17, 2017 BO +28.16% Biggest UP
Aug. 18, 2017 BO -27.92% Biggest DOWN
May 19, 2017 BO -16.65%
Feb. 24, 2017 BO +9.37%
Nov. 18, 2016 BO +0.60%
Aug. 19, 2016 BO +11.04%
May 20, 2016 BO -6.45%
Feb. 26, 2016 BO -4.31%
Avg (+ or -) 13.45%
Bias 0.58%, small positive bias on earnings.
With stock at 58.50 the data suggests these ranges:
Based on current IV (expected move into Friday per TOS): 52.30 to 64.70
Based on AVERAGE move over last 12 quarters: 50.63 to 66.37
Based on MAXIMUM move over last 12 Q’s (17.9%): 42.03 to 74.97
Open to requests for other symbols.
#Earnings — $SPLK reports tonight. Below are details on earnings one-day moves over the last 12 quarters.
Nov. 29, 2018 AC +9.93%
Aug. 23, 2018 AC +14.81%
May 24, 2018 AC -5.20%
March 1, 2018 AC +9.26%
Nov. 16, 2017 AC +17.89% Biggest UP
Aug. 24, 2017 AC +8.47%
May 25, 2017 AC -6.97%
Feb. 23, 2017 AC -3.23%
Nov. 29, 2016 AC +0.41%
Aug. 25, 2016 AC -10.10% Biggest DOWN
May 26, 2016 AC +2.56%
Feb. 25, 2016 AC +7.73%
Avg (+ or -) 8.05%
Bias 3.80%, strong positive bias on earnings.
With stock at 138.00 the data suggests these ranges:
Based on current IV (expected move into Friday per TOS): 126.42 to 149.58
Based on AVERAGE move over last 12 quarters: 126.90 to 149.10
Based on MAXIMUM move over last 12 Q’s (17.9%): 113.31 to 162.69
Open to requests for other symbols.
#earnings SQ
Yesterday sold April 65/90 strangle for 3.28, bought today for 2.13
#Earnings – Sold SQ MAR 1 2019 83.0/78.0 Bull Put Spread @ 2.76
#earnings SQ
SQ Sold April 18, 60/95 strangle for 3.28
MNST bought March 1/8,54/62 double calendar for .28, thanks Mama and Jeff
#Earnings #LongLEAPs #SyntheticCoveredCalls
Sold $SQ March 1st 85 calls for 1.08. Against my 2020 110 long call LEAPs.
#Earnings — Bought to open $BUD Mar01/Mar08 75 #DoubleCalendar for .48. Looking at the daily chart, BUD is not the king of big moves. I’ve said it all.
$BUD reports tomorrow morning. Below are details on earnings one-day moves over the last 12 quarters.
Oct. 25, 2018 BO -9.37% Biggest DOWN
July 26, 2018 BO -5.02%
May 9, 2018 BO -0.31%
March 1, 2018 BO +3.07%
Oct. 26, 2017 BO -0.94%
July 27, 2017 BO +6.16% Biggest UP
May 4, 2017 BO +5.68%
March 2, 2017 BO -3.72%
Oct. 28, 2016 BO -3.80%
July 29, 2016 BO +2.79%
May 4, 2016 BO -2.98%
Feb. 25, 2016 BO -2.38%
Avg (+ or -) 3.85%
Bias -0.90%, negative bias on earnings.
With stock at 75.00 the data suggests these ranges:
Based on current IV (expected move into Friday per TOS): 71.07 to 78.93
Based on AVERAGE move over last 12 quarters: 72.11 to 77.89
Based on MAXIMUM move over last 12 Q’s (9.4%): 67.97 to 82.03
Open to requests for other symbols.
#Earnings — Bought to open $MNST Mar01/Mar08 58 #DoubleCalendar for .23, .246, and .25.
$MNST reports tonight. Below are details on earnings one-day moves over the last 12 quarters.
Nov. 7, 2018 AC -3.16%
Aug. 8, 2018 AC +2.65%
May 8, 2018 AC -7.47%
Feb. 28, 2018 AC -14.43% Biggest DOWN
Nov. 8, 2017 AC +1.17%
Aug. 8, 2017 AC -1.14%
May 4, 2017 AC +3.30%
March 1, 2017 AC +12.75% Biggest UP
Nov. 3, 2016 AC -3.55%
Aug. 4, 2016 AC +2.47%
April 29, 2016 BO +12.81%
Feb. 25, 2016 AC -1.74%
Avg (+ or -) 5.55%
Bias 0.31%, small positive bias on earnings.
With stock at 58.00 the data suggests these ranges:
Based on current IV (expected move into Friday per TOS): 54.07 to 61.93
Based on AVERAGE move over last 12 quarters: 54.78 to 61.22
Based on MAXIMUM move over last 12 Q’s (14.1%): 49.63 to 66.37
Open to requests for other symbols.
#Earnings — $SQ reports tonight. Below are details on earnings one-day moves over the last 12 quarters.
Nov. 7, 2018 AC +8.48%
Aug. 8, 2018 AC -11.38%
May 7, 2018 AC +7.84%
Feb. 21, 2018 AC -27.23% Biggest DOWN
Nov. 1, 2017 AC -20.10%
Aug. 2, 2017 AC -1.08%
May 10, 2017 AC +5.58%
Feb. 22, 2017 AC -18.13%
Nov. 4, 2015 AC +9.99%
Aug. 5, 2015 AC +10.00% Biggest UP
May 6, 2015 AC -7.90%
Feb. 26, 2015 AC -6.34%
Avg (+ or -) 11.17%
Bias -4.19%, negative bias on earnings.
With stock at 78.50 the data suggests these ranges:
Based on current IV (expected move into Friday per TOS): 72.38 to 84.62
Based on AVERAGE move over last 12 quarters: 69.73 to 87.27
Based on MAXIMUM move over last 12 Q’s (27.2%): 57.12 to 99.88
Open to requests for other symbols.
#Earnings #IronCondor Bougtht to close $AZO March 1st 940/945 call spreads for .35. Leaving put spread to expire or shorts to close for .05. Condor sold for 2.30 on Monday.
#earnings GS
Took a beating on this one. Jan. 15, sold a Feb. 15, 155/175/180/200 IC. rolled to March as GS stayed up. It goes ex-div tomorrow, don’t want to be short 100 shares at 180 with the stock at 200, and have to pay the .80 dividend, negative $836 on everything.
#Earnings — $PANW reports tonight. Below are details on earnings one-day moves over the last 12 quarters.
Nov. 29, 2018 AC -1.76%
Sept. 6, 2018 AC +3.28%
June 4, 2018 BO -0.52%
Feb. 26, 2018 AC +2.31%
Nov. 20, 2017 AC +4.82%
Aug. 31, 2017 AC +10.53%
May 31, 2017 AC +17.20% Biggest UP
Feb. 28, 2017 AC -24.15% Biggest DOWN
Nov. 21, 2016 AC -13.24%
Aug. 30, 2016 AC -7.16%
May 26, 2016 AC -12.36%
Feb. 25, 2016 AC +5.20%
Avg (+ or -) 8.54%
Bias -1.32%, negative bias on earnings.
With stock at 233.00 the data suggests these ranges:
Based on current IV (expected move into Friday per TOS): 217.69 to 248.31
Based on AVERAGE move over last 12 quarters: 213.09 to 252.91
Based on MAXIMUM move over last 12 Q’s (24.2%): 176.73 to 289.27
Open to requests for other symbols.
#Earnings — $EOG reports tomorrow morning. Below are details on earnings one-day moves over the last 12 quarters.
Nov. 2, 2018 BO -4.24%
Aug. 3, 2018 BO -2.79%
May 3, 2018 AC -1.16%
Feb. 28, 2018 BO -5.16% Biggest DOWN
Nov. 3, 2017 BO +1.50%
Aug. 2, 2017 BO -2.26%
May 8, 2017 AC -0.05%
Feb. 27, 2017 AC -0.93%
Nov. 3, 2016 AC -0.30%
Aug. 4, 2016 AC +7.02% Biggest UP
May 5, 2016 AC -3.17%
Feb. 25, 2016 AC -1.45%
Avg (+ or -) 2.50%
Bias -1.08%, negative bias on earnings.
With stock at 94.50 the data suggests these ranges:
Based on current IV (expected move into Friday per TOS): 90.14 to 98.86
Based on AVERAGE move over last 12 quarters: 92.14 to 96.86
Based on MAXIMUM move over last 12 Q’s (7.0%): 87.87 to 101.13
Open to requests for other symbols.
Sold March 15, 22(put)/25/25.50 for .73, stock at 24.60, recent low of 23.95. I have 100 assigned shares from a while ago. Thanks for the data Jeff.
#Earnings — $SHAK reports tonight. Below are details on earnings one-day moves over the last 12 quarters. (5-day results had HIGHER extremes, meaning stock often continues in same direction after first day).
Nov. 1, 2018 AC -13.88% Biggest DOWN
Aug. 2, 2018 AC -11.88%
May 3, 2018 AC +18.01% Biggest UP
Feb. 15, 2018 AC -7.71%
Nov. 1, 2017 AC -3.36%
Aug. 3, 2017 AC -5.45%
May 4, 2017 AC +9.20%
March 1, 2017 AC -2.63%
Nov. 9, 2016 AC +10.67%
Aug. 10, 2016 AC -6.19%
May 12, 2016 AC +9.74%
March 7, 2016 AC -11.83%
Avg (+ or -) 9.21%
Bias -1.28%, negative bias on earnings.
With stock at 53.00 the data suggests these ranges:
Based on current IV (expected move into Friday per TOS): 47.81 to 58.19
Based on AVERAGE move over last 12 quarters: 48.12 to 57.88
Based on MAXIMUM move over last 12 Q’s (18.0%): 43.45 to 62.55
Open to requests for other symbols.
#Earnings — $M reports tomorrow morning. Below are details on earnings one-day moves over the last 12 quarters. (5-day results had roughly the same extremes).
Nov. 14, 2018 BO -7.18%
Aug. 15, 2018 BO -15.94%
May 16, 2018 BO +10.82%
Feb. 27, 2018 BO +3.46%
Nov. 9, 2017 BO +10.98%
Aug. 10, 2017 BO -10.24%
May 11, 2017 BO -17.00% Biggest DOWN
Feb. 21, 2017 BO -0.03%
Nov. 10, 2016 BO +5.60%
Aug. 11, 2016 BO +17.08% Biggest UP
May 11, 2016 BO -15.16%
Feb. 23, 2016 BO +3.04%
Avg (+ or -) 9.71%
Bias -1.21%, negative bias on earnings.
With stock at 24.70 the data suggests these ranges:
Based on current IV (expected move into Friday per TOS): 22.22 to 27.18
Based on AVERAGE move over last 12 quarters: 22.30 to 27.10
Based on MAXIMUM move over last 12 Q’s (17.1%): 20.48 to 28.92
Open to requests for other symbols.
#Earnings Sold $AZO March 1st 855/860-940/945 condors for 2.30. Fairly close to 1:1 R/R, but only at the average historical move, so definitely risky.
#Earnings — $AZO reports tomorrow morning. Below are details on earnings one-day moves over the last 12 quarters. (5-day results were actually less extreme, meaning extreme moves were faded after first day).
Dec. 4, 2018 BO +6.74% Biggest UP
Sept. 18, 2018 BO -1.97%
May 22, 2018 BO -9.48%
Feb. 27, 2018 BO -11.06%
Dec. 5, 2017 BO +0.42%
Sept. 19, 2017 BO -5.00%
May 23, 2017 BO -11.84% Biggest DOWN
Feb. 28, 2017 BO -0.58%
Dec. 6, 2016 BO +0.43%
Sept. 22, 2016 BO -0.42%
May 24, 2016 BO +2.47%
March 1, 2016 BO +2.06%
Avg (+ or -) 4.37%
Bias -2.35%, negative bias on earnings (1-day), but 5-day results show no bias… extreme negative moves were faded over the following days.
With stock at 900.00 the data suggests these ranges:
Based on current IV (expected move into Friday per TOS): 853.07 to 946.93
Based on AVERAGE move over last 12 quarters: 860.65 to 939.35
Based on MAXIMUM move over last 12 Q’s (11.8%): 793.44 to 1,006.56
Open to requests for other symbols.
#Earnings – Couldn’t watch the market until the close Friday. Caught a quick look at an article about Google and some new gaming stuff they’re developing so booked the BIDU early just in case.
Bought to Close BIDU FEB 22 2019 167.5 Put @ .70 (sold for 2.93)
#earnings #optionsexpiration
$NTES 217.5 put STO at 3.07. Thank you @fuzzballl for the jade lizard. It worked flawlessly.
#earnings Closed Early
$NTES BTC 237.5/232/5 BECS at .20 STO 2/20 at 2.28 completing @fuzzballl lovely lizard.
$FLR Double calendar 38 short straddle. BTC at .95. STO 2/21 at 2.70 Thank you @jeffcp66
#shortputs Yesterday
$HIIQ STO 3/15 40 put at 2.81
#Earnings Sold to close $HLF Feb22/Mar01 57.5 #DoubleCalendar for .78. Bought for .45 on Tuesday. Price started fading from its highs so I don’t think we’re making it up to 57.50 today.
I’m waiting on $AAOI until the bitter end. Looks like we may get a 14.50 pin.
#Earnings Sold to close $FLR #DoubleCalendar for .77. Bought for .44 yesterday. Stock is starting to rally so closed before it got away from me.
#earnings #shortstrangles BIDU
Not exactly an earnings trade, sold April 18, 140/200 strangle for 2.24.
Bought $AAOI Feb22/Mar01 14.5 dbl cals for .27
Bought $FLR Feb22/Mar01 38 dbl cals for .45
#Earnings #JadeLizard – Taking off the call side but still holding the 217.50 put for now….
Bought to Close NTES FEB 22 2019 232.5/237.5 Bear Call Spread @ .03
Sold March 15, 30/40 strangle for 1.35, tempting fate. In August I sold an earnings 45/55 that took until the end of December to settle. Thanks for the info Jeff.
#Earnings — $Z reports tonight. Below are details on earnings one-day moves over the last 12 quarters.
Nov. 6, 2018 AC -26.92% Biggest DOWN
Aug. 6, 2018 AC -14.77%
May 7, 2018 AC -1.44%
Feb. 8, 2018 AC -2.67%
Nov. 7, 2017 AC +2.67%
Aug. 8, 2017 AC -9.05%
May 4, 2017 AC +9.29%
Feb. 7, 2017 AC -6.37%
Nov. 1, 2016 AC +6.32%
Aug. 4, 2016 AC -4.73%
May 3, 2016 AC +12.05% Biggest UP
Feb. 11, 2016 AC -0.89%
Avg (+ or -) 8.10%
Bias -3.04%, negative bias on earnings.
With stock at 34.20 the data suggests these ranges:
Based on current IV (expected move into Friday per TOS): 30.28 to 38.12
Based on AVERAGE move over last 12 quarters: 31.43 to 36.97
Based on MAXIMUM move over last 12 Q’s (26.9%): 24.99 to 43.41
Open to requests for other symbols.
#Earnings — $ROKU reports tonight. Below are details on earnings one-day moves over its entire history.
Nov. 7, 2018 AC -22.29% Biggest DOWN
Aug. 8, 2018 AC +21.31%
May 9, 2018 AC -1.71%
Feb. 21, 2018 AC -17.71%
Nov. 8, 2017 AC +54.93% Biggest UP
Avg (+ or -) 23.59%
Bias 6.91%, positive bias on earnings.
With stock at 52.00 the data suggests these ranges:
Based on current IV (expected move into Friday per TOS): 44.88 to 59.12
Based on AVERAGE move over last 12 quarters: 39.73 to 64.27
Based on MAXIMUM move over last 12 Q’s (54.9%): 23.44 to 80.56
Open to requests for other symbols.
#Earnings — $BIDU reports tonight. Below are details on earnings one-day moves over the last 12 quarters.
Oct. 30, 2018 AC +3.64%
July 31, 2018 AC -7.73%
April 26, 2018 AC +5.54%
Feb. 13, 2018 AC +4.56%
Oct. 26, 2017 AC -8.15% Biggest DOWN
July 27, 2017 AC +9.45%
April 27, 2017 AC -4.06%
Feb. 23, 2017 AC -5.12%
Oct. 27, 2016 AC +2.56%
July 28, 2016 AC -3.64%
April 28, 2016 AC +4.45%
Feb. 25, 2016 AC +9.84% Biggest UP
Avg (+ or -) 5.73%
Bias 0.95%, positive bias on earnings.
With stock at 171.00 the data suggests these ranges:
Based on current IV (expected move into Friday per TOS): 161.90 to 180.10
Based on AVERAGE move over last 12 quarters: 161.20 to 180.80
Based on MAXIMUM move over last 12 Q’s (9.8%): 154.17 to 187.83
Open to requests for other symbols.
#Earnings — $OLED reports tonight. Below are details on earnings one-day moves over the last 12 quarters.
Nov. 1, 2018 AC -20.50% Biggest DOWN
Aug. 9, 2018 AC +13.54%
May 3, 2018 AC +12.43%
Feb. 22, 2018 AC -15.81%
Nov. 2, 2017 AC +9.52%
Aug. 3, 2017 AC -1.30%
May 4, 2017 AC +23.87% Biggest UP
Feb. 23, 2017 AC +20.08%
Nov. 3, 2016 AC +2.98%
Aug. 4, 2016 AC -8.01%
May 5, 2016 AC -0.76%
Feb. 25, 2016 AC -11.45%
Avg (+ or -) 11.69%
Bias 2.05%, positive bias on earnings.
With stock at 117.50 the data suggests these ranges:
Based on current IV (expected move into Friday per TOS): 105.41 to 129.59
Based on AVERAGE move over last 12 quarters: 103.77 to 131.23
Based on MAXIMUM move over last 12 Q’s (23.9%): 89.45 to 145.55
Open to requests for other symbols.
#Earnings #JadeLizard – Haven’t had a chance to mess with much earnings this quarter other than NVDA last week. I’ll take a shot at NTES today with a slightly bearish play since the stock is up today and at resistance. Using a Jade Lizard (no upside risk). This position would need the stock to trade lower on the announcement but no lower than slightly more than the expected move (212.30 b/e). Worse case scenario it turns into a covered call position with nice weekly premium.
Sold NTES FEB 22 2019 217.5/232.5/237.5 Jade lizard @ 5.20
#Earnings #LongStock #Assignment #DoubleCalendar
Sold half of my stock for 65.00 and 65.45. Assigned via 68 puts last week… cost basis 64.79. Looking to unload all of it; no interest in making this a longer term holding.
#Earnings — $NTES reports tonight. Below are details on earnings one-day moves over the last 12 quarters.
Nov. 14, 2018 AC +5.31%
Aug. 8, 2018 AC -10.96%
May 16, 2018 AC -7.45%
Feb. 7, 2018 AC -6.27%
Nov. 15, 2017 AC +7.85%
Aug. 9, 2017 AC -9.77%
May 10, 2017 AC -0.82%
Feb. 15, 2017 AC +14.08% Biggest UP
Nov. 9, 2016 AC -9.22%
Aug. 17, 2016 AC -2.67%
May 11, 2016 AC +0.43%
Feb. 24, 2016 AC -14.80% Biggest DOWN
Avg (+ or -) 7.47%
Bias -2.86%, negative bias on earnings.
With stock at 234.00 the data suggests these ranges:
Based on current IV (expected move into Friday per TOS): 216.53 to 251.47
Based on AVERAGE move over last 12 quarters: 216.52 to 251.48
Based on MAXIMUM move over last 12 Q’s (14.8%): 199.37 to 268.63
Open to requests for other symbols.
#earnings AMZN
Jan. 31, sold AMZN , March 15, 1490/1500 put spread for earnings for 1.27, closed today for .78.
#Earnings Bought to Open $HLF Feb22/Mar01 57.5 #DoubleCalendar for .45. (Got it for .42 in a TOS account)
#earnings #assignment #coveredputs GLW
January 28, sold a Feb. 15, earnings 25/30/30/35 iron fly that should have worked, (they all should work of course). I was assigned 100 short shares, basis just under 31, stock at 34. Sold a March 15, 32.50 put for .24.
#Earnings — $HLF reports tonight. Below are details on earnings one-day moves over the last 12 quarters.
Tue 10/30/2018 AC -2.61%
Wed 08/01/2018 AC +13.03%
Thu 05/03/2018 AC +4.47%
Thu 02/22/2018 AC +3.00%
Thu 11/02/2017 AC -2.92%
Tue 08/01/2017 AC -1.95%
Thu 05/04/2017 AC +11.57%
Thu 02/23/2017 AC -4.51%
Tue 11/01/2016 AC -6.19% Biggest DOWN
Wed 08/03/2016 AC +0.74%
Thu 05/05/2016 AC +9.08%
Thu 02/25/2016 AC +20.52% Biggest UP
Avg (+ or -) 6.72%
Bias 3.69%, strong positive bias on earnings.
With stock at 99.30 the data suggests these ranges:
Based on current IV (expected move into Friday per TOS): 53.81 to 61.19
Based on AVERAGE move over last 12 quarters: 53.64 to 61.36
Based on MAXIMUM move over last 12 Q’s (20.5%): 45.70 to 69.30
Open to requests for other symbols.
#Earnings #CoveredCalls #ShortPuts – A few more in this one…
Bought to Close NVDA FEB 15 2019 150.0 Put @ .01 (sold for 4.50)
Sold NVDA MAR 15 2019 145.0 Put @ 2.46
Rolled a covered call out a few weeks…
Rolled NVDA FEB 15 2019 148.0 Call to MAR 08 2019 150.0 Call @ 1.50 credit (picking up 3.50 of upside)
#Earnings Sold to close $UAA Feb 15th 21 calls for .16. This was a sad one; bought the #LongStraddle for 2.50… the swings this week afforded opportunities to cut the loss to less than half, but my orders barely missed getting filled again and again. So although I did sell a few for 1.60, the stock ended the week right at my strike… not good for a long straddle!
#CoveredCalls #Assignment $PVTL stock called away via 18 and 19 calls. This was a September earnings trade, was assigned at 22.50 and through multiple rounds of covered calls I’m exiting at about break-even.
#DoubleCalendar Taking assignment of $NTAP stock, cost basis 64.79.
#IronCondor Closed $DECK short 145 calls for 1.30. Was able to exit some at .50 and .20, so overall this trade will be a small winner or a small loser across my accounts. Condor sold for .86 on Jan 31st.
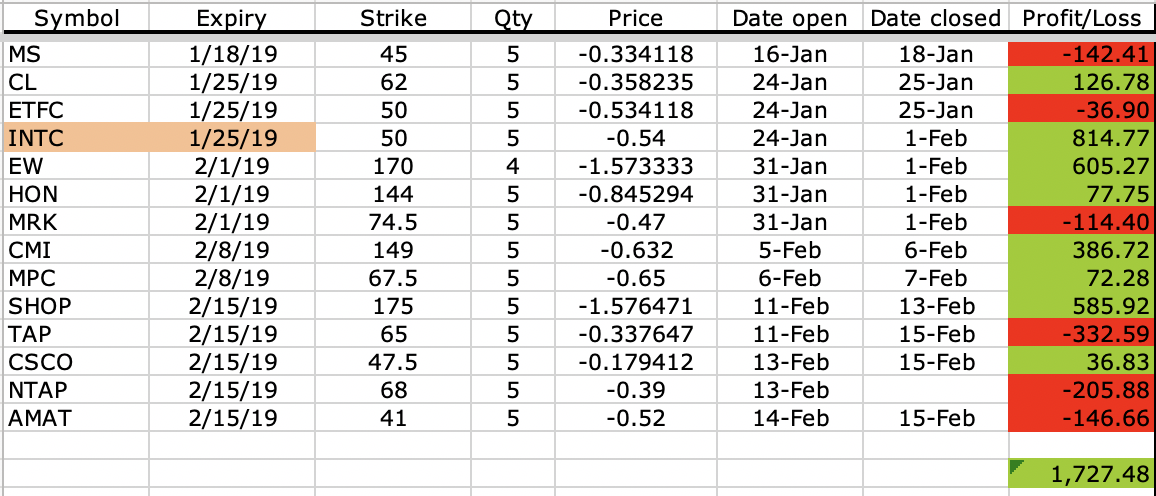
#Earnings #DoubleCalendar Here’s the performance this quarter of double calendars. It is performing better than last quarter, with over $1,700 in profit, using 5-lots.
NOTE: NTAP here is accounted as full loss, even though I will probably hold stock in to next week.
NOTE ALSO: INTC here is accounted as taking stock assignment and then closing all a week later. What I actually did was close only half, and converted the other half of stock into a #PieTrade.
#Earnings Sold to close $AMAT Feb15/Feb22 #DoubleCalendar for .28. Bought yesterday for .52. Couldn’t get off its ass enough to make it a winner.
#Earnings — $WMT reports Tuesday morning (after Monday holiday). Below are details on earnings one-day moves over the last 12 quarters.
Nov. 15, 2018 BO -1.96%
Aug. 16, 2018 BO +9.33%
May 17, 2018 BO -1.90%
Feb. 20, 2018 BO -10.17% Biggest DOWN
Nov. 16, 2017 BO +10.89% Biggest UP
Aug. 17, 2017 BO -1.58%
May 18, 2017 BO +3.22%
Feb. 21, 2017 BO +2.99%
Nov. 17, 2016 BO -3.08%
Aug. 18, 2016 BO +1.87%
May 19, 2016 BO +9.58%
Feb. 18, 2016 BO -3.01%
Avg (+ or -) 4.97%
Bias 1.35%, positive bias on earnings.
With stock at 99.30 the data suggests these ranges:
Based on current IV (expected move into Friday per TOS): 95.03 to 103.57
Based on AVERAGE move over last 12 quarters: 94.37 to 104.23
Based on MAXIMUM move over last 12 Q’s (10.9%): 88.49 to 110.11
Open to requests for other symbols.
#Earnings Sold to Close $CSCO Feb15/Feb22 47.5 #DoubleCalendar for .30. Bought for .18 on Wednesday. Stock came down enough for a small profit, but was too far from strike to make it a good one.
#earnings NVDA
Bought March 15, 120/185 strangle for 1.10, sold yesterday for 1.61
#Earnings #DoubleCalendar Was assigned stock on over half of my position in $NTAP; Feb 15th 68 short puts. I just sold the Feb 22nd LONG puts for 3.60. I will now watch for some intraday strength in the stock to sell the stock, as well as cover the remaining short puts that were not assigned. If I can net a .39 difference (the price of the original double calendar), the trade will be breakeven. Higher and it will turn a profit.
#shortputs
$HIIQ STO 3/15 31 puts at 1.19 Thank you @honkhonk81.
$NVTA STO 3/15 15 puts at 1.00
#earnings
$NVDA STO 3/15 120/189 straddle at 1.70. Thank you @thomberg1201
#bups
$NFLX STO 3/15 325/335 BUPS at 2.50 Thank you @ramie77
#perpetualrollingstrangles
$TQQQ BTC 2/15 50 calls and STO 3/15 53 calls for additional .80 credit.
Happy Valentines Day to all. Not much left of it but enjoy.
#Earnings #DoubleCalendar Bought to open $AMAT Feb15/Feb22 41 dbl cals for .52
#earnings
$NVDA STO 2/15 140 @ .90
#earnings NVDA
Sold March 15, 120/185 strangle for 1.60, strikes are well outside the average moves, not the max though. Thanks Jeff.
