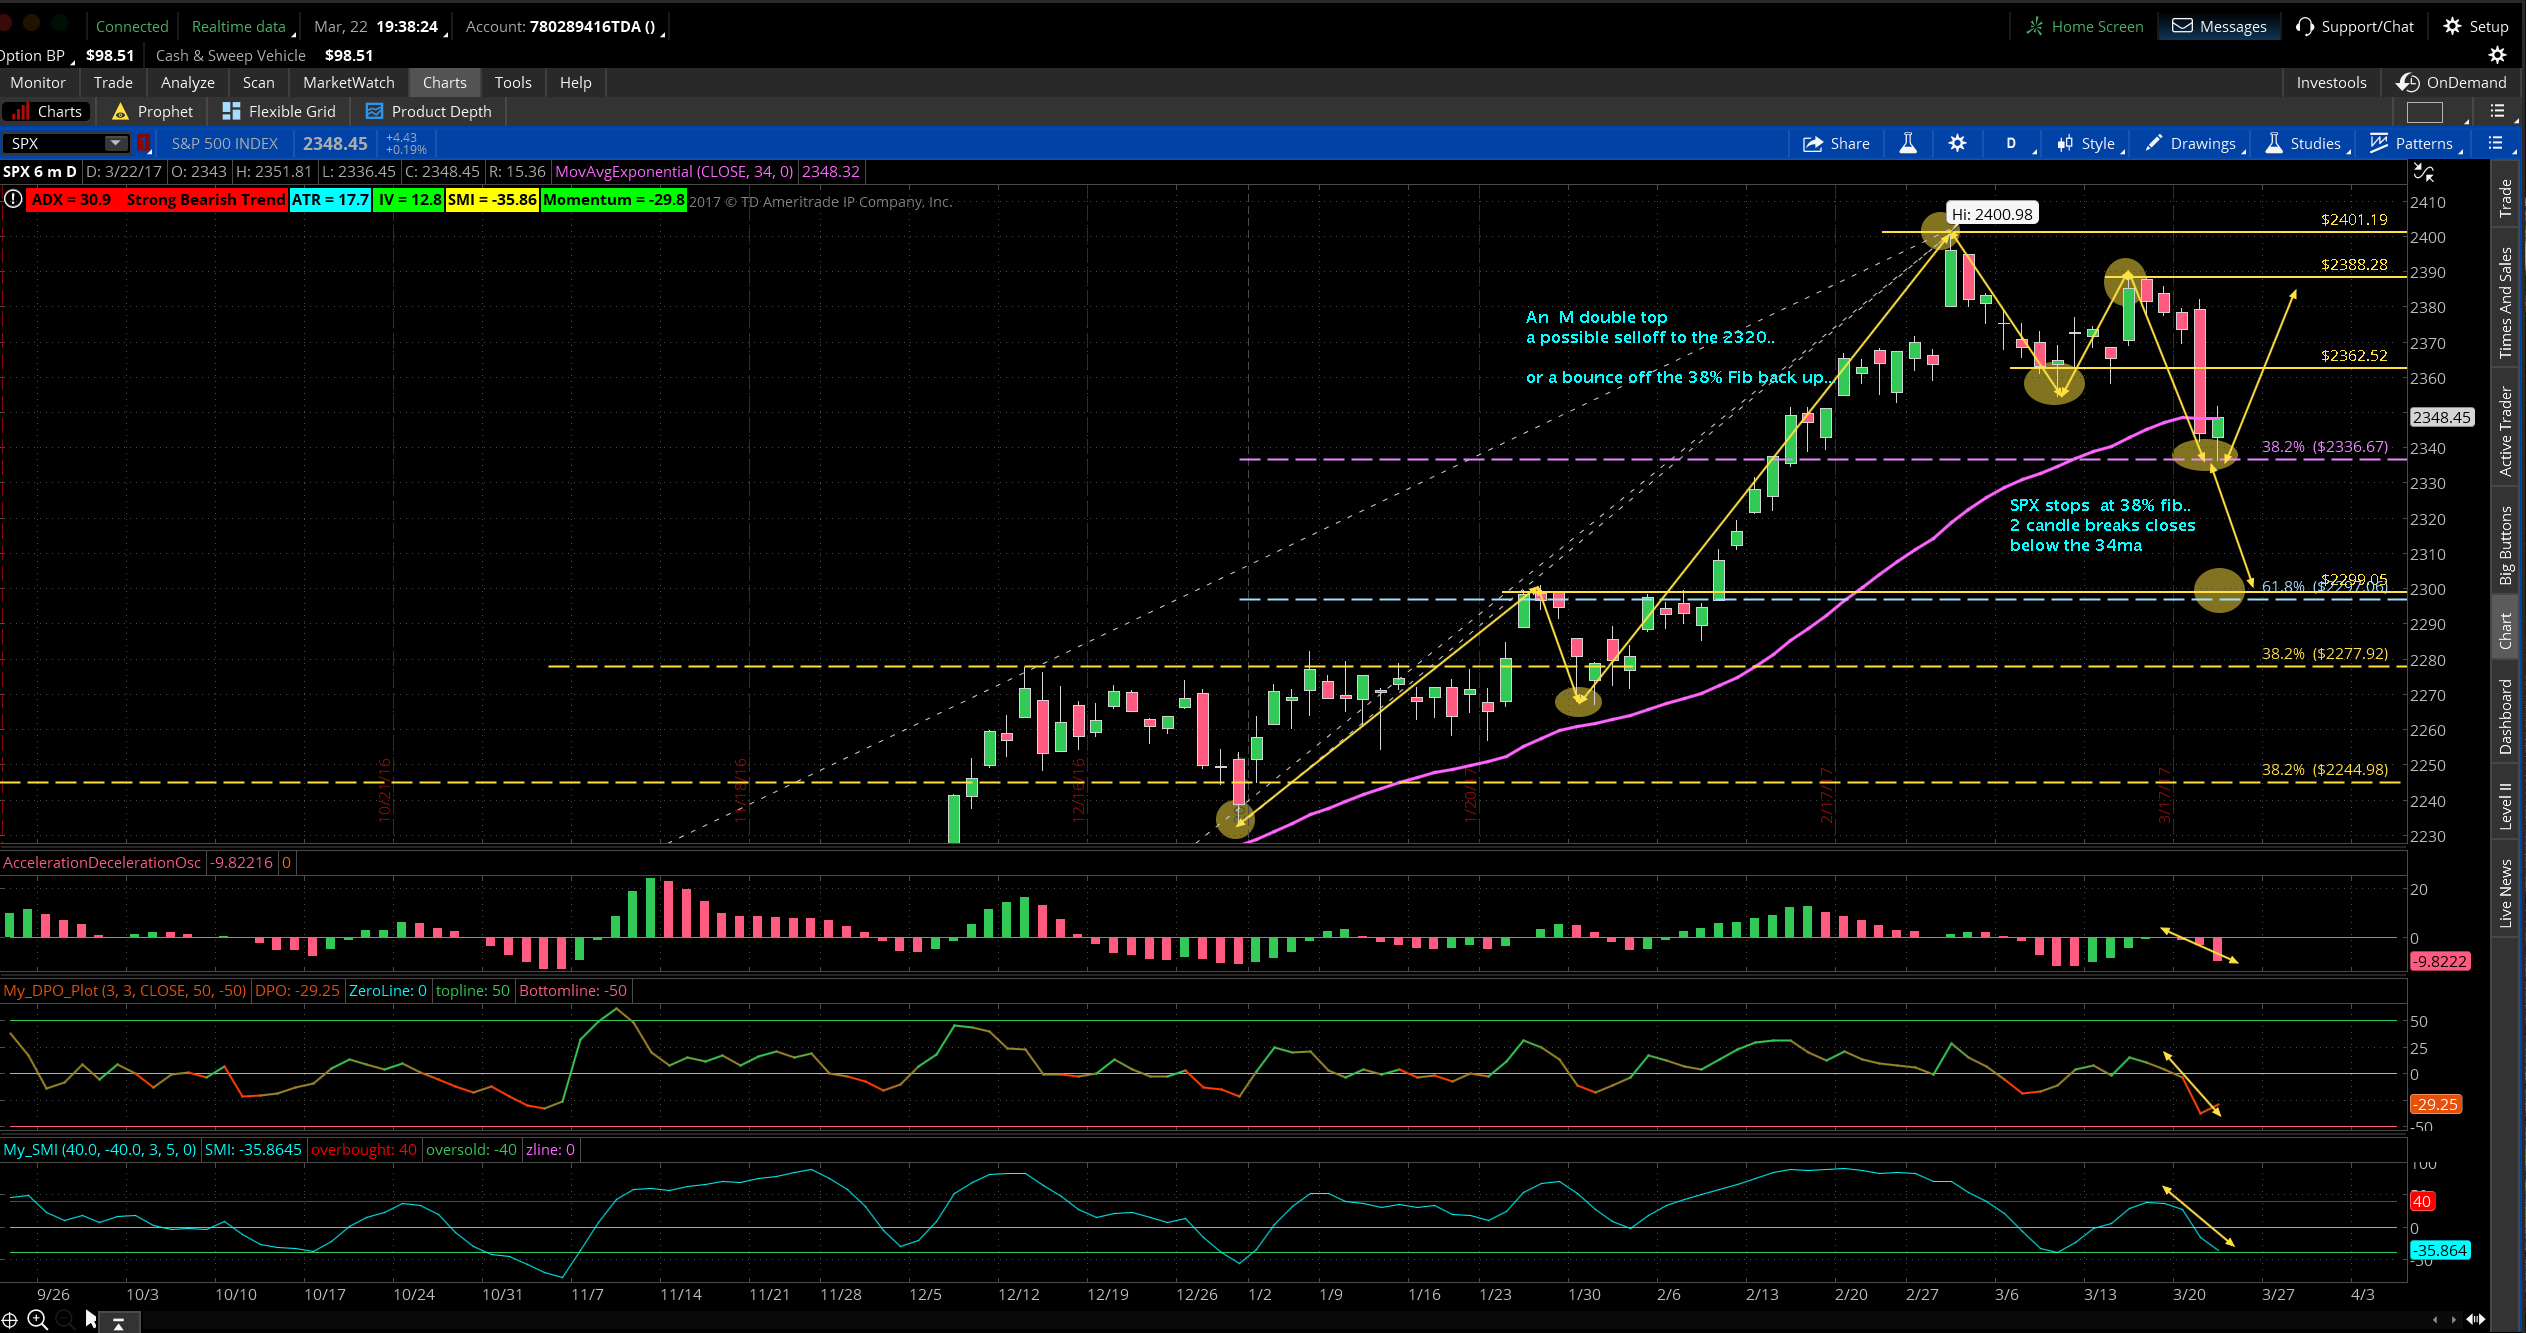
My SPX chart as of today….a double top, kind of..that could sell off to the 61% fib at 2300..2 candle closes below the 34ma..usually the 34ma holds support..if support breaks and fails, a good chance of a sell to the 61% at 2300..
my indicators signalled a selloff 4 days ago..as well as the skew stat I posted …
if the 38% fib is support and holds, which is quite likely, as SMI is about to bottom and roll..I’ll sell BUPS…If the 38 breaks down, I’ll hold my Long put and wait for the bottom at the 61% Fib..also the 34ma isnt signalling a down trend..yet..a hopefully good sign for a bounce..