
#VIXIndicator A double warning today as $VIX closed up over 25% from yesterday’s close and is also up over 50% from the August 11th VIX low. Expect lower markets in the coming days or weeks.
Daily Archives: Thursday, September 3, 2020
UVXY
#ShortPuts – This might get volatility to come down a little. Going for one night scalp…roll if needed.
Sold UVXY SEP 4 2020 26.0 Puts @ .21
No trade
AAL
Bought back half of my AAL 09/04/2020 15.50 Diagonal Calls @ 0.01 to release a bit of margin.
They won’t trade any lower.
VXX Calls
Just to force me to stay long and not bail too soon:
Liquidated my long VXX September 18 2020 80.0 Calls and also shorted them @ 0.25.
Sold against long October and November 70.0 Calls so no upside risk.
CRWD & FIVE earnings
#Earnings Unless it rallies tomorrow, looks like $CRWD will be a bust, but it was sold ITM so I knew the risk…
BTC $FIVE Sept 4th 112 puts for .05. Will let the call side wait for tomorrow.
UVXY
#ShortPuts – A couple of my bigger positions so have to take the one day gains. Looking for a re-entry on any decent drop.
Bought to Close UVXY SEP 11 2020 21.5 Puts @ .19 (sold for 1.17)
Bought to Close UVXY SEP 11 2020 22.0 Puts @ .25 (sold for 1.16)
Markets
Not much green here
Semis and software groups are the leading losers.
NO new lows in the SP500 yet so no #FallingKnife candidates today
https://www.finviz.com/map.ashx?t=sec
AMD strangle
Sold $AMD 10/16 65/110 strangle @ 3.42.
#TastyTradeFollow
SPY
Probably a nice bounce if it gets here
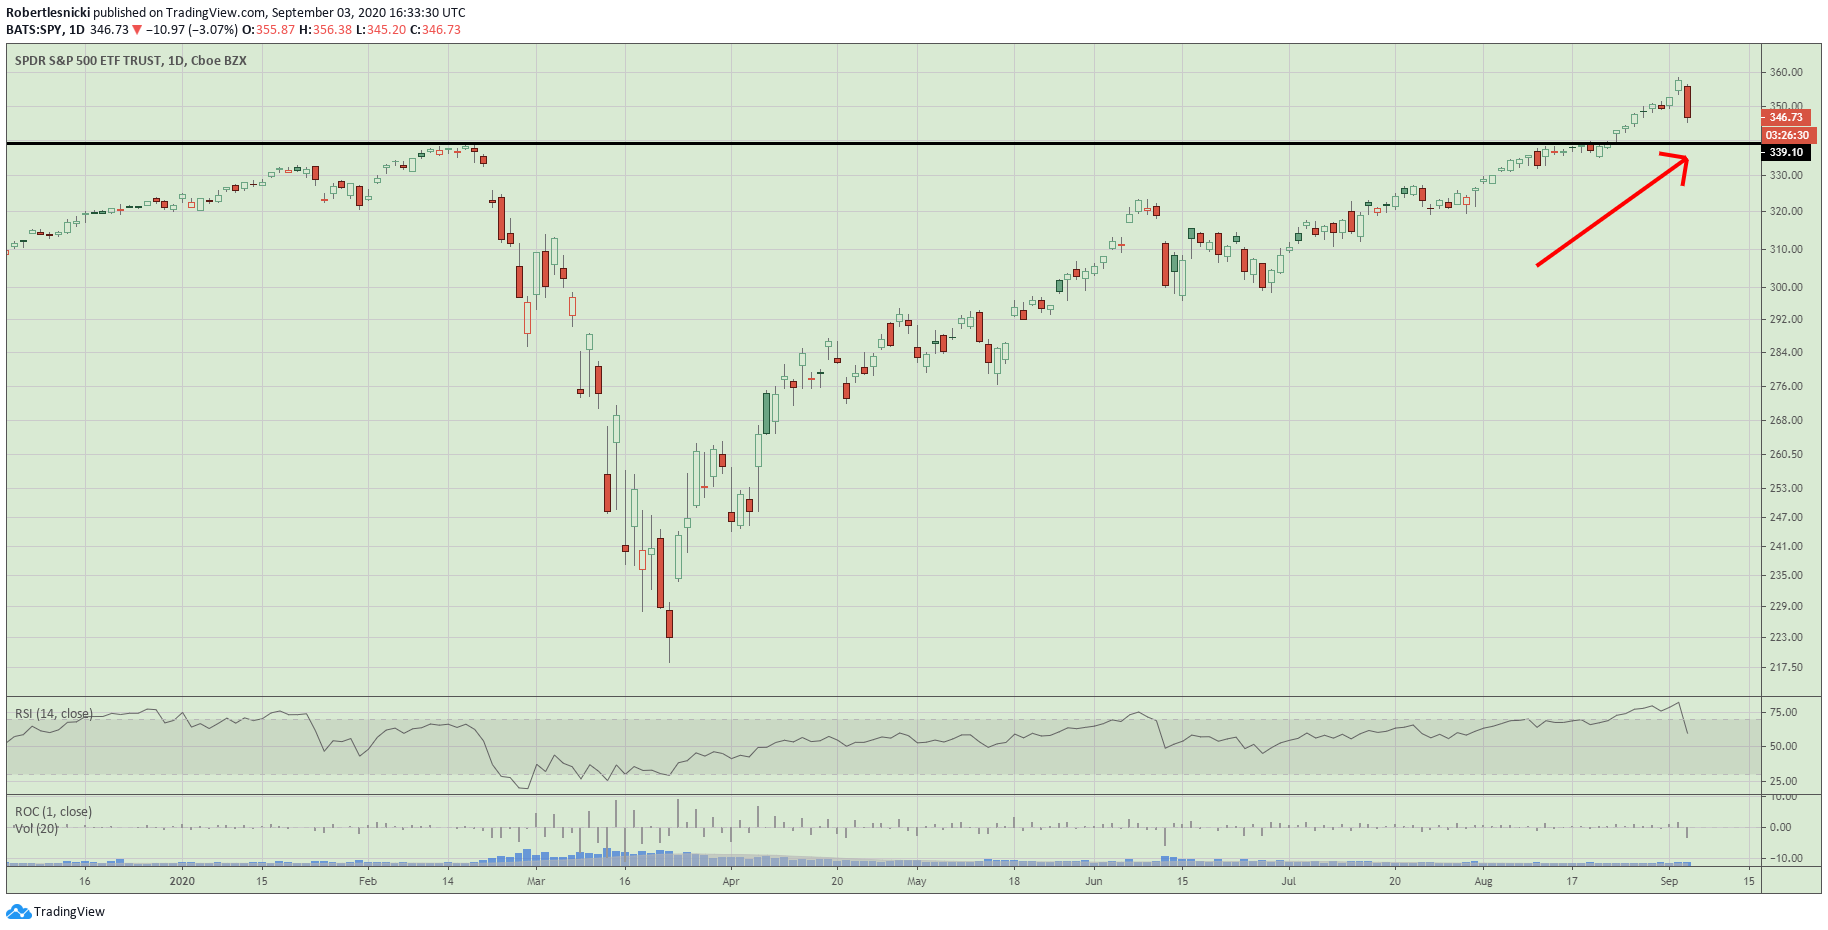
@DAN is right is will be the 3rd day down (ie: Tuesday)
SPX 7-dte
#SPX7dteLong Bought to Open $SPX Sept 9th 3460/3480-3490/3510 condors for 17.20, with SPX at 3480.
Also, yesterday: Sept 2nd 3490/3510 call spreads expired ITM for max credit of 20.00. Condors bought last Thursday for 16.45.
SQQQ
Bought to Close 1 Contract SQQQ Sep 04 2020 19 Put @ $0.01. It won’t trade any lower.
Sold earlier this week @ 0.22
CRWD post-earnings
Sold $CRWD 9/18 110/115/145/150 iron condor @ 1.40.
#vxxgame SOLD -1 VXX 20…
#vxxgame
SOLD -1 VXX 20 NOV 20 65 CALL @2.76
had bto @ .92 on 8/13/20
AAPL Oct
Sold $AAPL 10/16 115/100 bull put spread @ 1.15. Short puts 24 delta. IV rank 55.
TRADES: Sticking with what I know best.
WKHS STO 9/11/20 20.0 CALLS @.73
THC STO 9/11/20 29.0 ATM CALLS @1.12
WKHS STO 9/11/12 16.5 PUT @.60
VIX
Thursday’s levels to watch: The Upside Warning will be canceled with an intraday VIX high of 30.42.
WE ARE THERE 🙂
Good time to have 10 excess long calls in VXX
Upside Warning canceled!
VIX has spiked over 50% higher than its recent low.
Looks like I picked the…
Looks like I picked the wrong week to quit sniffing glue
Rolled 9/4 3475/3500/3600/3625 iron condor out to 9/9 3455/3480/3570/3595 for .30 credit
#earningsfive Yesterday STO 4 Sep…
#earningsfive
Yesterday STO 4 Sep Bups 112/107 for 1.50
Today, BTC for .10
Thanks Jeff for the data
#earningsFIVE
VXX I would have expected…
VXX
I would have expected more of a move here, could that indicate the 500 drop in /NQ isn’t that relevant? It is to me though.
Markets
Misleading headline of the day
“The Nasdaq Has Given Up All Of September’s Gains”
Interesting read…
https://www.zerohedge.com/markets/classic-feedback-loop-why-everyone-chasing-gamma-crash
TQQQ
#ShortPuts – Adding….
Sold TQQQ SEP 18 2020 120.0 Put @ 2.05
WFC Covered Calls
Sold WFC SEP 25 2020 $30 CALLS @ 0.11
The stock is bouncing around just above 25.
The premium is about equal to the new quarterly dividend, which is not a lot these days.
In my estimation banks are pretty Covid-proof so I’ll hold on for an eventual recovery.
It would be nice if they managed their business better though 😦
TRADES:
MS BTO STOCK @54.03 & 54.16 on the Point & Figure chart’s ascending triple top’s breakout, and double chart breakout buy signals. We’ll see.
AVGO earnings analysis
#Earnings $AVGO reports tonight. Below are details on earnings one-day moves over the last 12 quarters.
June 4, 2020 AC +2.65%
March 12, 2020 AC +7.05%
Dec. 12, 2019 AC -3.77%
Sept. 12, 2019 AC -3.41%
June 13, 2019 AC -5.56% Biggest DOWN
March 14, 2019 AC +8.23% Biggest UP
Dec. 6, 2018 AC +0.58%
Sept. 6, 2018 AC +7.69%
June 7, 2018 AC -2.53%
March 15, 2018 AC -4.81%
Dec. 6, 2017 AC
Aug. 24, 2017 AC -3.70%
Avg (+ or -) 4.17%
Bias 0.20%, no significant bias on earnings.
With stock at 365.00 the data suggests these ranges:
Based on current IV (expected move into Friday per TOS): 340.68 to 389.32 (+/- 6.7%)
Based on AVERAGE one-day move over last 12 quarters: 349.80 to 380.20
Based on MAXIMUM one-day move over last 12 Q’s (8.2%): 334.96 to 395.04
Based on DOWN max only (-5.6%): 344.71
Open to requests for other symbols.
