
#SPX1dte Sold $SPX Oct 18th (Friday PM) 2950/2960-3025/3035 condors for .45. 10-wide, double size. IV 9.42%, SPX 2997.
Recent Updates Page 234
MAN earnings analysis
#Earnings $MAN reports tomorrow morning. Below are details on earnings one-day moves over the last 12 quarters.
July 19, 2019 BO +0.03%
April 18, 2019 BO +11.60% Biggest UP
Jan. 31, 2019 BO +3.95%
Oct. 19, 2018 BO -3.77%
July 20, 2018 BO +0.52%
April 20, 2018 BO -14.48% Biggest DOWN
Feb. 2, 2018 BO -7.35%
Oct. 20, 2017 BO +0.04%
July 24, 2017 BO -8.96%
April 21, 2017 BO -2.89%
Jan. 31, 2017 BO +0.84%
Oct. 21, 2016 BO +9.71%
Avg (+ or -) 5.35%
Bias -0.90%, negative bias on earnings.
With stock at 85.50 the data suggests these ranges:
Based on current IV (expected move into Friday per TOS): 80.84 to 90.16
Based on AVERAGE one-day move over last 12 quarters: 80.93 to 90.07
Based on MAXIMUM one-day move over last 12 Q’s (14.5%): 73.12 to 97.88
Based on UP max only (+11.6%): 95.42
Open to requests for other symbols.
TEAM earnings analysis
#Earnings $TEAM reports tonight. Below are details on earnings one-day moves over the last 12 quarters.
July 25, 2019 AC +8.57%
April 17, 2019 AC -8.31%
Jan. 17, 2019 AC -2.42%
Oct. 18, 2018 AC -14.29% Biggest DOWN
July 26, 2018 AC +10.48%
April 19, 2018 AC -6.53%
Jan. 18, 2018 AC -4.55%
Oct. 19, 2017 AC +24.64% Biggest UP
July 27, 2017 AC -2.18%
April 27, 2017 AC +3.01%
Jan. 19, 2017 AC +2.22%
Oct. 27, 2016 AC -3.92%
Avg (+ or -) 7.59%
Bias 0.56%, slight positive bias on earnings.
With stock at 122.00 the data suggests these ranges:
Based on current IV (expected move into Friday per TOS): 112.00 to 132.00
Based on AVERAGE one-day move over last 12 quarters: 112.74 to 131.26
Based on MAXIMUM one-day move over last 12 Q’s (24.6%): 91.94 to 152.06
Based on DOWN max only (-14.3%): 104.57
Open to requests for other symbols.
CMG
BTC $CMG 790/800 10/18/2019 #BuPS @0.14. Was STO 10/10 @1.5.
URI closed
#Earnings . Sold to close $URI Oct18/Oct25 122p/123p #DoubleCalendar for 1.55. Possible to get over 2.00 now. Bought yesterday for .97 – 1.05.
NFLX
Closing ROKU
Bought to close $ROKU 10/18 130/140/155/165 iron condor @ 3.73. Overall profit on rolled/adjusted position:
-Original sale 9/20 170/180 BeCS @ 2.82
-Rolled 9/20 170/180 BeCS out to 10/18 130/140/180/190 iron condor @ .54 credit
-Rolled 9/20 170/180 BeCS down to 155/165 BeCS @ 1.37 credit
Total credit taken in: 4.73
Debit to close: 3.73
Profit: 1.00
I was running out of time (as of Monday was looking at a full loss on the put spread side) but the move up over the last couple of days has helped this position. Been on the wrong end of strong moves enough times so I’ll take this one and move on.
XBI
#ShortPuts – Nice recovery in this thing…
Bought to Close XBI OCT 18 2019 78.0 Puts @ .09 (sold for 1.55)
#earnings #closing URI HON URI…
#earnings #closing URI HON
URI #shortstrangles Sold Nov. 15, 105/140 for 2.08, bought today for 1.00
URI #doublecalendar Following Jeff-bought double calendar for 1.00, sold today for 1.62
HON #doublecalendar Following Jeff-bought double calendar for .89, sold today for 1.21
Thank you Jeff for the data and trade ideas
NFLX put spread
Sold $NFLX 11/15 275/265 bull put spread @ 1.72
URI
#ShortPuts – Not an earnings trade but still gotta book for an overnight gain. This filled immediately and I had placed the order a dime under the mid. Might be able to do even better.
Bought to Close URI NOV 22 2019 112.0 Put @ .90 (sold for 2.65)
TSLA
STO $TSLA 300/310 Nov 15 2019 #BeCS @1.21
SOXL
#ShortPuts – Just a small one taking off 30 days early…
Bought to Close SOXL NOV 15 2019 100.0 Put @ .30 (sold fat finger for 2.80)
UVXY
#BearCallSpreads – Completely out of Nov call spreads now. Will be looking to add to Dec and start Jan on next spike…
Bought to Close UVXY NOV 15 2019 37.0/47.0 Bear Call Spreads @ .15 (sold for 1.60 average)
Bought to Close UVXY NOV 15 2019 35.0/45.0 Bear Call Spreads @ .18 (sold for 1.30 average)
Closing NUGT
Bought to close 10/18 27 calls @ .96 (sold for 5.07 on 9/16). This was a rollout from 9/20 26 calls. Overall profit .74.
DRIP
#BearCallSpreads – OK…I’m really done now. Full position.
Sold DRIP DEC 20 2019 130.0/140.0 Bear Call Spreads @ 1.50
NFLX dub cal closed
#Earnings Sold to close $NFLX Oct18/Oct25 285 #DoubleCalendar for 3.00. Bought yesterday for 1.37. You will be able to get more if price continued to drop toward the strike.
NFLX short calls
Sold $NFLX 11/15 340 calls @ 1.30. Covered (against long stock).
ISRG earnings analysis
#Earnings $ISRG reports tonight. Below are details on earnings one-day moves over the last 12 quarters.
July 18, 2019 AC -1.45%
April 18, 2019 AC -7.00% Biggest DOWN
Jan. 24, 2019 AC -3.93%
Oct. 18, 2018 AC -3.45%
July 19, 2018 AC -0.86%
April 17, 2018 AC +8.17% Biggest UP
Jan. 25, 2018 AC -2.12%
Oct. 19, 2017 AC +3.39%
July 20, 2017 AC -4.55%
April 18, 2017 AC +6.36%
Jan. 24, 2017 AC +5.09%
Oct. 18, 2016 AC -5.56%
Avg (+ or -) 4.33%
Bias -0.49%, slight negative bias on earnings.
With stock at 535.00 the data suggests these ranges:
Based on current IV (expected move into Friday per TOS): 512.55 to 557.45
Based on AVERAGE one-day move over last 12 quarters: 511.85 to 558.15
Based on MAXIMUM one-day move over last 12 Q’s (8.2%): 491.29 to 578.71
Based on DOWN max only (-7.0%): 497.55
Open to requests for other symbols.
#earnings #closing NFLX Yesterday sold…
$NFLX Earnings
Netflix EPS beats by $0.42, revenue in-line
Netflix (NASDAQ:NFLX): Q3 GAAP EPS of $1.47 beats by $0.42.
Revenue of $5.25B (+31.3% Y/Y) in-line.
Global streaming paid memberships 158.33M (+21.4% Y/Y), net addition 6.77M
MTN BUPS Closed
#bups
$MTN BTC 10/18 220/230 at 1.70. STO at 3.50
Upside Warning
#VIXindicator An inside day on the VIX chart is the third close below 15.05 in a row, meaning an Upside Warning is in effect. Look for higher prices in the coming days. I’m proceeding cautiously after last month’s headfake. I only have one bullish trade (put spread sold this morning).
Expiring today: $SPX Oct 16th 2945/2955-3030/3040 condors sold yesterday for .45.
MEI
BTC 10/18/2019 35 calls @0.08. Stock is at 34.05.
#earnings NFLX #tastytradefollow #callbutterfly Sold…
#earnings NFLX
#tastytradefollow #callbutterfly
Sold Oct. 18, 300/310/310/325 for 1.25
URI
#ShortPuts – Not really an earnings trade but I’ll take a shot. Maybe add another on an implosion…
Sold URI NOV 22 2019 112.0 Put @ 2.65
Bistro problems
I have experienced some issues in the past weeks with Options Bistro log in as well.
The first steps to follow are:
Close your browser.
Reopen it.
Go to wordpress.com
Log in.
Leave the window open and open a new browser window or tab
Go to OptionsBistro.com.
Refresh the page.
If that doesn’t work you’ll need to clear the browser cache. Follow these instructions.
https://en.support.wordpress.com/browser-issues/#clearing-your-browser-cache
Please reply in the comments here if any of the above resolves your issues.
HON earnings analysis
#Earnings $HON reports tomorrow morning. Below are details on earnings one-day moves over the last 12 quarters.
July 18, 2019 BO +3.11%
April 18, 2019 BO +3.78% Biggest UP (tie)
Feb. 1, 2019 BO +0.75%
Oct. 19, 2018 BO -1.10% Biggest DOWN (also the ONLY down)
July 20, 2018 BO +3.78% Biggest UP (tie)
April 20, 2018 BO +1.64%
Jan. 26, 2018 BO +1.94%
Oct. 20, 2017 BO +1.20%
July 21, 2017 BO +1.03%
April 21, 2017 BO +2.67%
Jan. 27, 2017 BO +0.38%
Oct. 21, 2016 BO +0.75%
Avg (+ or -) 1.84%
Bias 1.66%, strong positive bias on earnings.
With stock at 164.00 the data suggests these ranges:
Based on current IV (expected move into Friday per TOS): 158.36 to 169.64
Based on AVERAGE one-day move over last 12 quarters: 160.98 to 167.02
Based on MAXIMUM one-day move over last 12 Q’s (3.8%): 157.80 to 170.20
Based on DOWN max only (-1.1%): 162.20
Open to requests for other symbols.
#earnings URI Sold Nov. 15,…
#earnings URI
Sold Nov. 15, 105/140 strangle for 2.08.
Thanks Jeff
URI dub cal
#Earnings Bought to Open $URI Oct18/Oct25 122p/123c #DoubleCalendar for 1.00. Not filled on all yet. Got one for .97 on TOS.
URI earnings analysis
#Earnings $URI reports tonight. Below are details on earnings one-day moves over the last 12 quarters.
July 17, 2019 AC -7.89%
April 17, 2019 AC +8.14%
Jan. 23, 2019 AC +6.29%
Oct. 17, 2018 AC -15.03% Biggest DOWN
July 18, 2018 AC +1.07%
April 18, 2018 AC -6.54%
Jan. 24, 2018 AC -1.94%
Oct. 18, 2017 AC +0.05%
July 19, 2017 AC +3.23%
April 19, 2017 AC -5.19%
Jan. 25, 2017 AC +11.20% Biggest UP
Oct. 19, 2016 AC +4.69%
Avg (+ or -) 5.94%
Bias -0.16%, no signoficant bias on earnings.
With stock at 123.00 the data suggests these ranges:
Based on current IV (expected move into Friday per TOS): 114.43 to 131.57
Based on AVERAGE one-day move over last 12 quarters: 115.70 to 130.30
Based on MAXIMUM one-day move over last 12 Q’s (15.0%): 104.51 to 141.49
Based on UP max only (+11.2%): 136.78
Open to requests for other symbols.
SHOP
#CoveredCalls – Rolling into #Earnings week…
Rolled SHOP OCT 18 2019 297.5 Call to NOV 01 2019 302.5 Call @ .70 credit
UNH
STO December 230 puts at 6.50
FDX
BTC the October 18, 150 puts at .85 which was part of an earnings trade at .88 cents. It was part of a jade lizard and am happy to be out of that one.
IBM earnings analysis
#Earnings $IBM reports tonight. Below are details on earnings one-day moves over the last 12 quarters.
July 17, 2019 AC +4.58%
April 16, 2019 AC -4.15%
Jan. 22, 2019 AC +8.46%
Oct. 16, 2018 AC -7.62% Biggest DOWN
July 18, 2018 AC +3.26%
April 17, 2018 AC -7.53%
Jan. 18, 2018 AC -3.99%
Oct. 17, 2017 AC +8.86% Biggest UP
July 18, 2017 AC -4.20%
April 18, 2017 AC -4.91%
Jan. 19, 2017 AC +2.24%
Oct. 17, 2016 AC -2.61%
Avg (+ or -) 5.20%
Bias -0.63%, slight negative bias on earnings.
With stock at 142.00 the data suggests these ranges:
Based on current IV (expected move into Friday per TOS): 135.06 to 148.94
Based on AVERAGE one-day move over last 12 quarters: 134.61 to 149.39
Based on MAXIMUM one-day move over last 12 Q’s (8.9%): 129.42 to 154.58
Based on DOWN max only (-7.6%): 131.18
Open to requests for other symbols.
SPX Monday
#SPX1dte Sold $SPX Oct 21st 2975/2950 put spreads for 4.90. IV: 11.44%, SPX 2990. Bullish positioning following both trend and #VIXindicator.
#earnings #closing GS UAL GS…
NFLX dub cal
#Earnings Bought to open $NFLX Oct18/Oct25 285 #DoubleCalendar for 1.37. This stock has typically been too volatile after earnings to be appropriate for this strategy. But two things: NFLX post-earnings moves have quieted in the last couple years, and the Dub-Cals perform well with higher priced stocks.
NFLX earnings analysis
#Earnings $NFLX reports tonight. Below are details on earnings one-day moves over the last 12 quarters.
July 17, 2019 AC -10.27% Biggest DOWN
April 16, 2019 AC -1.31%
Jan. 17, 2019 AC -3.98%
Oct. 16, 2018 AC +5.28%
July 16, 2018 AC -5.24%
April 16, 2018 AC +9.18%
Jan. 22, 2018 AC +9.97%
Oct. 16, 2017 AC -1.57%
July 17, 2017 AC +13.54%
April 17, 2017 AC -2.64%
Jan. 18, 2017 AC +3.86%
Oct. 17, 2016 AC +19.02% Biggest UP
Avg (+ or -) 7.16%
Bias 2.99%, positive bias on earnings.
With stock at 285.00 the data suggests these ranges:
Based on current IV (expected move into Friday per TOS): 257.13 to 312.87
Based on AVERAGE one-day move over last 12 quarters: 264.61 to 305.39
Based on MAXIMUM one-day move over last 12 Q’s (19.0%): 230.79 to 339.21
Based on DOWN max only (-10.3%): 255.73
Open to requests for other symbols.
Stuff this week
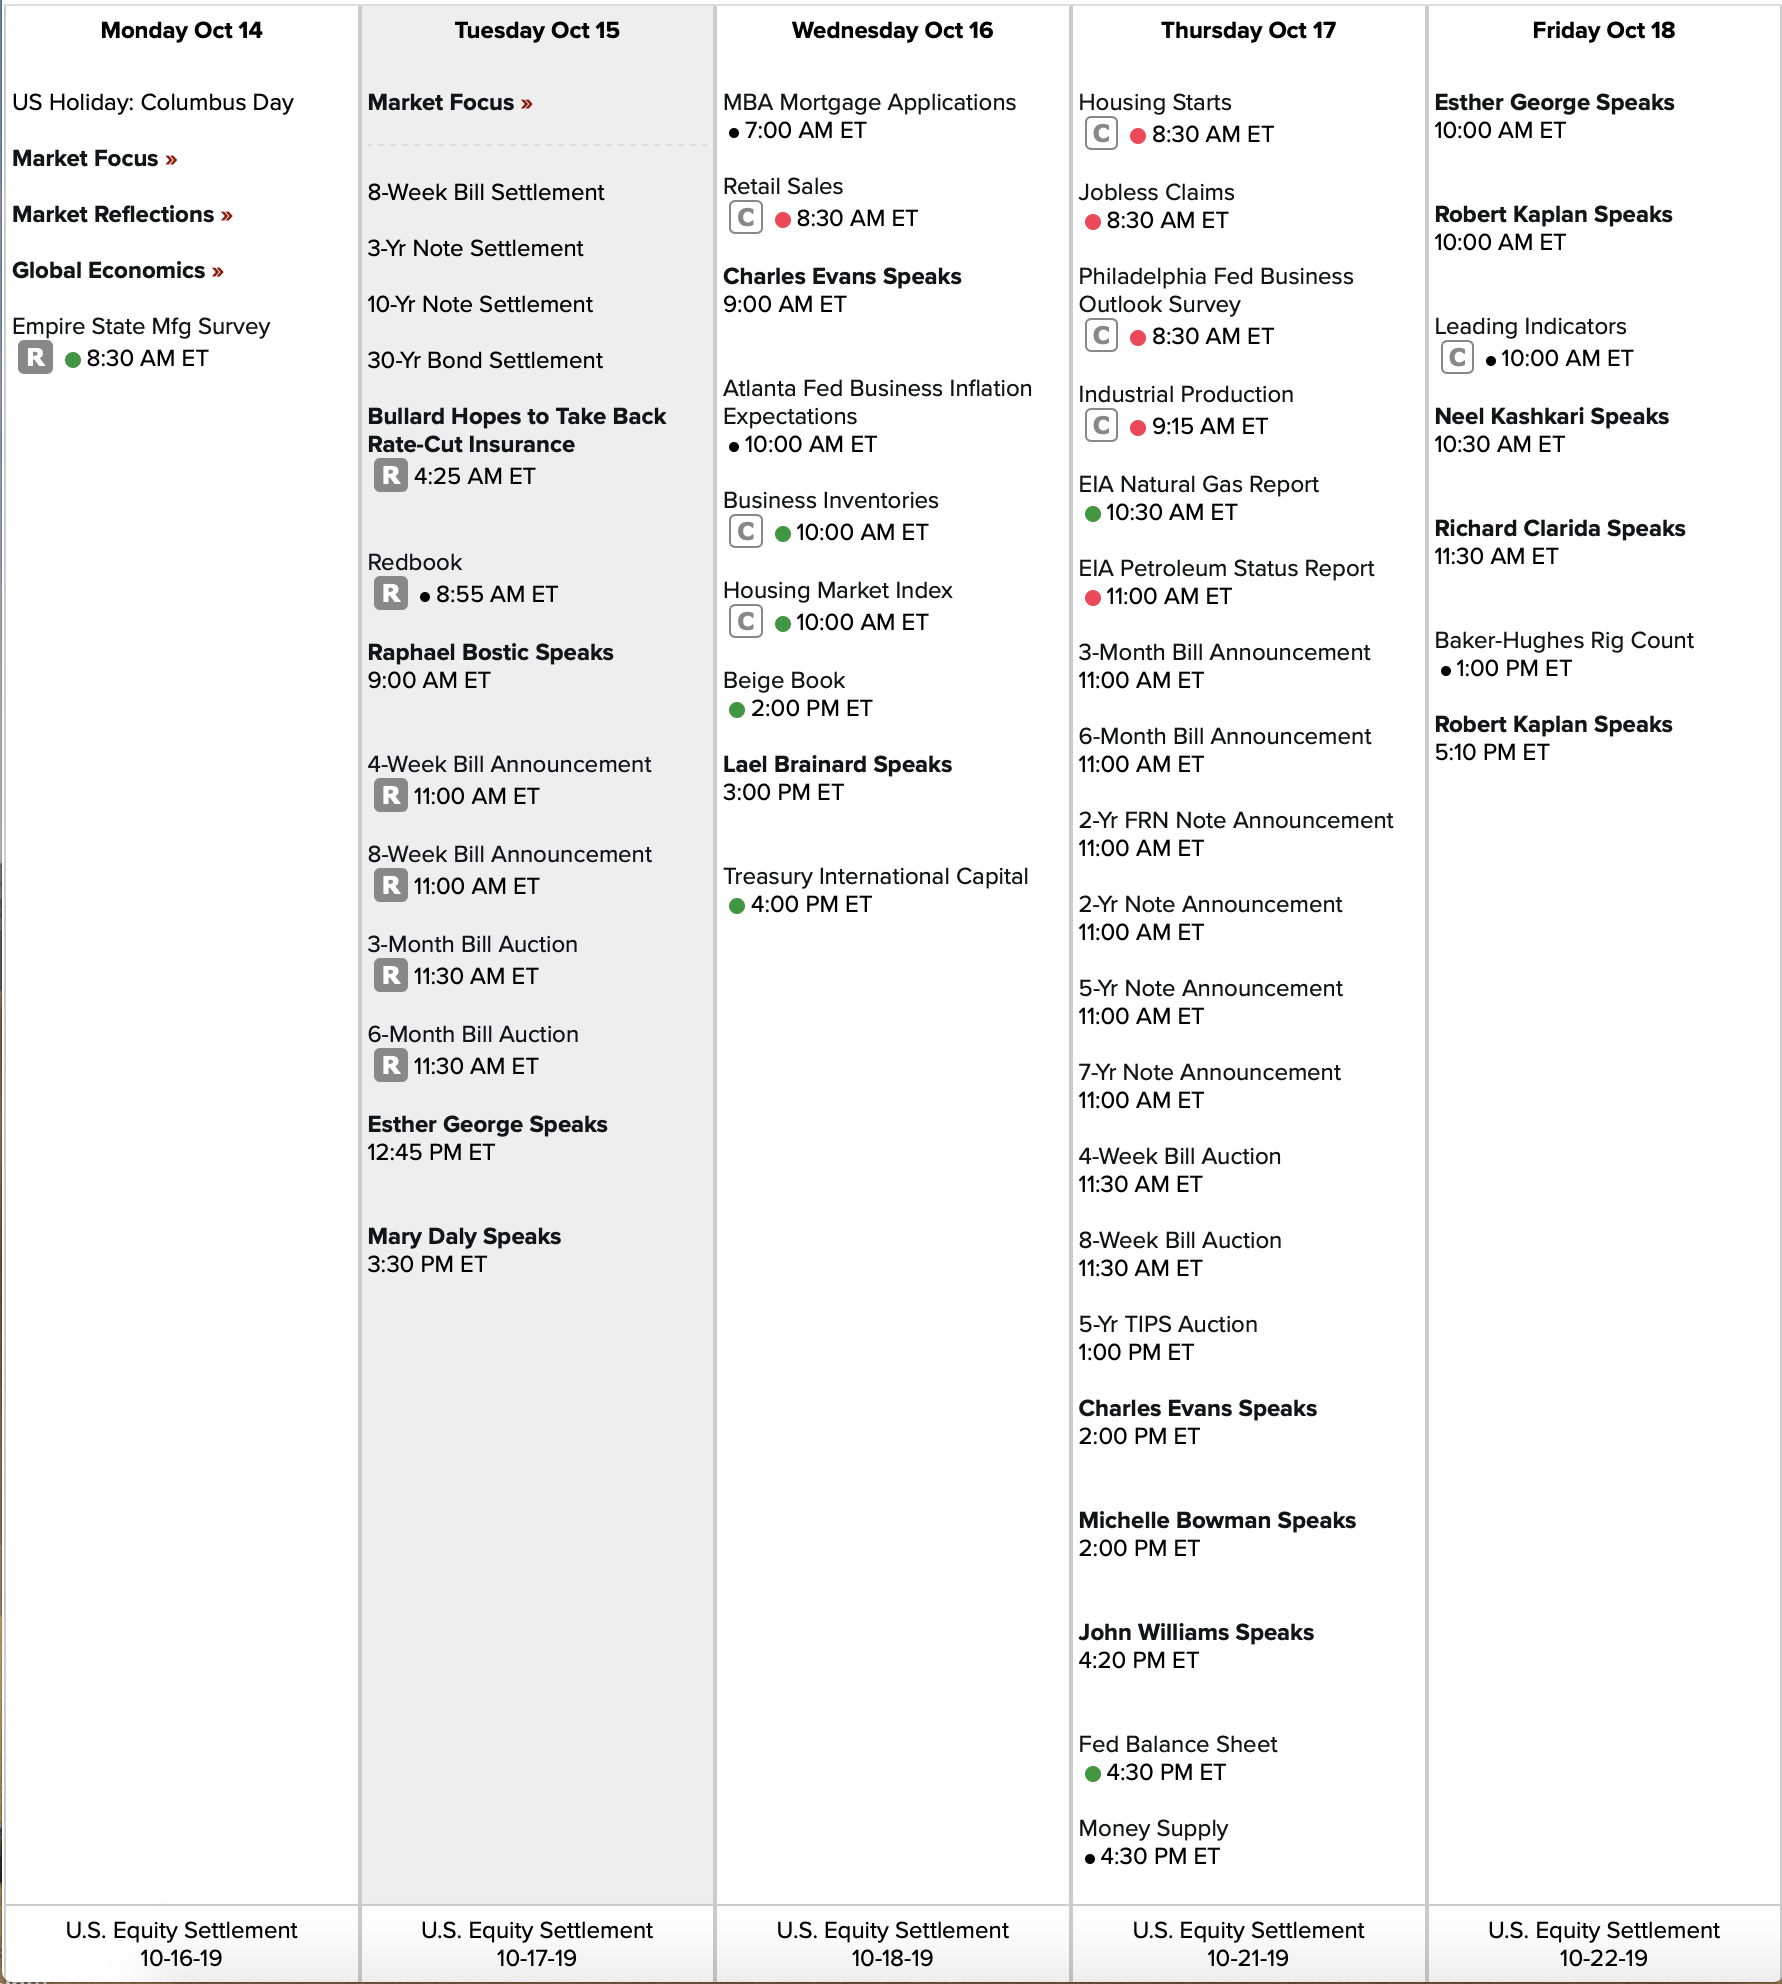

Link to calendar: https://us.econoday.com/byweek.asp?day=15&month=10&year=2019&cust=us&lid=0
SPX 1-dte
#SPX1dte Sold to Open $SPX Oct 16th 2945/2955-3030/3040 condors for .45. 10-wide, double size.
IV 10.34%, SPX 2998.
Closing SPX iron condors
Bought to close Oct 21 2920/2895 put spread + 3035/3060 call spread @ 3.15. Sold for 7.40 on 10/11.
Bought to close Oct 23 2910/2885 put spread + 3045/3070 call spread @ 3.20. Sold for 7.00 on 10/11.
Whiz update
Take it for what it’s worth (free) but it is a nice look at some of the issues simmering below the headlines.
NUGT closed
#ContangoETFs BTC $NUGT Jan 2020 55 calls for .54. Sold for 3.20 on July 18th.
SOXL
#ShortPuts – Another one bites the dust…
Bought to Close SOXL OCT 18 2019 150.0 Put @ .10 (sold for 5.00)
SPY
#ShortPuts – Back at the 3000 level so buying all my SPY back in…
Bought to Close SPY NOV 15 2019 275.0 Put @ .46 (sold for 3.35)
Bought to Close SPY DEC 20 2019 260.0 Put @ .83 (sold for 3.20)
VXX
STC 2x Jan 20 20.00 for $2.03
total profit on this group $425.00
Thanks Jeff
UAL earnings analysis
#Earnings $UAL reports tonight. Below are details on earnings one-day moves over the last 12 quarters.
July 16, 2019 AC +0.91%
April 16, 2019 AC +4.77%
Jan. 15, 2019 AC +6.35%
Oct. 16, 2018 AC +5.95%
July 17, 2018 AC +8.78% Biggest UP
April 17, 2018 AC +4.81%
Jan. 23, 2018 AC -11.44%
Oct. 18, 2017 AC -12.07% Biggest DOWN
July 18, 2017 AC -5.90%
April 17, 2017 AC -4.26%
Jan. 17, 2017 AC +0.35%
Oct. 17, 2016 BO -0.31%
Avg (+ or -) 5.49%
Bias -0.17%, no significant bias on earnings.
With stock at 87.50 the data suggests these ranges:
Based on current IV (expected move into Friday per TOS): 83.43 to 91.57
Based on AVERAGE one-day move over last 12 quarters: 82.69 to 92.31
Based on MAXIMUM one-day move over last 12 Q’s (12.1%): 76.94 to 98.06
Based on UP max only (+8.8%): 95.18
Open to requests for other symbols.
NVDA
#ShortPuts – Out a week early. Wouldn’t mind a pullback before earnings now…
Bought to Close NVDA OCT 25 2019 162.5 Put @ .10 (sold for 2.45)
#SueCollar Here’s a new one…
Here’s a new one I just added, this one has less than zero risk at the onset–it’s hard to get this design but I really like it, call premium is elevated due to earnings the week before. Notice the tight put, less than $2 away from stock purchase price, at close to 1/3rd the call premium. Good risk control here. The put roll might be tricky though with earnings looming in the new roll cycle, but we’ll deal with that the week of Nov 8, if not sooner.
TGT
Bought 300 shares @ 111.84
Bought 3 Nov 8 110 put @ 1.65
Sold 3 Nov 29 112 Call @ 4.70
Initial max risk is -$363, meaning I make $363 on a crash in the initial timeframe (Nov 8 expiration).
Earnings 11/20, Ex div 11/19
update: one thing though, the delta on this is only 36 on 300 shares, that’s usually lower than I like, I like around 25-30% delta. I can always sell some put spreads to bump up the delta if I want.
Downside Warning canceled
#VIX indicator Well, so much for that. The VIX close today cancels the Downside Warning and we may be on the way to another Upside Warning. Let’s hope the signals work on the next round.
$SPX Closed Early / GLOB Put / HIIQ Calls Rolled
#spxcampaign
$SPX BTC 10/21 3035/3060 BECS at .60. STO 10/11 at 4.72. Thank you @Ramie. The put side of the IC still open.
#shortputs
$GLOB STO 11/15 90 put at 2.80. Tip of the hat to @Ramie
#shortcalls
$HIIQ BTC 11/15 28 calls and STO 12/20 30 calls for added .15 debit.. Since September it has cost me $1.65 to roll from $20 covered call to current $30 covered call. Stock appears headed up. Stock now at 26.78.
NUGT, UVXY, SPLK and SPX 1-DTE
BTC UVXY 10/18/2019 35/45 Nov 15 2019 #BeCS @0.4. Was STO 10/2 @1.65.
BTC SPLK 10/18/2019 105/115 #BuPS @0.35. This had been rolled from the Sept earnings trade. ~$1.20/share gain (though I don’t have my tracking spreadsheet in front of me at the moment)
BTC NUGT 10/18/2019 20/29.5 #BuPS @1.95. Basically break-even, but this was the second round on a double-dip.
Wanted to take some risk off today. Been thinking over Friday’s SPX 1-DTE trade a bunch over the weekend. Short version, my stops triggered, as Jeff’s did, but I didn’t get fills. I canceled the BTC order, and then spent the day sweating it out, hoping for a pullback to get out of the position, which didn’t happen until the last 15 minutes of the trading day. My position expired valueless over the weekend, but being frank, could just as easily have been a big loss, if SPX had swung ~15 up instead of ~15 down. Pretty much dumb luck, not smart trading. Really don’t know what I was thinking, if I was thinking at all, when I canceled the BTC order. Hope and Luck aren’t smart trading. I’m also going to put a pause on the SPX 1-DTE trades for a while.
#closing DUST In July I…
#closing DUST
In July I sold a couple 9 puts after DUST had dropped to around 12 from around 25. Dust kept going down into the 5s while I kept rolling the puts. I closed them today for a $35 loss, not bad given where it was.
GLOB
STO November 15, 90 puts @ 2.75, stock is at 99
#earnings #jadelizard GS Jade lizard…
#earnings #jadelizard GS
Jade lizard with downside protection. Sold Nov. 15, 195 short put/205 short call/210 long call for 5.01. Bought Oct. 15, 195 put for .70.
Thanks for the data Jeff
GS earnings analysis
#Earnings $GS reports tomorrow morning. Below are details on earnings one-day moves over the last 12 quarters.
July 16, 2019 BO +1.86%
April 15, 2019 BO -3.81%
Jan. 16, 2019 BO +9.54% Biggest UP
Oct. 16, 2018 BO +3.01%
July 17, 2018 BO -0.18%
April 17, 2018 BO -1.64%
Jan. 17, 2018 BO -1.86%
Oct. 17, 2017 BO -2.60%
July 18, 2017 BO -2.59%
April 18, 2017 BO -4.71% Biggest DOWN
Jan. 18, 2017 BO -0.61%
Oct. 18, 2016 BO +2.14%
Avg (+ or -) 2.88%
Bias -0.12%, no significant bias on earnings.
With stock at 205.00 the data suggests these ranges:
Based on current IV (expected move into Friday per TOS): 198.11 to 211.89
Based on AVERAGE one-day move over last 12 quarters: 199.10 to 210.90
Based on MAXIMUM one-day move over last 12 Q’s (9.5%): 185.44 to 224.56
Based on DOWN max only (-4.7%): 195.34
I’m getting on a plane so won’t be able to do any others today; back tomorrow. Happy trading!
#shortcallspreads SPY Call me crazy,…
Call me crazy, sold a Nov. 15, 306/311 call spread for .90.
UVXY
#ShortPuts – I’m finding these act as a nice hedge on down days but easy to keep rolling lower for eventual profit. Sold against a bunch of call spreads…
Rolled UVXY OCT 11 2019 27.5 Puts to OCT 25 2019 26.5 Puts @ .17 credit
Rolled UVXY OCT 11 2019 26.5 Puts to OCT 25 2019 25.0 Puts @ .10 credit
ULTA
#CoveredCalls – Easing it up a little…
Rolled ULTA OCT 11 2019 237.5 Call to OCT 25 2019 240.0 Call @ .45 credit (3.25 total now)
REGN
#CoveredCalls – Rolling and keeping a little downside protection. Could be another fake out on the breakout. Wild ride last two weeks! Should get two more regular rolls and then the third into earnings…
Rolled REGN OCT 11 2019 295.0 Call to OCT 18 2019 297.5 Call @ .65 credit (8.40 total now)
SPX Iron Condor
Sold Oct 21 2920/2895 put spread + 3035/3060 call spread @ 7.40.
Short put and call deltas are 20 and 21.
Call spread is above the all time high in SPX.
LULU
BTC $LULU 175/185 Oct 18 #BuPS @0.14. Was STO Sept 30 @1.45.
#closing #shortstrangles DD August 9…
August 9 I sold a Sept. 20, 65/77.50 strangle so DD headed south. I rolled the call down into an inversion, rolled the inversion to Oct. 25. I was able to close today with a $104.00 gain, more than I would have taken out of the strangle, but with consternation costs.
#SueCollar Good morning lovlies, TGIF!…
#SueCollar
Good morning lovlies, TGIF! I thought I’d start posting a little again on my collar strategy. Life has been hectic, March 1 I executed on a move to Iowa, regretted the house purchase from the first minute I took possession. Regretted being in Iowa at all. Desperately missed the mountains. Aug 30 executed a move back to Colo, without selling the Iowa house. I’m finally settled back in Colo, though still trying to sell Iowa. I am SO HAPPY to breathe Colorado air again.
So…re trading. I started doing 13-week Tbills over a year ago. The T-bills made me realize that as I’m older, I have less appetite for risk. They also taught me patience. I would make (risk free and state-tax free) as much in 13 weeks as a 1-week Jade Lizard can turn over. But, with a ladder, the risk-free money was rolling in every week. The T-bill rate hit a high last December then started dropping. Once it got close to 2% I realized I needed a new low risk strategy.
So I went back to the #collars . This is a slow, steady, low volatility, limited risk strategy. My goal is to net out about 3-to-6 times the Tbill rate. So 6 to 12% a year. The return-on-risk is much higher, around 50-100% due to risk being so controlled.
I have a very specific process I follow that seems to be working well, that’s why I’ll call it #SueCollars
I use the term “collar” pretty generically. Some would call this “married puts.” I also call it a “rev con” (Reverse Conversion). To me they are all interchangeable. The premise being that there is a stock position, a short call, and a protective put.
My process is 1. Buy stock (I have a tight list of high yielding stocks with good balance sheets—I’m limiting buys right now to PEP, WMT, VZ, CMCSA, CSCO, EBAY, AMD, INTC, BX, MSFT, TGT, UPS, JPM, TGT). I also size every buy for the same amount of stock risk, i.e. all of them around $30K in stock for example. That way capital allocation across tickers is roughly equal.
2. Sell ATM calls around 45 days out. Collect the max you can
3. Buy OTM put 22 days out, targeting 1/3rd of the premium collected on the calls for the buy-price. The thought being that the calls can finance a couple rounds of puts, with enough left over on calls for net profit.
Here is a trade I put on today in CMCSA:
1. Bought 600 shares @ 45.02
2. Sold Nov 22 45 call @1.46 x6
3. Bought Nov 1 43 put @ .46 x 6
Net delta is 145 on 600 shares….so it’s still a bullish trade, but look at all that risk control! Risk is reduced by 75% (obviously any time risk is reduced, profitability is reduced, but remember my benchmark is the 13 week t-bills).
At the outset my max risk on this trade is $612 if there’s a crash. I calculate max risk this way: (600 * 45.02)-(43*600)+(.46*600)-(1.46*600). Basically (stock risk) less (put protection) plus (put cost) less (call premium). Max gain on this trade is $590.88. Roughly with dividends this can yield about 10% a year with pretty good risk control.
There’s a lot of nuance with this trade that I’ll try to capture
–Most people do shorter dated short calls and longer dated puts, I found the opposite works well to finance the puts. On a down swing, the shorter dated puts are a gamma play, they can just explode in value, and longer dated calls very quickly decay, so it’s very nice for collecting realized gains.
–When the protective puts at least double in value (sometimes I can get 7x on them) then I’ll roll everything down. I’ll take profits on the puts and short calls, roll calls to a new 45 DTE ATM and buy new puts. On a big downdraft it’s hard to get new puts at 1/3rd the call value, since these are strong companies I’ll do a very wide put spread to reach the price target. On a bounce it’s easy to buy back the short put and re-establish the full put protection. These rolldowns really do a lot to keep pace with the stock decline.
–A lot of these stocks run up into ex-div and it can be hard to hold the shares. The big thing to always remember with ex div approaching…you CAN be ITM on short calls into ex-div as long as EXTRINSIC IS MORE THAN THE DIV. People tend to freak about ex div and ITM short calls, but it’s an easy rule to remember. I’ve found placing the short calls a couple weeks later than ex div can really help with holding the shares through ex div to collect the dividend. VZ has always been tricky to hold into ex div.
–Once the extrinsic is all gone on short calls I used to self-assign on these to avoid assignment fees….but all that is gone now w/ TDA, no more assignment fees!
–On ITM short calls with no remaining extrinsic, sometimes I’ll roll them up (debit roll) but mostly I take the profits and wait for a down day to re-establish positions.
–I love Fuzzie’s approach of using short puts to re-establish after losing a covered call position but mostly I just re-establish with new stock positions since I’m all about risk control on these.
I’ll keep posting updates on this, and when new positions are established.
Everyone have a safe weekend.
Sue
DRIP
Whiz was predicting an Iran attack but I’ll take this. Serves the same purpose…
https://oilprice.com/Energy/Oil-Prices/Saudi-Revenge-Iran-Reports-Oil-Tanker-Explosion.html
/ES Lottery Ticket
#Futures – Just for fun rolling profits and going inverted for the weekend.
Sold to Close /ES NOV 19 (Wk3) 3100.00 Call @ 4.20 (bought for 2.40)
Then:
Bought to Open /ES NOV 19 (Wk3) 2600.00 Put @ 2.95
SPX out
#SPX1dte Stopped: BTC $SPX Oct 11th 2290/3010 call spreads for 5.20. Condors sold yesterday for 1.35.
Stopped: BTC $SPX Oct 14th 2985/3010 call spreads for 11.00. Condors sold Wednesday for 3.15.
I’m taking a break. I’ve been absolutely slaughtered since the beginning of August. It has been a combination of mistakes, two signals in a row not working, and a completely unpredictable news-driven market. I cannot put on another trade today. I’ll still be here every day, and will resume the low-risk earnings trades next week, and the 1-day spreads once things calm down.
VXX
VXX
STC 3x Jan 20 20.00 Calls $1.55 now have 2x with a credit cost
Gartman goes short
https://www.zerohedge.com/markets/gartman-goes-short
SPX too volatile
#SPX1dte I didn’t get what I wanted today and it’s just too risky to hold in this news-driven market with trade talks continuing into tomorrow. I think the most likely scenario is some partial deal that everyone gets excited about and the algos drive us higher, followed by a dump next week. But it’s just too uncertain (and ridiculous) to have on the risk.
BTC $SPX Oct 14th 2950/2975 call spreads for 9.55. Sold yesterday for 7.00.
/ES Lottery Ticket
#Futures – Just in case we get a trade deal might make a buck or two. Low risk…
Bought to Open /ES NOV 19 (Wk3) 3100.00 Call @2.40
#earnings #closing DAL Bought strangle…
Watching our old friend KOLD
The chart is starting to look intriguing for a fade (i.e., long nat gas) but strikes and expirations not actionable right now. Not much premium above 40 in November. If nat gas continues to be weak for the next couple of weeks, there may be a play in December (options will open up after October expiration next week). For now, Feb highest strike is 46 with the bid/ask really wide (1.00 x 5.70). Holding off but keeping an eye on it.
Putting the “Fix” back in StitchFix
I trade a relatively small account and have never really traded cash-secured Puts before, so I decided to dip my toe into that as well as prepare to be assigned, since I’ve never gone down that road before. Here’s summary of trades since $SFIX earnings went down:
10/1 BTO Oct 11 $23.00 Call $1.40 Debit (Expiring worthless today)
10/2 STO Oct 4 $17.00 Put: $0.26 Credit
10/3 BTC Oct 4 $17.00 Put: $0.10 Debit
10/3 STO Oct 11 $17.50 Put: $0.55 Credit
10/4 BTC Oct 11 $17.50 Put: $0.25 Debit
10/4 STO Oct 11 $20.00 Put: $0.70 Credit
10/7 BTC Oct 11 $20.00 Put: $0.50 Debit
10/8 STO Oct 11 $19.50 Put: $0.42 Credit
10/9 BTC Oct 11 $19.50 Put: $0.15 Debit
10/10 Nov 15 Synthetic Long (ish): STO $20 Put/BTO $21 Call: $0.25 Net Debit (Stock right around $21.00 at time of trade)
Bullish on SFIX, price target for the next week or two will be $23.00. I’ll hold for at least a a week or until that hits and scoop a couple hundred out of it. Volume profile has a gap with some slight resistance at $23.00, but it’s pretty open until about $27.00.
Have a good weekend!
