
Original trade was Mar 15 33/42 short strangle. On 2/6 I rolled the 33 puts up to 39 for 1.00 credit. Today I rolled the 39 puts up to 41.50 puts for .64 credit. Position is now a 41.50/42 strangle. Total premium taken in is 3.56.
Recent Updates Page 266
#ironcondor AMZN #shortputspread NVDA AMZN…
#ironcondor AMZN #shortputspread NVDA
AMZN Following Mike at TastyTrade, sold April 18, 1480/1500/1800/1810 for 4.83
NVDA Trading Fuzzball’s fav-sold March 15, 140/145 for .57 (not selling naked 140 puts until I’m out of assigned positions in AAPL and WYNN).
NUGT Jun calls
Sold $NUGT Jun 21 35 calls @ 1.20. Adding to position at the highest strike.
NTES earnings analysis
#Earnings — $NTES reports tonight. Below are details on earnings one-day moves over the last 12 quarters.
Nov. 14, 2018 AC +5.31%
Aug. 8, 2018 AC -10.96%
May 16, 2018 AC -7.45%
Feb. 7, 2018 AC -6.27%
Nov. 15, 2017 AC +7.85%
Aug. 9, 2017 AC -9.77%
May 10, 2017 AC -0.82%
Feb. 15, 2017 AC +14.08% Biggest UP
Nov. 9, 2016 AC -9.22%
Aug. 17, 2016 AC -2.67%
May 11, 2016 AC +0.43%
Feb. 24, 2016 AC -14.80% Biggest DOWN
Avg (+ or -) 7.47%
Bias -2.86%, negative bias on earnings.
With stock at 234.00 the data suggests these ranges:
Based on current IV (expected move into Friday per TOS): 216.53 to 251.47
Based on AVERAGE move over last 12 quarters: 216.52 to 251.48
Based on MAXIMUM move over last 12 Q’s (14.8%): 199.37 to 268.63
Open to requests for other symbols.
TNA
#LongCalls #LEAPS – Taking advantage of the never ending rise to get out of this at a tiny profit. Went long prior to the implosion but added the full position near the bottom. Ratio’d the call sales on the rise so happy to be out. Will look for a reset if we ever get a pullback.
Bought to Close TNA FEB 22 2019 49.0 Calls
Sold to Close TNA JAN 15 2021 70.0 Calls
#earnings AMZN Jan. 31, sold…
#earnings AMZN
Jan. 31, sold AMZN , March 15, 1490/1500 put spread for earnings for 1.27, closed today for .78.
FOMC minutes today
2pm ET
NVDA
#ShortPuts #IRA – One of my favorite tickers so adding here. Seems to be stabilizing above it’s 50ma but still near the bottom of it’s recent implosion. Based on the April expected move 137 is a possibility so selling near that area. 15.2% annualized if it goes to expiration…
Sold NVDA APR 18 2019 140.0 Put @ 3.30
A TRADE: Seems I’m a…
A TRADE: Seems I’m a 2 trick pony today. HIIQ & SLDB
HIIQ STO 3/15/19 PUT @5.10
HLF dub cal
#Earnings Bought to Open $HLF Feb22/Mar01 57.5 #DoubleCalendar for .45. (Got it for .42 in a TOS account)
SPX 1-dte LONG
#SPX1dte Premium just too low to sell, so I chose long today.
Bought to Open $SPX Feb 20th 2735/2750-2815/2820 condors for .50. (IV 9.56%, SPX 2786)
15-wide on put side and only 5-wide on call side. Not too far OTM so any reasonable move toward these should give me at least a small profit… but not expecting much!
HIIQ Broke a double top…
HIIQ Broke a double top at 42.0 today on the Point & Figure chart, a buy signal.
A TRADE:
HIIQ BTO STOCK @32.95 Adding in small increments. Redundant. ;>)
A TRADE:
SLDB BTO STOCK @8.30 An add. Have some from lower.
WTW keeps going down. Is…
WTW keeps going down. Is it going to recover? 😉
TRADES:
HIIQ STO 3/15/19 41.0 PUTS @3.50
HIIQ STO 3/15/19 42.0 PUTS @4.10
HIIQ BTO STOCK @42.65 Chased a little.
HIIQ BTC 3/15/19 44.0 CALLS @3.70, STO this morning, a mistake, not in my plan. Will be out of HIIQ before expiration next week.
#earnings #assignment #coveredputs GLW January…
#earnings #assignment #coveredputs GLW
January 28, sold a Feb. 15, earnings 25/30/30/35 iron fly that should have worked, (they all should work of course). I was assigned 100 short shares, basis just under 31, stock at 34. Sold a March 15, 32.50 put for .24.
#pietrades LNG 3 DTE 65…
LNG 3 DTE 65 put rolled out to 10 DTE and up to 65.5 for 0.73 credit. Cb 64.21 if assigned.
HLF earnings analysis
#Earnings — $HLF reports tonight. Below are details on earnings one-day moves over the last 12 quarters.
Tue 10/30/2018 AC -2.61%
Wed 08/01/2018 AC +13.03%
Thu 05/03/2018 AC +4.47%
Thu 02/22/2018 AC +3.00%
Thu 11/02/2017 AC -2.92%
Tue 08/01/2017 AC -1.95%
Thu 05/04/2017 AC +11.57%
Thu 02/23/2017 AC -4.51%
Tue 11/01/2016 AC -6.19% Biggest DOWN
Wed 08/03/2016 AC +0.74%
Thu 05/05/2016 AC +9.08%
Thu 02/25/2016 AC +20.52% Biggest UP
Avg (+ or -) 6.72%
Bias 3.69%, strong positive bias on earnings.
With stock at 99.30 the data suggests these ranges:
Based on current IV (expected move into Friday per TOS): 53.81 to 61.19
Based on AVERAGE move over last 12 quarters: 53.64 to 61.36
Based on MAXIMUM move over last 12 Q’s (20.5%): 45.70 to 69.30
Open to requests for other symbols.
TRADES:
CRON STC STOCK @21.75
HIIQ STO 3/15/19 41.0 PUTS @3.50 I will be out of this stock before earnings
HIIQ STO 3/15/19 44.0 CALLS @3.40 ” ” “
#shortcallspreads TSLA Feb. 11, sold…
#shortcallspreads TSLA
Feb. 11, sold a March 15, 365/375 for .93, bought today for .46
NUGT calls
#ContangoETFs $NUGT peeking above its recent highs. Sold June 30 calls for 1.35.
Expirations
#optionsexpiration
Full Profit
$SQ 65/70 BUPS
$AAP 140/150 BUPS
$SPX 2690/2710/2810/2790 1 DTE IC I love using codes.
$T 29 Short Call
$FB 165 call (Covered)
$EXAS 85 put
$HIIQ 31 put Thank you @fuzzballl
$HIIQ 33 put
$HIIQ 38 put Thank you @honkhonk81
$TNDM 43 put
$KEM 17 put
$NVDA 140 put Earnings trade
Full Loss
$CRM 145/140 BECS
NVDA
#Earnings #CoveredCalls #ShortPuts – A few more in this one…
Bought to Close NVDA FEB 15 2019 150.0 Put @ .01 (sold for 4.50)
Sold NVDA MAR 15 2019 145.0 Put @ 2.46
Rolled a covered call out a few weeks…
Rolled NVDA FEB 15 2019 148.0 Call to MAR 08 2019 150.0 Call @ 1.50 credit (picking up 3.50 of upside)
Final Trades and Expirations
#Earnings Sold to close $UAA Feb 15th 21 calls for .16. This was a sad one; bought the #LongStraddle for 2.50… the swings this week afforded opportunities to cut the loss to less than half, but my orders barely missed getting filled again and again. So although I did sell a few for 1.60, the stock ended the week right at my strike… not good for a long straddle!
#CoveredCalls #Assignment $PVTL stock called away via 18 and 19 calls. This was a September earnings trade, was assigned at 22.50 and through multiple rounds of covered calls I’m exiting at about break-even.
#DoubleCalendar Taking assignment of $NTAP stock, cost basis 64.79.
#IronCondor Closed $DECK short 145 calls for 1.30. Was able to exit some at .50 and .20, so overall this trade will be a small winner or a small loser across my accounts. Condor sold for .86 on Jan 31st.
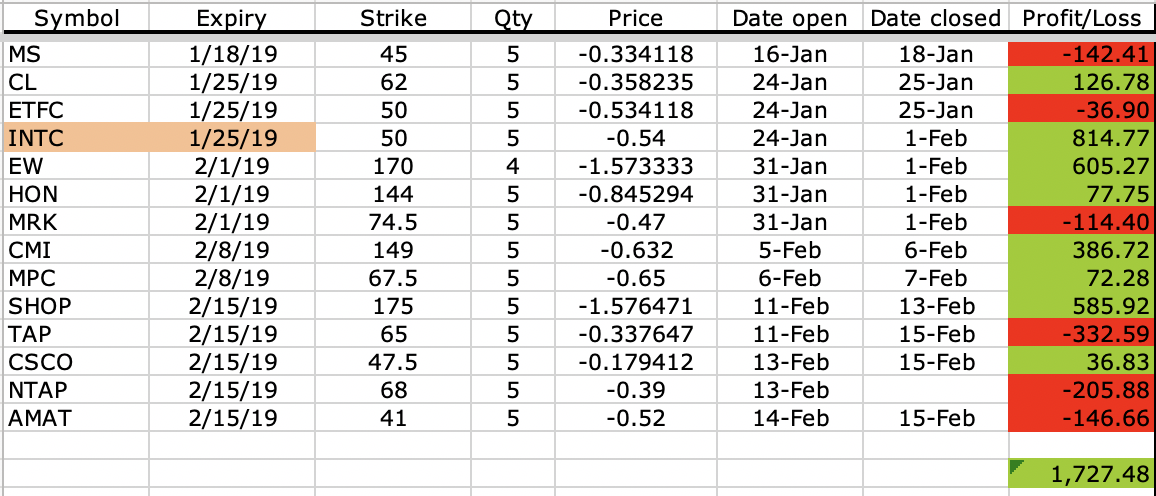
Double Calendar performance
#Earnings #DoubleCalendar Here’s the performance this quarter of double calendars. It is performing better than last quarter, with over $1,700 in profit, using 5-lots.
NOTE: NTAP here is accounted as full loss, even though I will probably hold stock in to next week.
NOTE ALSO: INTC here is accounted as taking stock assignment and then closing all a week later. What I actually did was close only half, and converted the other half of stock into a #PieTrade.
AMAT closed
#Earnings Sold to close $AMAT Feb15/Feb22 #DoubleCalendar for .28. Bought yesterday for .52. Couldn’t get off its ass enough to make it a winner.
DE put spread
A little bit closer to the money than I normally would sell but my thesis is the stock’s post-earnings selloff momentum has slowed. Short strike is around the 50 day moving average, around 3 points lower than the stock price.
Sold $DE Mar 15 155/150 BuPS @ 1.32. Delta of the short strike 37.
SPX 1-dte
#SPX1dte Expiring: $SPX Feb 15th condor, sold yesterday for .85
Sold to Open $SPX Feb 19th 2705/2725-2800/2820 condors for 1.05 (IV: 7.7%, SPX 2768)
SPX ATM put spread closed
#SPX1dte Bought to close $SPX Feb 20th 2725/2700 put spread for 1.30. Sold for 8.40 on Feb 5th. Sold this as Upside Warning was firing, and sat through an uncomfortable dip before it came through. I don’t know how much more steam this rally has, so I’m taking it off to avoid weekend risk.
Taking off AMZN put spread
Closing position to guard against an afternoon pullback. Bought to close $AMZN Feb 15 1590/1580 BuPS @ .19. Sold for 2.05 on 2/4.
Econ Calendar for week of 2/18/19
FOMC minutes at 2pm ET on Wednesday
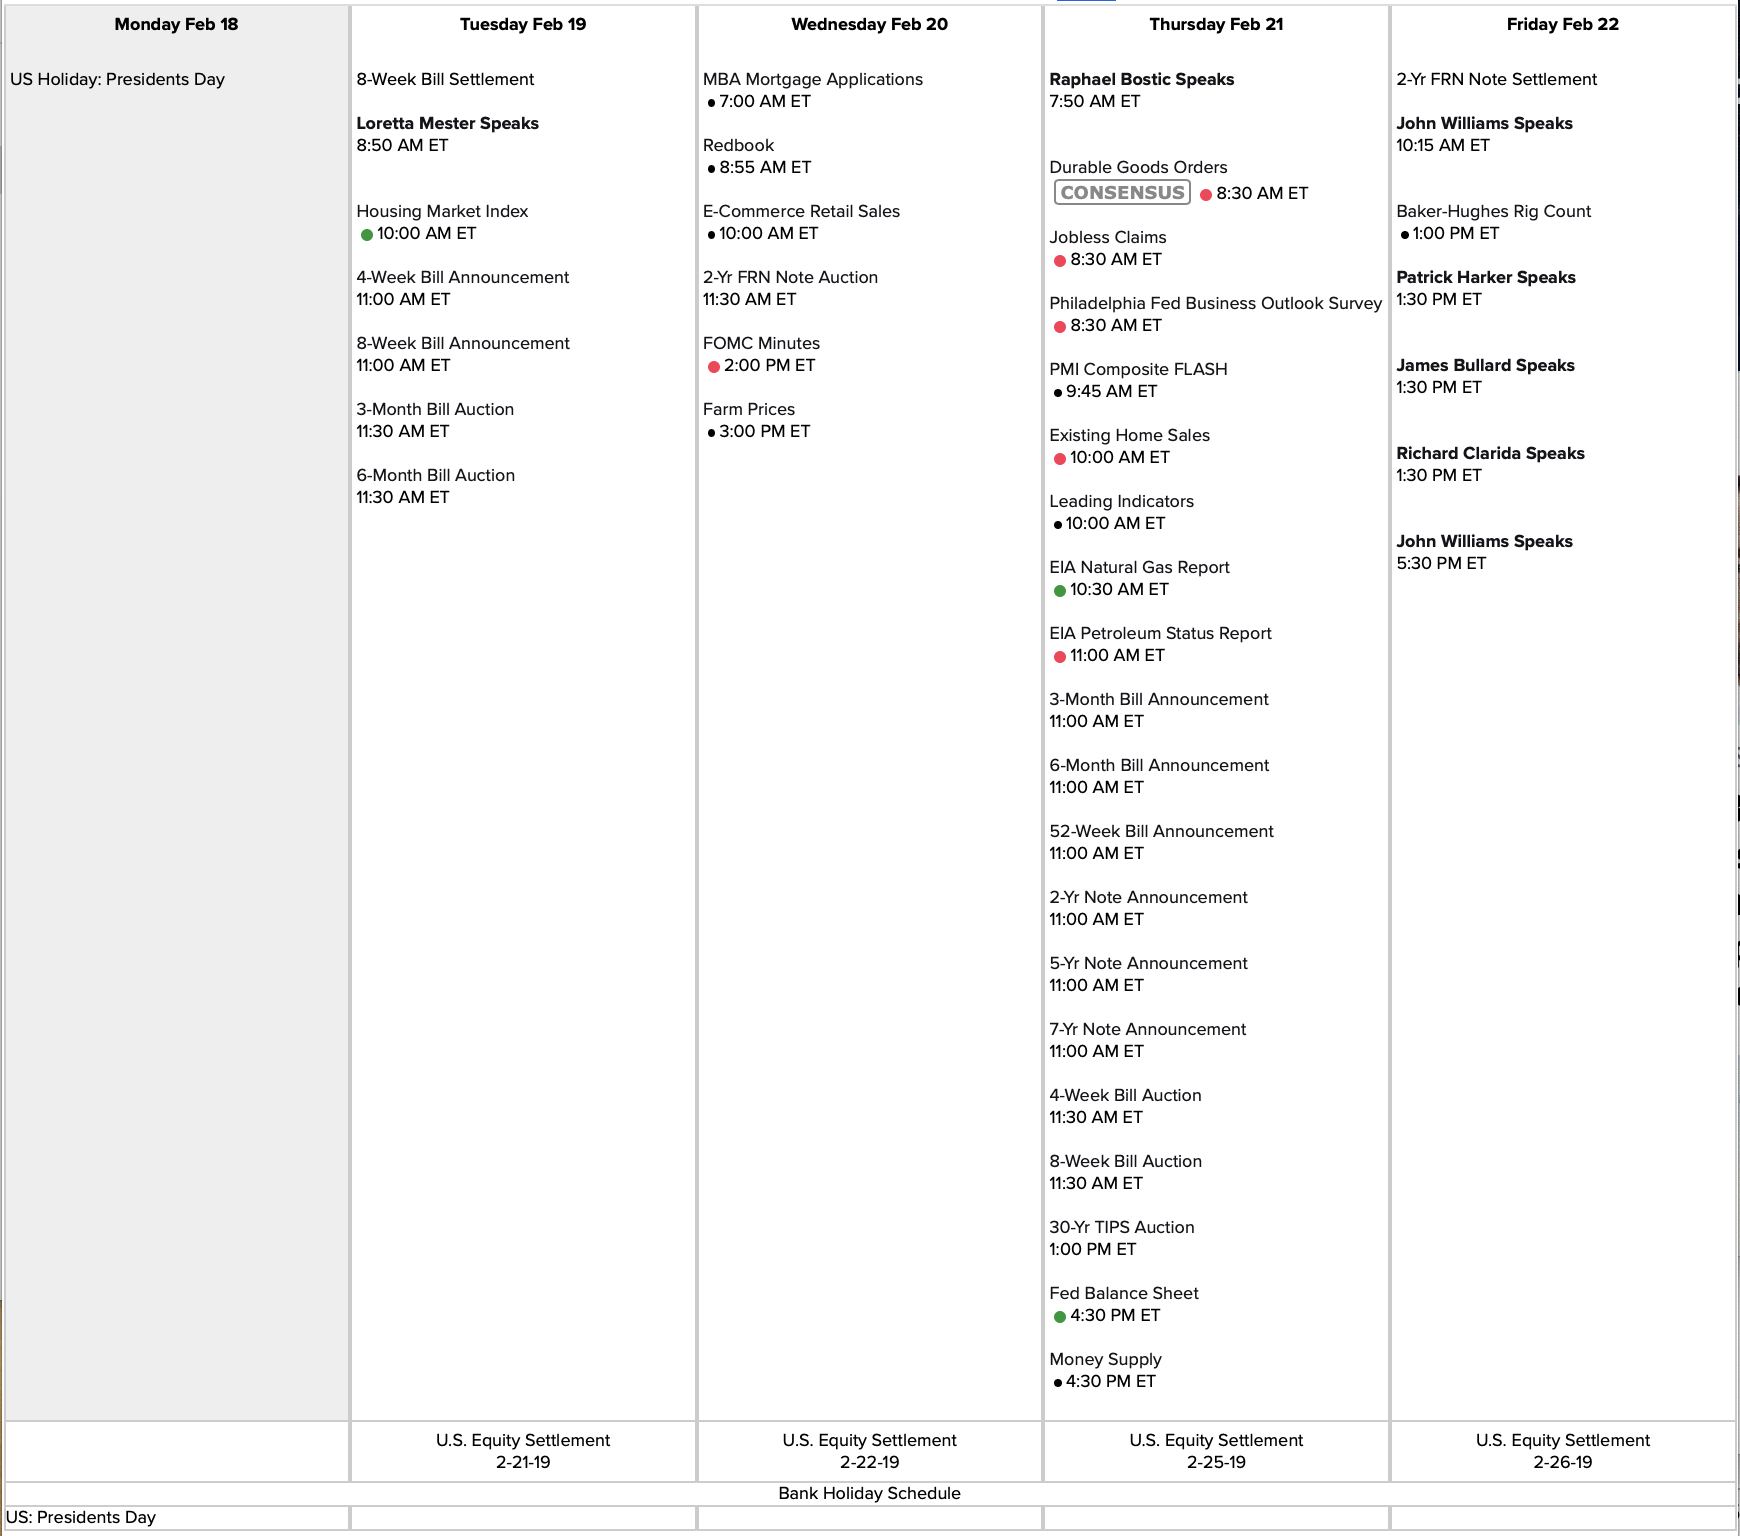

Link to calendar: https://us.econoday.com/byweek.asp?day=18&month=2&year=2019&cust=us&lid=0
A TRADE: A recent falling knife.
SLDB BTO STOCK @8.15
TAPped out
$Earnings Closed $TAP Feb15/Feb22 65 #DoubleCalendar. I needed to close the puts, tried to play the swings but then stock started rallying so took an additional .30 loss on the exit. Calendar bought for .34 on Monday.
WMT earnings analysis
#Earnings — $WMT reports Tuesday morning (after Monday holiday). Below are details on earnings one-day moves over the last 12 quarters.
Nov. 15, 2018 BO -1.96%
Aug. 16, 2018 BO +9.33%
May 17, 2018 BO -1.90%
Feb. 20, 2018 BO -10.17% Biggest DOWN
Nov. 16, 2017 BO +10.89% Biggest UP
Aug. 17, 2017 BO -1.58%
May 18, 2017 BO +3.22%
Feb. 21, 2017 BO +2.99%
Nov. 17, 2016 BO -3.08%
Aug. 18, 2016 BO +1.87%
May 19, 2016 BO +9.58%
Feb. 18, 2016 BO -3.01%
Avg (+ or -) 4.97%
Bias 1.35%, positive bias on earnings.
With stock at 99.30 the data suggests these ranges:
Based on current IV (expected move into Friday per TOS): 95.03 to 103.57
Based on AVERAGE move over last 12 quarters: 94.37 to 104.23
Based on MAXIMUM move over last 12 Q’s (10.9%): 88.49 to 110.11
Open to requests for other symbols.
Rolling LABU Covered Calls
#rolling
$LABU BTC 2/15 51.5 call and STO 2/22 54 call at .16 credit
CSCO closed
#Earnings Sold to Close $CSCO Feb15/Feb22 47.5 #DoubleCalendar for .30. Bought for .18 on Wednesday. Stock came down enough for a small profit, but was too far from strike to make it a good one.
SVXY
Rolled the 41 calls that expire today out to the June 42 calls for a credit of .15 cents. It is very hard to get any premium on the rolls.
Just a thought for anyone…
Just a thought for anyone thinking about shorting the market now, I heard somewhere yesterday that there is a record amount of cash on the sidelines. As they pile on market highs that will squeeze out any shorts lefts.
Just an FYI.
#earnings NVDA Bought March 15,…
#earnings NVDA
Bought March 15, 120/185 strangle for 1.10, sold yesterday for 1.61
SPY
NTAP dub cal
#Earnings #DoubleCalendar Was assigned stock on over half of my position in $NTAP; Feb 15th 68 short puts. I just sold the Feb 22nd LONG puts for 3.60. I will now watch for some intraday strength in the stock to sell the stock, as well as cover the remaining short puts that were not assigned. If I can net a .39 difference (the price of the original double calendar), the trade will be breakeven. Higher and it will turn a profit.
NTAP dub cal Possible danger…
NTAP dub cal
Possible danger of the dub cal’s! Last night I was assigned the 68 Puts.
Jeff, how do you change the font size?
NVDA
In spite of a 7:50 am tee time I did get one fill right at the open.
Sold NVDA FEB 15 2019 150.0 Put @ 4.50
Hall of Presidents
Back by popular demand, in observance of Presidents’ Day, it’s the Hall of Revolving Presidents. Click “Home/Refresh” or refresh your browser to change the featured President.
HIIQ NVTA Short Puts / NVDA Earnings Straddle / NFLX BUPS / Rolling TQQQ
#shortputs
$HIIQ STO 3/15 31 puts at 1.19 Thank you @honkhonk81.
$NVTA STO 3/15 15 puts at 1.00
#earnings
$NVDA STO 3/15 120/189 straddle at 1.70. Thank you @thomberg1201
#bups
$NFLX STO 3/15 325/335 BUPS at 2.50 Thank you @ramie77
#perpetualrollingstrangles
$TQQQ BTC 2/15 50 calls and STO 3/15 53 calls for additional .80 credit.
Happy Valentines Day to all. Not much left of it but enjoy.
EWZ Call Spread
Looking for a drift back down after its big day today. Short call is above the recent highs from late Jan/early Feb.
Sold $EWZ Mar 15 46/51 BeCS for .71.
AMAT dub cal
#Earnings #DoubleCalendar Bought to open $AMAT Feb15/Feb22 41 dbl cals for .52
SPX 1-dte
#SPX1dte Closed $SPX monthly condor for .35. Sold yesterday for 1.00
Sold $SPX Feb 15th 2685/2705-2785/2805 condors for .85. (IV 13.2%, SPX 2751)
Also, bought to close $SPX Feb 22nd 2670/2650 put spreads for 1.00. Sold for 3.45 on Feb 4th. Still holding the Feb 20th 2725/2700 put spreads, sold ATM for 8.40.
SPY
1 DTE #fuzzy
274/274/273.5 $.90
NVDA EArnings
#earnings
$NVDA STO 2/15 140 @ .90
#optionsexpiration a day early. Some…
#optionsexpiration a day early.
Some of these trades are from yesterday, have been to0 busy at work to post.
#pietrades #lizardpies
ALXN 120/129/130 for 2/22 for 1.25 credit yesterday off an 0.85 roll the previous week.
EOG 98.5 put for 96.75 cost basis off a roll
LNG 65 puts for 2/22 STO yesterday for 0.56 credit
TRIP 57 puts for 2/22 for 0.66
XBI 84/85/86 total credit now 4.19. Have been rolling 3 weeks.
TQQQ 51 CC rolled out 43 DTE to 54 CC for 0.25. Cb now 56.79
TQQQ 51 cc rolled out 43 DTE to 52 for 0.10 for cost basis of 57.00
FAS 1 DTE 56.5 cc rolled out 8 DTE for 0.47 credit. Cost basis 54.17
EOG batch 2 98.5 8 DTE cost basis 97.1
#fuzzy
GILD 70/70 cost to 7.72
XBI 80/80 rolled for 0.56 credit. Cb 12.56
LNG 50/60 rolled for 0.33. CB 12.93
GILD 67.5/69 rolled for 0.26 cb 6.93.
Finally some consistent results last 4 weeks. Of course the market screaming higher does not hurt. But mostly I was able to unwind a bunch of accumulated rolls and finally pull some cash out of the market again.
Since Jan 1 have been officially working with the advisory service. Obviously I cannot post those trades but will keep posting other trades I find and really like how many of us here are willing to experiment with different tactics to see what really works the best with real money in real time! This is a great trading group and I will stay involved, thanks to many of you I survived the 20% correction which now seems to be over and even came out ahead. This down turn was WAY better than the SVXY debacle last Feb. 6 2018, not that anyone here needed reminding 🙂
One thing is certain, I will be keeping a general market hedge on now all the time. May only need it once or twice a year but then it is a lottery ticket. To keep it from costing too much will probably use a back ratio or risk twist trade. Will set it up to cover a 10% correction. Anything beyond that it becomes a mega lottery ticket.
Cheers, Chris
UVXY calls
#VXXGame Bought to open $UVXY April 100 calls for .60. I have these for Feb and Mar. Since Feb expire tomorrow adding the April batch. Will be used to sell lower strikes against if we get a re-test.
#earnings NVDA Sold March 15,…
#earnings NVDA
Sold March 15, 120/185 strangle for 1.60, strikes are well outside the average moves, not the max though. Thanks Jeff.
TQQQ
STO March 29, 50 puts @3.50, the QQQ is breaking above the 150 and 200 day MA.
LABU
STO March 22, 65 calls at .61, long 2021 leaps.
SPX 1-dte
2780/2785 at $0.20-0.25 BeCS. Chose weekly not monthly
#assignment JBL Double assignment. September…
#assignment JBL
Double assignment. September 26, back when selling puts seemed to always work, sold a Jan. 18, 27 put for 1.05, Jaunary 4, assigned, January 8 sold a Feb. 15, 25 call for .35. JBL then started going up. I was called away (for an .08 dividend) last night. All in all, a loss of $75.
AMAT earnings analysis
#Earnings — $AMAT reports tonight. Below are details on earnings one-day moves over the last 12 quarters.
Nov. 15, 2018 AC +1.08%
Aug. 16, 2018 AC -7.71%
May 17, 2018 AC -8.24% Biggest DOWN
Feb. 14, 2018 AC +3.89%
Nov. 16, 2017 AC -2.33%
Aug. 17, 2017 AC +2.73%
May 18, 2017 AC +0.38%
Feb. 15, 2017 AC -0.87%
Nov. 17, 2016 AC +0.03%
Aug. 18, 2016 AC +7.08%
May 19, 2016 AC +13.81% Biggest UP
Feb. 18, 2016 AC +7.04%
Avg (+ or -) 4.60%
Bias 1.41%, positive bias on earnings.
With stock at 40.75 the data suggests these ranges:
Based on current IV (expected move into Friday per TOS): 38.47 to 43.03
Based on AVERAGE move over last 12 quarters: 38.88 to 42.62
Based on MAXIMUM move over last 12 Q’s (13.8%): 35.12 to 46.38
NVDA earnings analysis
#Earnings — $NVDA reports tonight. Below are details on earnings one-day moves over the last 12 quarters.
Nov. 15, 2018 AC -18.75% Biggest DOWN
Aug. 16, 2018 AC -4.90%
May 10, 2018 AC -2.15%
Feb. 8, 2018 AC +6.69%
Nov. 9, 2017 AC +5.26%
Aug. 10, 2017 AC -5.32%
May 9, 2017 AC +17.82%
Feb. 9, 2017 AC -2.37%
Nov. 10, 2016 AC +29.80% Biggest UP
Aug. 11, 2016 AC +5.59%
May 12, 2016 AC +15.20%
Feb. 17, 2016 AC +8.60%
Avg (+ or -) 10.20%
Bias 4.62%, positive bias on earnings.
With stock at 153.00 the data suggests these ranges:
Based on current IV (expected move into Friday per TOS): 142.59 to 163.41
Based on AVERAGE move over last 12 quarters: 137.39 to 168.61
Based on MAXIMUM move over last 12 Q’s (29.8%): 107.41 to 198.59
SPX 1-dte
Sold Feb15 2690/2685 BuPS @ .30 x2. Based on 2730 support and Theo gravity level.
Sold Feb15 2700/2695 BuPS @ .35 x4, .30×2. Based on Tide and MACD.
Sold Feb15 2775/2780 BeCS @ .25 x2, .35 x2, .45 x2. Call shorts are tight but market showing some weakness
Sold Feb15 2785/2790 BeCS @ .25 x2
Done for today. Total credit $510.
Closing trades: Closed BuPS .05 x8. Closed 2785/2890 BeCS @ .05. Closed 2775/2780 ccs @.90×2 and .60×4.
Profit $290 before commissions. Twas a serious nail biter.
#spx1-dte
Futures drop
Futures have given up all of their earlier gains after a slew of weaker than expected economic data.https://t.co/Cq39KWZ7Rg pic.twitter.com/oceTxPSkTB
— Bespoke (@bespokeinvest) February 14, 2019
Expiration $SPX 1 DTE / Closed Early COST UA
#optionsexpiration
$SPX 2690/2710/2795/2775 STO at .80
#closing
$COST 2/15 207.5/212.50 BUPS at 1.00 STO at 2.20 54% of max. I am treading lightly. Erring on the side of keeping my money.
$UAL BTC 2/15 90 call at .20 STO on 1/15 as part of earnings strangle at .61. The put side which brought in .49 will, I expect, expire Friday. STO at .49. Thank you @thomberg1201 for the trade and @jeffcp66 for supporting data.
NFLX put spread
Sold $NFLX Mar 15 335/325 BuPS for 2.55.
SHOP fully closed
#Earnings Sold the last batch of $SHOP Feb15/Feb22 #DoubleCalendar for 3.10. Bought for 1.60 on Monday.
SPX 1-dte
Sold Feb14 IC (monthly) 2790/2795/2720/2715 @.50 x2
2/14 update: Closed call spreads for .05 and put spreads for .10. Total profit $70.
#spx1-dte
SPX 1-dte
#SPX1dte Sold to Open $SPX Feb 14th (monthlys) 2690/2710-2790/2810 condors for 1.00. These are monthlys, so they stop trading at Thursday’s close but settle Friday morning. I will close the trade before tomorrow’s close to avoid gap risk.
Expiring: Feb 13th condor, sold yesterday for 1.00.
NTAP dub cal
#Earnings Bought to Open $NTAP Feb15/Feb22 68 #DoubleCalendar for .39.
CSCO dub cal
#Earnings Bought to Open $CSCO Feb15/Feb22 47.5 #DoubleCalendar for .18.
Price has gone up on NTAP so looking to buy now.
NTAP and CSCO for earnings
#Earnings #DoubleCalendar Both $NTAP and $CSCO make very cheap double calendars. Especially NTAP, which can probably be bought for around .20 and may offer profits as high as 2.00, if there is not a super large move. Even with a modest move, this should still turn a profit, but if not, it’s only .20. CSCO will go for a similar price but will offer a lower return.
sto (2 dte) sdiv 20…
sto (2 dte) sdiv 20 put strike @1.05
to collect premium and divi next month/long term hold for 8.58% return.
current price 18.91.
possible 13.3% annual return first year then 8% plus after that.
Sto spx march 15(29 dte)…
Sto spx march 15 put (29 dte) 2570/2565/ .30
FOSL earnings analysis
#Earnings — $FOSL reports tonight. Below are details on earnings one-day moves over the last 12 quarters.
Nov. 7, 2018 AC +5.75%
Aug. 7, 2018 AC -11.63%
May 8, 2018 AC +9.06%
Feb. 13, 2018 AC +87.72% Biggest UP
Nov. 7, 2017 AC -17.22%
Aug. 8, 2017 AC -25.08%
May 9, 2017 AC -20.44%
Feb. 14, 2017 AC -14.82%
Nov. 3, 2016 AC +3.52%
Aug. 9, 2016 AC +0.69%
May 10, 2016 AC -29.07% Biggest DOWN
Feb. 16, 2016 AC +28.55%
Avg (+ or -) 21.13%
Bias 1.42%, slight positive bias on earnings.
With stock at 16.20 the data suggests these ranges:
Based on current IV (expected move into Friday per TOS): 13.28 to 19.12
Based on AVERAGE move over last 12 quarters: 12.78 to 19.62
Based on MAXIMUM move over last 12 Q’s (87.7%): 1.99 to 30.41
YELP earnings analysis
#Earnings — $YELP reports tonight. Below are details on earnings one-day moves over the last 12 quarters.
Nov. 8, 2018 AC -26.59% Biggest DOWN
Aug. 8, 2018 AC +26.65%
May 10, 2018 AC -7.81%
Feb. 7, 2018 AC -14.04%
Nov. 1, 2017 AC -0.10%
Aug. 3, 2017 AC +27.66% Biggest UP
May 9, 2017 AC -18.35%
Feb. 9, 2017 AC -13.64%
Nov. 2, 2016 BO +9.94%
Aug. 9, 2016 AC +12.83%
May 5, 2016 AC +23.71%
Feb. 8, 2016 AC -2.30%
Avg (+ or -) 15.30%
Bias 1.50%, slight positive bias on earnings.
With stock at 38.75 the data suggests these ranges:
Based on current IV (expected move into Friday per TOS): 33.76 to 43.74
Based on AVERAGE move over last 12 quarters: 32.82 to 44.68
Based on MAXIMUM move over last 12 Q’s (27.7%): 28.03 to 49.47
SQ calls
#LongLEAPs #SyntheticCoveredCalls
Sold $SQ Feb 22nd 77 calls for 2.05. Earnings are the following week.
