
#Earnings Bought to Open $FEYE Feb 8th 18.5 #LongStraddle for 1.81. Need a 9.7% move, which is the 12-quarter average.
Bought to Open $MPC Feb08/Feb15 67.5 #DoubleCalendar for .65.
Recent Updates Page 268
#fuzzy MU STC the 35/35…
#fuzzy
MU STC the 35/35 for 7.38 credit. Total loss of 6.92 but I am now out of my biggest losers. It could have been much worse, it was down 25+ points at one point.
Everything left is solidly in the green EXPE, GILD, XBI.
Also today is the anniversary of the SVXY implosion and my biggest trading losses ever. While I still have a long way to go to break even on cost basis and even further to hit all time highs, the tactics we have been developing since then have been account savers for fixing bad trades. Thanks everyone for the input and by all of us trying new techniques I think we are all able to handle volatility better and even profit more from it. Keep up the good work!
At least 2 accounts are about to hit all time highs, 4 to go.
I have a bunch of cash now and will be adding some trades tomorrow.
EA puts
The selling momentum seems to have subsided and the stock is off its lows of the day. IV still elevated but falling fast so I want to capture some of that. Sold $EA Mar 15 75 puts @ 1.41. Delta 24.
FEYE earnings analysis
#Earnings $FEYE reports tonight. Below are details on earnings one-day moves over its entire history.
Oct. 30, 2018 AC +9.73%
Aug. 1, 2018 AC -1.91%
May 2, 2018 AC -9.70%
Feb. 8, 2018 AC +9.34%
Nov. 1, 2017 AC -10.32%
Aug. 1, 2017 AC +0.74%
May 2, 2017 AC +12.85% Biggest UP
Feb. 2, 2017 AC -15.72%
Nov. 3, 2016 AC +12.07%
Aug. 4, 2016 AC -12.05%
May 5, 2016 AC -19.02% Biggest DOWN
Feb. 11, 2016 AC -3.30%
Avg (+ or -) 9.73%
Bias -2.27%, negative bias on earnings.
With stock at 18.25 the data suggests these ranges:
Based on current IV (expected move into Friday per TOS): 16.45 to 20.05
Based on AVERAGE move over last 12 quarters: 16.47 to 20.03
Based on MAXIMUM move over last 12 Q’s (19.0%): 14.78 to 21.72
Open for requests on other symbols.
CMG earnings analysis
#Earnings $CMG reports tonight. Below are details on earnings one-day moves over its entire history.
Oct. 25, 2018 AC +3.42%
July 26, 2018 AC +5.71%
April 25, 2018 AC +24.44% Biggest UP
Feb. 6, 2018 AC -10.55%
Oct. 24, 2017 AC -14.58% Biggest DOWN
July 25, 2017 AC -2.30%
April 25, 2017 AC +2.38%
Feb. 2, 2017 AC -4.54%
Oct. 25, 2016 AC -9.28%
July 21, 2016 AC +5.83%
April 26, 2016 AC -6.43%
Feb. 2, 2016 AC -2.92%
Avg (+ or -) 7.70%
Bias -0.74%, slight negative bias on earnings.
With stock at 521.00 the data suggests these ranges:
Based on current IV (expected move into Friday per TOS): 484.07 to 557.93
Based on AVERAGE move over last 12 quarters: 480.89 to 561.11
Based on MAXIMUM move over last 12 Q’s (24.4%): 393.67 to 648.33
Open for requests on other symbols.
Volatility bet
Bot VXXB Mar8 34/30/38 broken fly @ 1 x3. Betting on volatility to continue falling for a bit.
#volatility
Upside Warning performance metrics
#VIXIndicator Because I’m becoming an Excel geek, I made a new chart measuring a performance metric for the Upside Warning. This shows the rise we have gotten from past Upside Warnings in relation to how much the SPX had already recovered before the Warning hit. For instance, the upper-left-most dot represents a 32.2% rise in SPX AFTER the UpW; the UpW hit after SPX had recovered only 26% of its drop (horizontal axis).
I drew the sloppy red line showing the general trend: the less we have recovered from the correction when the UpW hit, the higher we can expect the rise to be after the UpW. Although the red line shows a trend, you can see that most are clustered in the same general area.
And for comparison today, we had recovered 65.5% at the close yesterday, when the UpW hit. (high 2940, low 2351, 20% drop. Close yesterday was 2737, which means we regained 65.5% of the drop).

MU rolling
From Mar 15 33/42 short strangle, rolled the 33 puts up to 39 (delta 30) for 1.00 credit. Position is now a 39/42 strangle. Total premium taken in now 2.92.
#shortcallspreads TSLA Channeling my inner-Iceman,…
#shortcallspreads TSLA
Channeling my inner-Iceman, sold February 22, 350/360 for 1.02
#shortputs VXXB TastyTrade idea-sold March…
#shortputs VXXB
TastyTrade idea-sold March 15, 24/31 put spread for 1.15
Earnings trades, CMI, SNAP, DECK partially closed
#Earnings #DoubleCalendar Sold to close partial $CMI Feb08/Feb15 149 dbl cal for 1.20. Waiting for price to move closer to my strike to close more. Bought yesterday for .65
#LongStraddle Sold to close partial $SNAP Feb 8th 7 calls for 1.75. Watching for a move higher. Straddles bought yesterday for 1.03.
#IronCondor Bought to close partial $DECK Feb 15th 105/110/145/150 condors for .50. Sold Thursday for .86.
NVDA
STC Feb 8 142/144 Calls 1.90 #supercharger
BTO 1-31 $1.03
STC Feb 8 145/147 1.75
BTO 2-1 $1.03
Still open BUPS Feb 8 145/143 sold $.40 2-4-2019
VIX upside trades
Bot QQQ Mar 8 175c, SPY 277.5c, IWM 154c. First small layer.
Trading very carefully in case the rally doesn’t materialize.
Added another layer of SPY, QQQ, and IWM calls. Same strikes. Better price. Will hedge with VIX calls near the close if the downside wins today.
#vixindicator
#fuzzy GILD 70/70 expires this…
GILD 70/70 expires this week rolled out 2 weeks for 0.48 credit. Cb now 8.95.
SPX 1-dte
#SPX1dte Sold to Open $SPX Feb 6th 2710/2690 put spreads for 1.10. Selling only a .12 delta put spread. no call spread for tomorrow. This is based on upside warning going into effect. It still carries higher risk, because while an Upside Warning is a pretty sure shot for a move higher, we could always take a dip or a drop first. But I think this is sufficiently OTM to withstand a pullback, if one comes tomorrow.
TQQQ
STO March 15, 59/64 calls spread at .27 cents against my 2021 leaps.
SNAP straddle
#Earnings Bought to Open $SNAP Feb 8th 7 #LongStraddle for 1.03 (partial fill so far, may need to go to 1.04).
Upside Warning coming
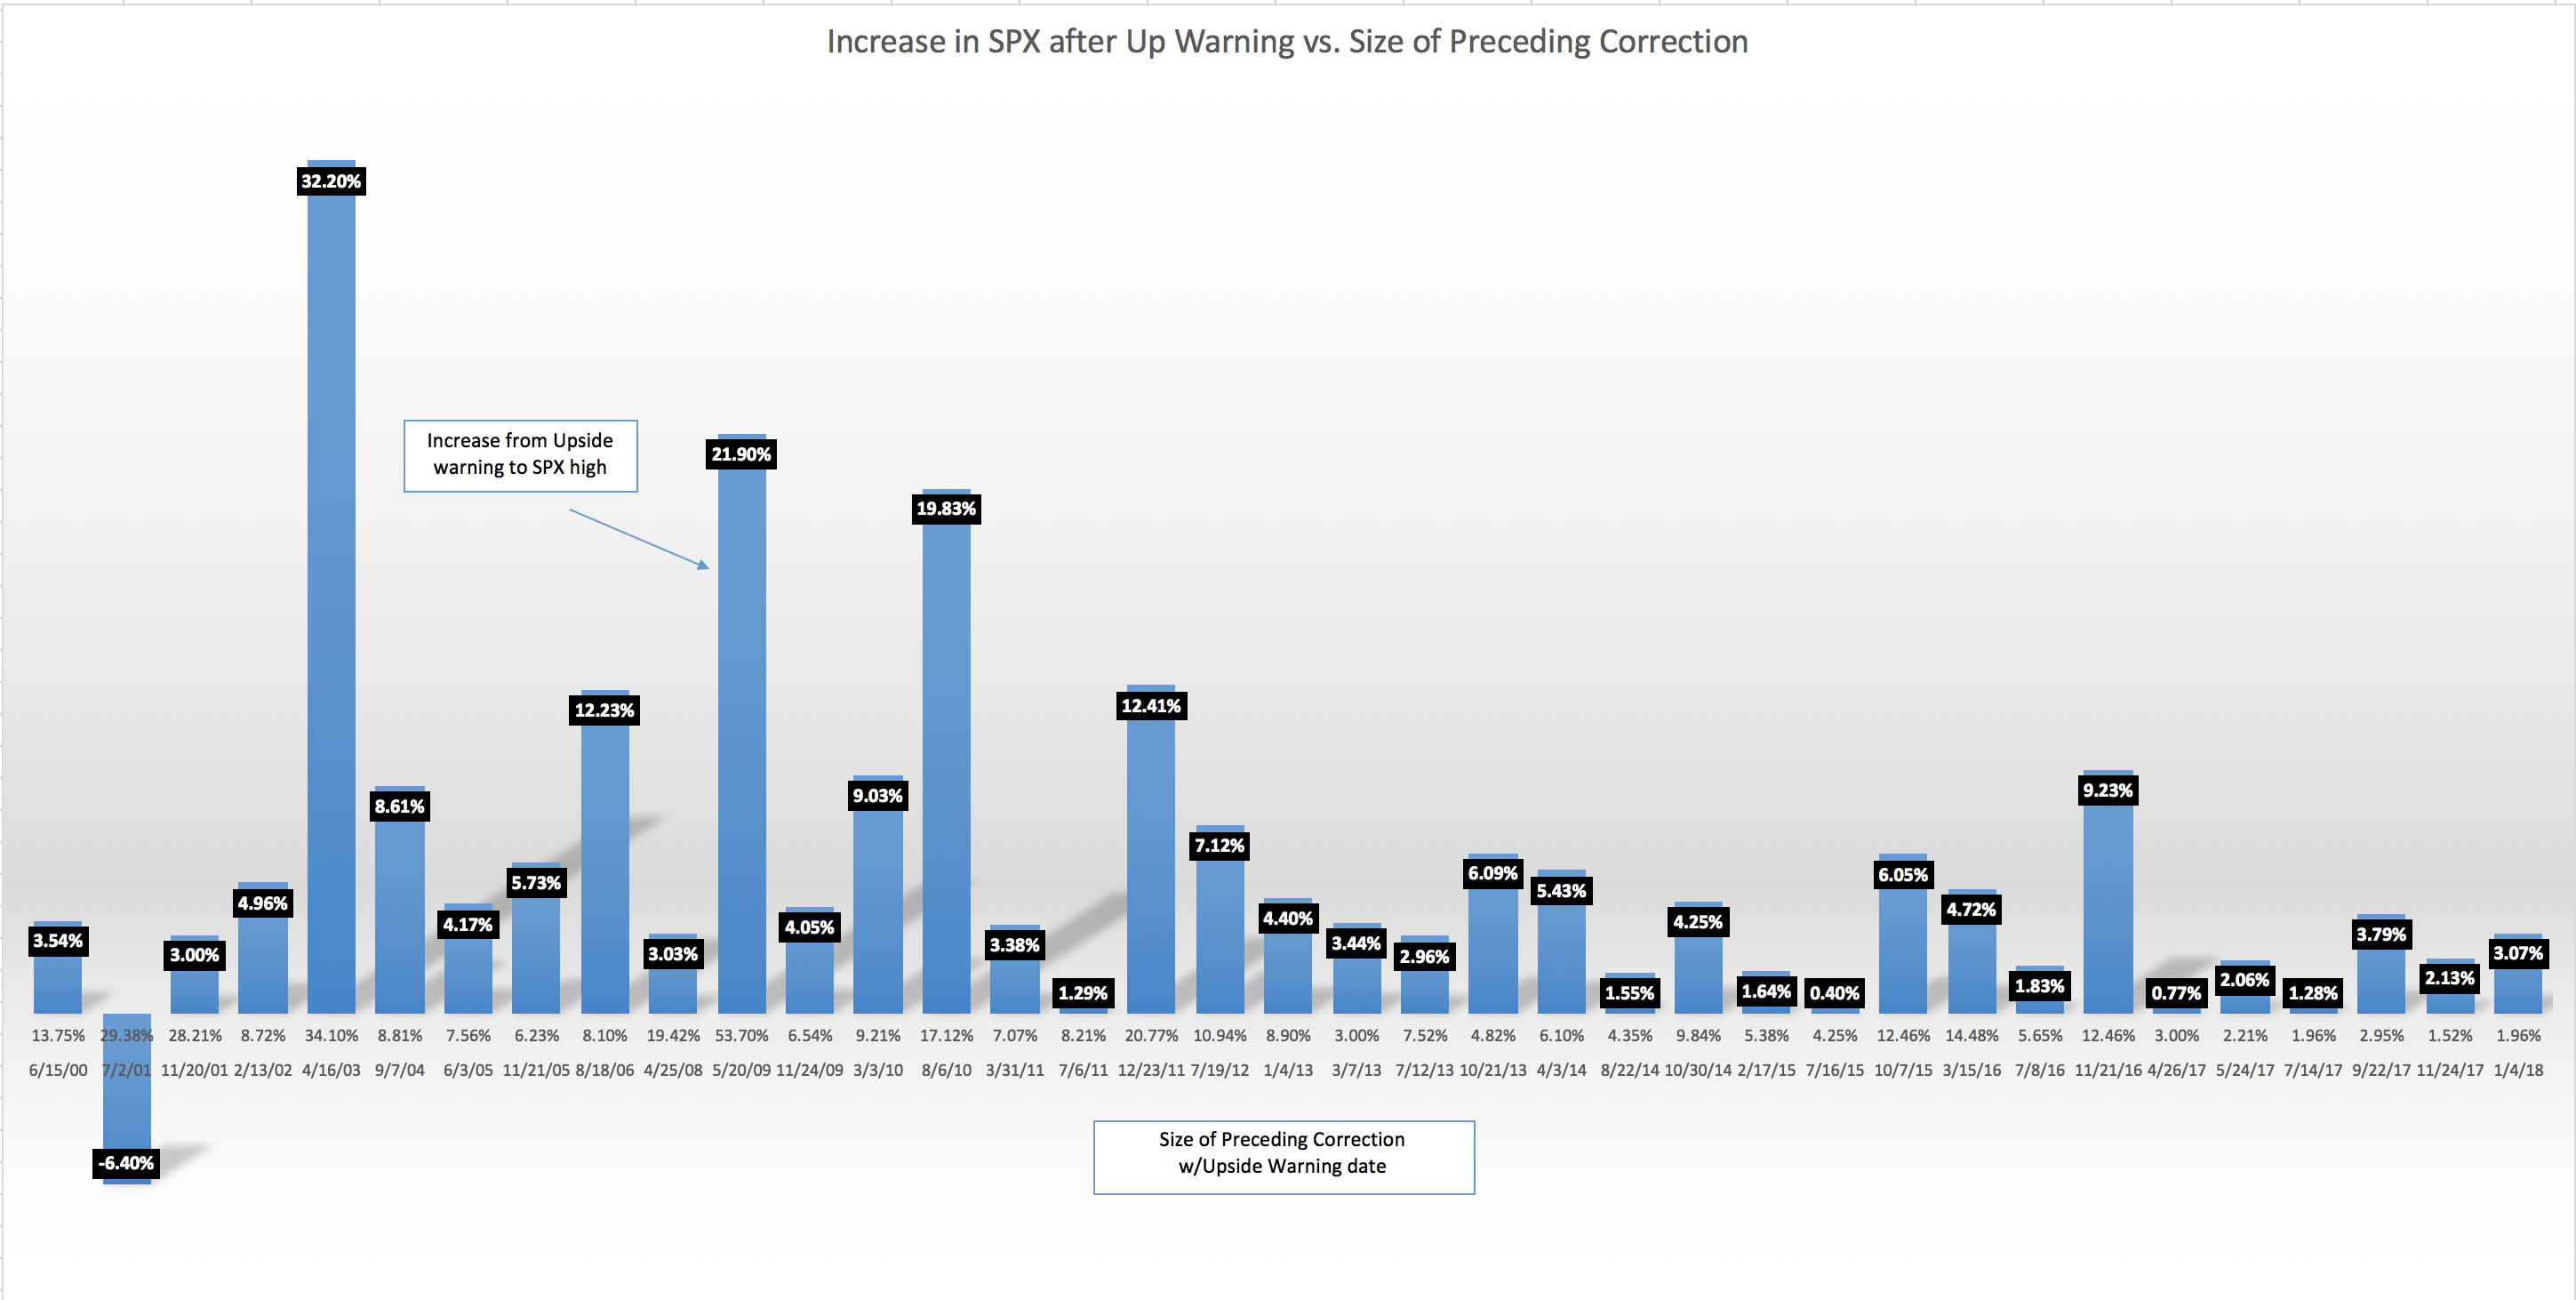
#VIXIndicator Here’s the version of the past results I posted back in May. The blue bars with numbers on top represent the percentage move UP from the close of an Upside Warning day to the eventual SPX high before another pullback. The numbers at the bottom of each bar are the percentage move DOWN of the preceding correction, and the date of the Upside Warning. Please ask any questions you have! (you can click on the chart to see it full screen).
As you can see, the Upside Warning is pretty reliable for at least a couple percentage points higher.
CMI dbl cal
#Earnings Bought to Open $CMI Feb08/Feb15 149 #DoubleCalendar for .65. (filled at .63 on TOS)
CMI earnings analysis – dbl calendar candidate
#Earnings — This one is a good double calendar candidate because it is cheap to buy. Premium for this Friday is not much lower than premium for next Friday. That gives us a pretty good range of profit; a range almost as wide as the max moves.
$CMI reports tomorrow morning. Below are details on earnings one-day moves over the last 12 quarters.
Oct. 30, 2018 BO +2.29%
July 31, 2018 BO +4.08%
May 1, 2018 BO -4.11%
Feb. 6, 2018 BO -2.33%
Oct. 31, 2017 BO -1.92%
Aug. 1, 2017 BO -5.64% Biggest DOWN
May 2, 2017 BO +6.09%
Feb. 9, 2017 BO +3.06%
Nov. 1, 2016 BO -4.32%
Aug. 2, 2016 BO -0.62%
May 3, 2016 BO +1.77%
Feb. 4, 2016 BO +7.62% Biggest UP
Avg (+ or -) 3.65%
Bias 0.50%, slight positive bias on earnings.
With stock at 148.80 the data suggests these ranges:
Based on current IV (expected move into Friday per TOS): 142.54 to 155.06
Based on AVERAGE move over last 12 quarters: 143.36 to 154.24
Based on MAXIMUM move over last 12 Q’s (7.6%): 137.46 to 160.14
#shortputs MGM On June 18,…
#shortputs MGM
On June 18, sold a July 20, 30 put for .43, rolled it 7 times, closed today and made .95.
TQQQ covered calls
Sold calls against stock that I was put from a short 55 put assignment in December.
Mar 15 54 calls @ 1.35.
UVXY
#DiagonalBearCallSpreads – Going Iceman style figuring no huge volatility spikes this week…then have a month to sell against the free short calls.
Sold UVXY FEB 8 2019 54.0 Calls / Bought UVXY MAR 15 2019 90.0 Calls @ .02 credit
SPX put spread
#SPXcampaign This is based solely on the Upside Warning we will get at today’s close, barring a disaster.
Sold $SPX Feb 20th 2725/2700 put spreads for 8.40.
I’m not selling any call spreads, and I’ll probably buy one. I’m not yet sure about tomorrow’s #SPX1dte. Not seeing much premium.
SNAP earnings analysis – straddle candidate
#Earnings $SNAP reports tonight. Below are details on earnings one-day moves over its entire history.
Oct. 25, 2018 AC -10.15%
Aug. 7, 2018 AC -6.78%
May 1, 2018 AC -21.93%
Feb. 6, 2018 AC +47.58% Biggest UP (the only UP)
Nov. 7, 2017 AC -14.61%
Aug. 10, 2017 AC -14.08%
May 10, 2017 AC -21.45% Biggest DOWN
Avg (+ or -) 19.51%
Bias -5.92%, negative bias on earnings.
With stock at 6.82 the data suggests these ranges:
Based on current IV (expected move into Friday per TOS): 5.75 to 7.89
Based on AVERAGE move over last 12 quarters: 5.49 to 8.15
Based on MAXIMUM move over last 12 Q’s (47.6%): 3.58 to 10.06
Cost of a straddle is about 1.10. The AVG move has been 1.38. Nice low risk straddle candidate.
Open for requests on other symbols.
SPX 1dte
sold 2690/2695 BuPS expiring 2/6/2019 for $20.00
#earnings EA Sold March 15,…
#earnings EA
Sold March 15, 80/100 strangle for 2.89.
SPY 21dte IC update
Quick update on SPY 21dte IC strat. I’m rolling put credit spreads up as they close for .05. Converting call spreads to back ratios and flies when they are close to being breached. Too many trades to capture here but strat is up $225 since I started it 17 days ago. First layer is Feb 8. All layers are 2x per side. I’ll know soon how well this is working. So far, it’s a ton of work for peanuts but peanuts add up over time.
#shortstrangles BMY Sold March 15,…
#shortstrangles BMY
Sold March 15, 45/55 strangle for 1.42.
#earnings #closing BA Jan. 29…
WYNN
Rolled WYNN Feb 15 125 Call to March 15 130 Call for 0.43 credit. This is against my long Jan 2021 125 Call. #leaps.
TQQQ
STO March 15, 55/60 call spread @ .60 against my leaps in 2021
SPX 1-dte IC
Building an SPX 1dte position throughout the day. First trade is a ccs based on Theo 2731 gravity point, too many up days, other possible one or two day dampers. Adding trades as I take them.
STO SPX Feb6 2755/2760 BeCS @ .45 x1
STO SPX Feb6 2705/2700 BuPS @ .30 x2. Didn’t get the pullback after PMI/ISM that I expected.
STO SPX Feb6 2760/2765 BeCS @ .35 x1. This converts one 10w spread for .80 credit
STO SPX Feb6 2705/2700 BuPS @ .30 x1. Willing to go up to 8 BuPS.
STO SPX Feb6 2705/2700 BuPS @ .60 x1. 4 pcs total
Flied off the risk on the call spread for 2.30 debit. New position SPX Feb6 2745/2755/2565 call fly.
Update: BuPS x4 closed at .05 for $100 total profit.
Don’t want short risk tomorrow due to VIX upside warning potential at the close today.
REGN earnings analysis
#Earnings $REGN reports tomorrow morning. Below are details on earnings one-day moves over the last 12 quarters.
Nov. 6, 2018 BO +0.75%
Aug. 2, 2018 BO +6.99% Biggest UP
May 3, 2018 BO -1.25%
Feb. 8, 2018 BO -3.58%
Nov. 8, 2017 BO +2.66%
Aug. 3, 2017 BO -2.03%
May 4, 2017 BO +6.70%
Feb. 9, 2017 BO +1.91%
Nov. 4, 2016 BO +1.60%
Aug. 4, 2016 BO -1.80%
May 5, 2016 BO +4.73%
Feb. 9, 2016 BO -6.28% Biggest DOWN
Avg (+ or -) 3.36%
Bias 0.87%, slight positive bias on earnings.
With stock at 425.00 the data suggests these ranges:
Based on current IV (expected move into Friday per TOS): 403.84 to 446.16
Based on AVERAGE move over last 12 quarters: 410.73 to 439.27
Based on MAXIMUM move over last 12 Q’s (7.0%): 395.29 to 454.71
Open for requests on other symbols.
DATA earnings analysis
#Earnings $DATA reports tonight. Below are details on earnings one-day moves over the last 12 quarters.
Nov. 6, 2018 AC +15.35% Biggest UP
Aug. 2, 2018 AC -6.64%
May 2, 2018 AC +6.58%
Feb. 1, 2018 AC +8.97%
Nov. 2, 2017 AC -9.21%
Aug. 2, 2017 AC +9.02%
May 3, 2017 AC +6.12%
Feb. 2, 2017 AC +14.66%
Nov. 1, 2016 AC -12.11%
Aug. 2, 2016 AC -5.67%
May 5, 2016 AC -11.31%
Feb. 4, 2016 AC -49.44% Biggest DOWN
Avg (+ or -) 12.92%
Bias -2.81%, negative bias on earnings.
With stock at 132.00 the data suggests these ranges:
Based on current IV (expected move into Friday per TOS): 119.66 to 144.34
Based on AVERAGE move over last 12 quarters: 114.94 to 149.06
Based on MAXIMUM move over last 12 Q’s (49.4%): 66.74 to 197.26
Open for requests on other symbols.
Earnings Data Request $DATA
Hi @jeffcp66,
Do you have the earnings data set for $DATA. They report tomorrow (Tuesday) after the close?
Closed Early URI Puts / Sold NFLX Calls
#shortputs
$URI BTC 2/15 105 puts at .10. STO at 2.30. Thank you @fuzzballl
#shortcalls
$NFLX STO 2/8 155 at 1,70 (Covered)
WTW
#LongCalls #LEAPS – One fill today on a batch of my many over-writes on this one…
Bought to Close WTW FEB 8 2019 36.0 Calls @ .05 (sold for .75)
One more…
#VIXIndicator one more day with a $VIX close below 16.47 and we have an Upside Warning. I think today’s action foretells we are headed that way.
SPX roll
SPX 1-dte
#SPX1dte My third attempt at a long condor is the first losing one. Looks like the Feb 4th one will expire worthless. We’ll see how things play out through tomorrow if an Upside Warning hits, and proceed accordingly for the Feb 6th expiry.
I also backed out of this roll trade with a profit, as it could get steamrolled on the call side. I’ll look to sell a put spread to replace it.
BTC $SPX Feb 14th (monthly) 2600/2620/2760/2780 #CondorRoll for 3.95. Sold for 6.05 last Wednesday.
Market Tide v3 or updates?
Has anyone heard from Bryan about v3 or other updates? I thought v3 was imminent when he did the last webinar. I haven’t heard anything in a while but I had an email mixup with AlphaShark because I unsubscribed at one time.
#markettide
A TRADE:
CRON STO 2/8/18 25.0 CALLS @1.45 Will buy stock to cover if necessary.
Rolled up some CRON 2/8 CALLS from 21.0 to 23.0, same expiration this morning for a 1.95 debit.
AMZN put spreads
On the thesis that the 50 day moving average will hold as support, sold the following:
$AMZN Feb 15 1590/1580 BuPS @ 2.05
$AMZN Mar 15 1550/1500 BuPS @ 9.60
SPX 1-dte IC
Closed the SPX Feb4 IC from Friday where I added one spread at a time based on Tide
BTC Feb4 2740/2750 BeCS @. 05. STO @.90
BTC Feb4 2670/2665 BuPS @ .05 x3. STO @ .30, .25, .25
BTC Feb4 2680/2675 BuPS @ .05 x1. STO @ .35
Total profit $200
#spx1-dte
GOOGL earnings analysis
#Earnings $GOOGL reports tonight. Below are details on earnings FIVE-day moves over the last 12 quarters.
Thu 10/25/2018 AC -4.90%
Mon 07/23/2018 AC +3.46%
Mon 04/23/2018 AC -3.94%
Thu 02/01/2018 AC -8.22%
Thu 10/26/2017 AC +4.20%
Mon 07/24/2017 AC -4.00%
Thu 04/27/2017 AC +5.12% Biggest UP
Thu 01/26/2017 AC -4.29%
Thu 10/27/2016 AC -1.45%
Thu 07/28/2016 AC +4.47%
Thu 04/21/2016 AC -7.00%
Mon 02/01/2016 AC -8.69% Biggest DOWN
Avg (+ or -) 4.98%
Bias -2.10%, negative bias on earnings.
With stock at 1135.00 the data suggests these ranges:
Based on current IV (expected move into Friday per TOS): 1082.60 to 1187.40
Based on AVERAGE move over last 12 quarters: 1078.50 to 1191.50
Based on MAXIMUM move over last 12 Q’s (8.7%): 1036.37 to 1233.63
Open for requests on other symbols.
SPY 21dte IC
Sold Feb25 BuPS 264/262 x2 @ .30. Moved short put to 25 delta due to low vol.
Sold Feb25 BeCS 278/280 @ .28 to complete the IC.
Continuing to build my SPY 21dte positions. Waited for an MT reversal to sell the call side.
#spycraft
Expired
#optionsexpiration
$NFLX 345 and 352.50 calls (Covered)
$TLRY 85 call (Covered)
$AMD 20 put
$WYNN 116 put
$EXAS 82 put
#assignment
$T 31 put Basis 30.21 Stock at 30. Will sell calls until someone takes it away for the dividend. ;-}
Relax and enjoy the super bowl. You are all CHAMPIONS – thank you.
Downside Warning canceled!
#VIXIndicator Today’s $VIX close ends the 4-month Downside Warning. If we get two more closes at or below 16.47, it will trigger an Upside Warning, which usually means a strong rally for a few days or weeks.
Expirations AMZN SPX / Closed Early AMZN / ROKU BUPS / Roll TQQQ
#optionsexpiration
#bullputspreads
$AMZN STO 2/1 1605/1610 BUPS at .50 Expired same day. Thank you @honkhonk81 and jojo mojo
#spx1dte
$SPX 2630/2650/2765/2745
Closed Early
$AMZN BTC 2/1 1590/1600 BUPS as part of earnings IC at .20 Made 85% of max. Stock started to look soft in late afternoon and I did not want to be correct, I just wanted a profit. Thank you @jeffcp66 BECS expired!
#bucs
$ROKU BTO 3/15 40/50 BUCS at 4.80. Earnings Feb 21st
#rollup
$TQQQ BTC 2/1 46 call and STO 2/15 48.50 call at .15 credit. Sold against leap.
SPX 1-dte long
#SPX1dte Bought to open $SPX Feb 4th 2645/2660-2740/2755 condors for .55. (IV 7.94%: SPX 2704)
I reduced to 15-wide to make it cheaper, and also went to the strike below .06 on each side. This lowers probability, but short strikes are only 80 apart, which is the lowest I have had on any condor in this strategy, long or short.
#shortstock IP Sold short 100…
#shortstock IP
Sold short 100 shares of IP for 46.31
#earnings #closing IBM January 22…
SPX 1-dte switch
#SPX1dte My short condor from yesterday will expire worthless (sold for 1.00)
I am going to BUY the condor for Monday, since volatility on the options chain plummeted to below 9%, after being above 15% all week. (today would have been a good day to sell a condor in the morning, and close it by day’s end)
AMZN closed
#Earnings BTC $AMZN Feb 1st 1600/1590 put spreads for .25. Not going to mess with this one if it decides to get cute. Condors sold yesterday for 2.00.
Econ Calendar for week of 2/4/18
**Jerome Powell speaks Wednesday at 7pm ET


Link to calendar: https://us.econoday.com/byweek.asp?day=4&month=2&year=2019&cust=us&lid=0
EW closed, and remaining earnings trades
#Earnings #DoubleCalendar
Sold to close $EW Feb01/Feb08 170 dbl cals for 3.25 (avg price). Bought yesterday for 1.57.
#IronButterfly $NOW expiring at max loss of .65.
#IronCondor $AMZN expiring at full profit, sold yesterday for 2.00.
#LongStraddle $EBAY straddle bought for 2.23 on Tuesday. It had a subtle move, so I played the swings and managed to sell for 1.168. Even when long straddles miss, they aren’t too bad provided you have a few days and some swings.
LABU
#CoveredCalls – My other one is ITM and requiring lengthy rolls. Trying to stay out of the way on this one. Hopefully they’ll be adding strikes eventually. Pretty poor selection right now.
Rolled LABU FEB 15 2019 49.0 Call to MAR 08 2019 52.0 Call @ .25 credit
INTC trades
#Earnings #DoubleCalendar #LongStock #CoveredCalls #Dividends
Lat week’s double cal didn’t work but I stuck with the trade, selling the long put and taking assignment, cost basis of 47.34.
Today I lightened the load, selling slightly less than half of the stock for 49.00.
I’m converting the rest into a #PieTrade, so I sold to Open $INTC March 15th 50 covered calls for 1.01.
NVDA
#CoveredCalls – Looked safe a couple days ago but not now. Rolling out a week and up 5 points. Earnings the following week so very nice premium coming up. Have to do this now since I’ve gotta leave before the close.
Rolled NVDA FEB 01 2019 145.0 Call to FEB 08 2019 150.0 Call @ .30 credit
Short a 145.0 Put next week also. Setting up for the roll into earnings if needed.
#pietrades STO EOG Feb 8…
STO EOG Feb 8 98.5 put for 1.10. Cb 97.4 if assigned.
Another batch of 3 in another account for 1.05 or 97.45 if assigned.
#fuzzy
WDC so far ITM now that can’t roll. Closed the 40/40 for 6.45 credit resulting in 11.26 loss per contract. However, this is much better than if I had held the stock, would have been a 74 point loss as I originially had sold the 100 and 98 puts before Oct.
I will take the cash and use it for a better trade 🙂
T
#ShortPuts #CoveredCalls – Assigned early at 30.21 basis which I don’t mind. Can get the call sales done now.
Sold T MAR 15 2019 31.0 Calls @ .41
#earnings #doublecalendar INTC January 24,…
#earnings #doublecalendar INTC
January 24, bought a Jan. 25/Feb 1, strike 50 double calendar (following Jeff), Jan. 25, rolled the short put to March and sold the long put as INTC went down after earnings. Closed the March put today making 98.93 after all transactions.
A TRADE:
SFIX BTO STOCK @22.47 A Day trade.
Double Cals
#Earnings #DoubleCalendar For 2nd quarter in a row, $EW is killing it on this strategy. The long options (Feb 8th) retain a lot of value, but because stock price is so close to my 170 strike, I was able to exit partial for 4.30 near the open. Now waiting for even a better price as the Feb 1st short options decay.
$MRK was the loser…. Sold to close $MRK Feb01/Feb08 74.5 dbl cals for .30. bought yesterday for .47
Working on the $HON exit. Looks like I’ll be able to get a slight profit.
BA earnings closed
#Earnings #Iron Condor This one is close to full loss, but I closed the call side for 4.50, a discount from what is likely to be an expiration of 5.00. Sold the condors for 1.75. Closed the $BA Feb 1st 380/385 call spreads for 4.50. Fortunately, earnings wins from this week will easily exceed this loss!
NUGT calls
#ContangoETFs Yesterday, Sold $NUGT Sept 35 calls for 2.06. First time back in NUGT in a long time, and currently my only ContangoETF position.
SPX 1dte petri dish
Entering one lot at a time based on 5min and 30min MT signals. Will only take additional lots if they improve average credit or strikes. Quick experiment to see if this helps with defense. The last four trades I’ve defended didn’t need to be defended. Even though all but one were profitable, I don’t like being nervous all day.:-)
STO SPX Feb4 2745/2750 BeCS for .25 @ 7:33 am
STO SPX Feb4 2670/2665 BuPS for .30 @ 8:07 am
STO SPX Feb4 2740/2745 BeCS for .35 @ 8:50. This converts the ccs to a 10w @ .60 credit
STO SPX Feb4 2680/2675 BuPS for .35 @ 10:15
STO SPX Feb4 2670/2665 x2 @ .30 and .35 later in the day. Got busy so couldn’t do JIT posts.
All up 2x call side, 4x put side.
#SPX1-dte
January Jobs Report
#Jobs Much higher than expected, again. December revised lower.
+304,000 non-farm payroll jobs, vs. 170K expected
Unemployment at 4.0%, up 0.1%
U6 unemployment at 8.1%, up 0.5%
Wages up 0.1%, 3.2% year over year
Labor force participation 63.2%, up by 0.1
December revised down from 312K to 222K
November revised up from 176K to 196K
Good Morning
Good Morning
Almost canceled
#VIXIndicator We closed with $VIX only 0.10 above the cancelation level of the Downside Warning, which has been in effect since October 5th. If bears are going to show up, they better do it soon.
Double Calendar trades
Bought $HON Feb01/Feb08 144 for .85
Bought $MRK Feb01/Feb08 74.5 for .47
Bought $EW Feb01/Feb08 170 for 1.57
#earnings #shortputspread AMZN Sold March…
#earnings #shortputspread AMZN
Sold March 15, 1490/1500 put spread for 1.41
#lizardpies XBI decayed enough I…
XBI decayed enough I rolled it to an 83/83/83.5 jade lizard for 1.59 credit. cb 81.41 if assigned.
DECK condor
#Earnoings #IronCondor Sold to Open $DECK Feb 1st 105/110/145/150 iron condors for .85
