

#DiagonalBearCallSpreads – Adding one more…
Sold UVXY APR 12 2019 47.5 Call @ 2.00
#DiagonalBearCallSpreads – Adding one more…
Sold UVXY APR 12 2019 47.5 Call @ 2.00
#shortputs
$BMY BTC 6/21 45 puts at 1.20 STO at 3.50 on Jan 4 Hearing the little footsteps of stock assignment.
$BIIB STO 4/18 215/225 BUPS at 2.15
#DiagonalBearCallSpreads – Setting up the short side to sell against again. Free 90 strikes in April and May now. Thanks @Iceman for the strateegery!
Sold 1 UVXY APR 18 2019 47.5 Call @ 2.00
Bought 5 UVXY MAY 17 2019 90.0 Calls @ .43
#earnings LULU
Sold May 17, 110/180 strangle for 1.97, thanks for the data Jeff.
#DiagonalBearCallSpreads – Bought to Close UVXY MAR 29 2019 48.0 Call @ .15 (sold for 2.35)
#CoveredCalls Sold to Open #INTC Apr 26th 54 covered calls for 1.61. These expire before the ex-div. Earnings date not confirmed, so it could be before or after this expiry.
#Earnings $FIVE reports tonight. Below are details on earnings one-day moves over the last 12 quarters.
This stock is one of the most historically bullish movers on earnings.
Dec. 6, 2018 BO -2.66%
Sept. 6, 2018 AC +13.31%
June 6, 2018 AC +21.86%
March 21, 2018 AC +4.20%
Nov. 30, 2017 AC -0.46%
Aug. 30, 2017 AC -3.45%
June 1, 2017 AC +0.50%
March 22, 2017 AC +10.80%
Dec. 1, 2016 AC +9.87%
Aug. 31, 2016 AC -1.14%
June 2, 2016 AC +2.07%
March 22, 2016 AC +6.81%
Avg (+ or -) 6.43%
Bias 5.14%, strong positive bias on earnings.
With stock at 118.50 the data suggests these ranges:
Based on current IV (expected move into Friday per TOS): 108.40 to 128.60
Based on AVERAGE move over last 12 quarters: 110.88 to 126.12
Based on MAXIMUM move over last 12 Q’s (21.9%): 92.60 to 144.40
Based on DOWN max only (-3.5%): 114.41
Open to requests for other symbols.
#Earnings $LULU reports tonight. Below are details on earnings one-day moves over the last 12 quarters.
Dec. 6, 2018 AC -13.36%
Aug. 30, 2018 AC +13.08%
May 31, 2018 AC +16.31%
March 27, 2018 AC +9.21%
Dec. 6, 2017 AC +6.42%
Aug. 31, 2017 AC +7.19%
June 1, 2017 AC +11.54%
March 29, 2017 AC -23.43%
Dec. 7, 2016 AC +15.04%
Sept. 1, 2016 AC -10.55%
June 8, 2016 BO +4.90%
March 30, 2016 BO +10.71%
Avg (+ or -) 11.81%
Bias 3.92%, positive bias on earnings.
With stock at 144.550 the data suggests these ranges:
Based on current IV (expected move into Friday per TOS): 130.30 to 158.70
Based on AVERAGE move over last 12 quarters: 127.43 to 161.57
Based on MAXIMUM move over last 12 Q’s (23.4%): 110.64 to 178.36
Based on UP max only (+16.3%): 168.07
Open to requests for other symbols.
#shortputs
$JD STO 5/17 27 put at .94
$TNDM STO 3/29 68.50 put at 1.10
#shortcalls
$SFIX STO 3/29 29.5 call at .30 Covered
$BEAT STO 4/18 70 call at 1.00 Covered
#LongLEAPs #SyntheticCoveredCalls BTC $SQ Mar 29th 79.5 calls for .05. Sold for .95 last Tuesday.
SYNA New HOD, 35.0
#SPX1dte Sold $SPX Mar 27th 2735/2755/2840/2855 condors for 1.20. (IV: 13.97%, SPX 2806)
Also, BTC March 29th 2860/2885 call spreads for 1.05. Sold for 3.75 on Friday.
BTO #fuzzy 41/41/40 C/P/P Apr 18 $1.34
Bought to close $DUST Jan 17 2020 40 calls @ .45. Sold for 4.50 on 1/30/18 and 6.00 on 2/5/18.
SYNA HOD
#ShortPuts – Hanging out just above the 200ma so booking it early just in case. I’ll revisit with a break of support or for earnings next month.
Bought to Close BA APR 18 2019 325.0 Put @ .90 (sold for 3.50)
SYNA BTO STOCK @33.91 & 34.37
TRIP closed at a 1.47 loss per contract. I probably could have recovered but I have some other positions that are doing extremely well but using up a lot of margin so I closed this so i could hold onto the winning positions.
#lizardpies will be 2 versions. 1 version will be 43-45 DTE strangles and the other will be weekly ATM straddles with the next strike call purchase. These will be more weeklies. The longer ones will be closed or rolled at 50% profit. Trying this as an ongoing live experiment. Has done well so far so extending it to more income trades. Don’t think we need another hashtag, will just be in format short put strike/short call strike/long call strike.
For example SQ currently this Friday 76/76/76.5.
#ContangoETFs Sold to Open $NUGT Jan 2020 40 calls for 2.10. Took over a month since it last peaked, but patience can be a virtue with these levered suckers.
#Earnings — I’m selling the CCL Mar 29th 53/56.5/60 #IronButterfly. Trying for 2.30, but will likely have to go lower. Not a big mover… its only large move was in December during the Christmas dive.
$CCL reports tomorrow morning. Below are details on earnings one-day moves over the last 12 quarters.
Dec. 20, 2018 BO -9.48% Biggest DOWN
Sept. 27, 2018 BO -4.83%
June 25, 2018 BO -7.85%
March 22, 2018 BO -1.28%
Dec. 19, 2017 BO +2.29%
Sept. 26, 2017 BO +2.86%
June 22, 2017 BO -1.11%
March 28, 2017 BO +0.66%
Dec. 20, 2016 BO +2.27%
Sept. 26, 2016 BO -1.67%
June 28, 2016 BO +0.20%
March 30, 2016 BO +5.49% Biggest UP
Avg (+ or -) 3.33%
Bias -1.04%, negative bias on earnings.
With stock at 56.50 the data suggests these ranges:
Based on current IV (expected move into Friday per TOS): 53.53 to 59.48
Based on AVERAGE move over last 12 quarters: 54.62 to 58.38
Based on MAXIMUM move over last 12 Q’s (9.5%): 51.14 to 61.86
Based on UP max only (+5.5%): 59.60
Open to requests for other symbols.
#DiagonalBearCallSpreads – Adding one. Sold against April long 90’s and April 66 strike DITM puts. Virtually zero upside risk in this one.
Sold UVXY MAR 29 2019 48.0 Call @ 2.35
TSLA #Shortput STO Apr18 200 put for 2.56. Going long near recent support level of about 245. The 200 put is 9 delta.
SYNA BTO STOCK @31.82
NUGT #Shortcalls Sold May 29th 23.50 calls at 0.25.
#SPX1dte Filled at 9:14am ET on $SPX Mar 25th 2755/2735 put spreads for .25 (bought to close). Condors sold Friday for 1.00. Order in to close short 2855 calls for .05.
#Earnings #DoubleCalendar
Sold to close $NKE Mar22/Mar29 88 put calendar for .02. Holding long 88 calls into next Friday. Good job by Mort closing the put calendar earlier at .17… I just had too much faith. Double Calendars bought yesterday for .49.
Exercising: $TIF 96/100/102 calls #BrokenWingButterfly for 2.00. Bought yesterday for 1.50. Allowing to exercise on IB for about 70 cents in fees per lot, but closed manually for 2.00 on TOS to avoid $45 in fees.
#SPX1dte Sold $SPX March 25th 2735/2755/2855/2875 condors for 1.00 (IV: 11.64%, SPX: 2809)
STO April 1, 2575/2625 put spread at .60 cents.
–Various Fed speakers throughout the week
–GDP report Thursday before the opening bell.
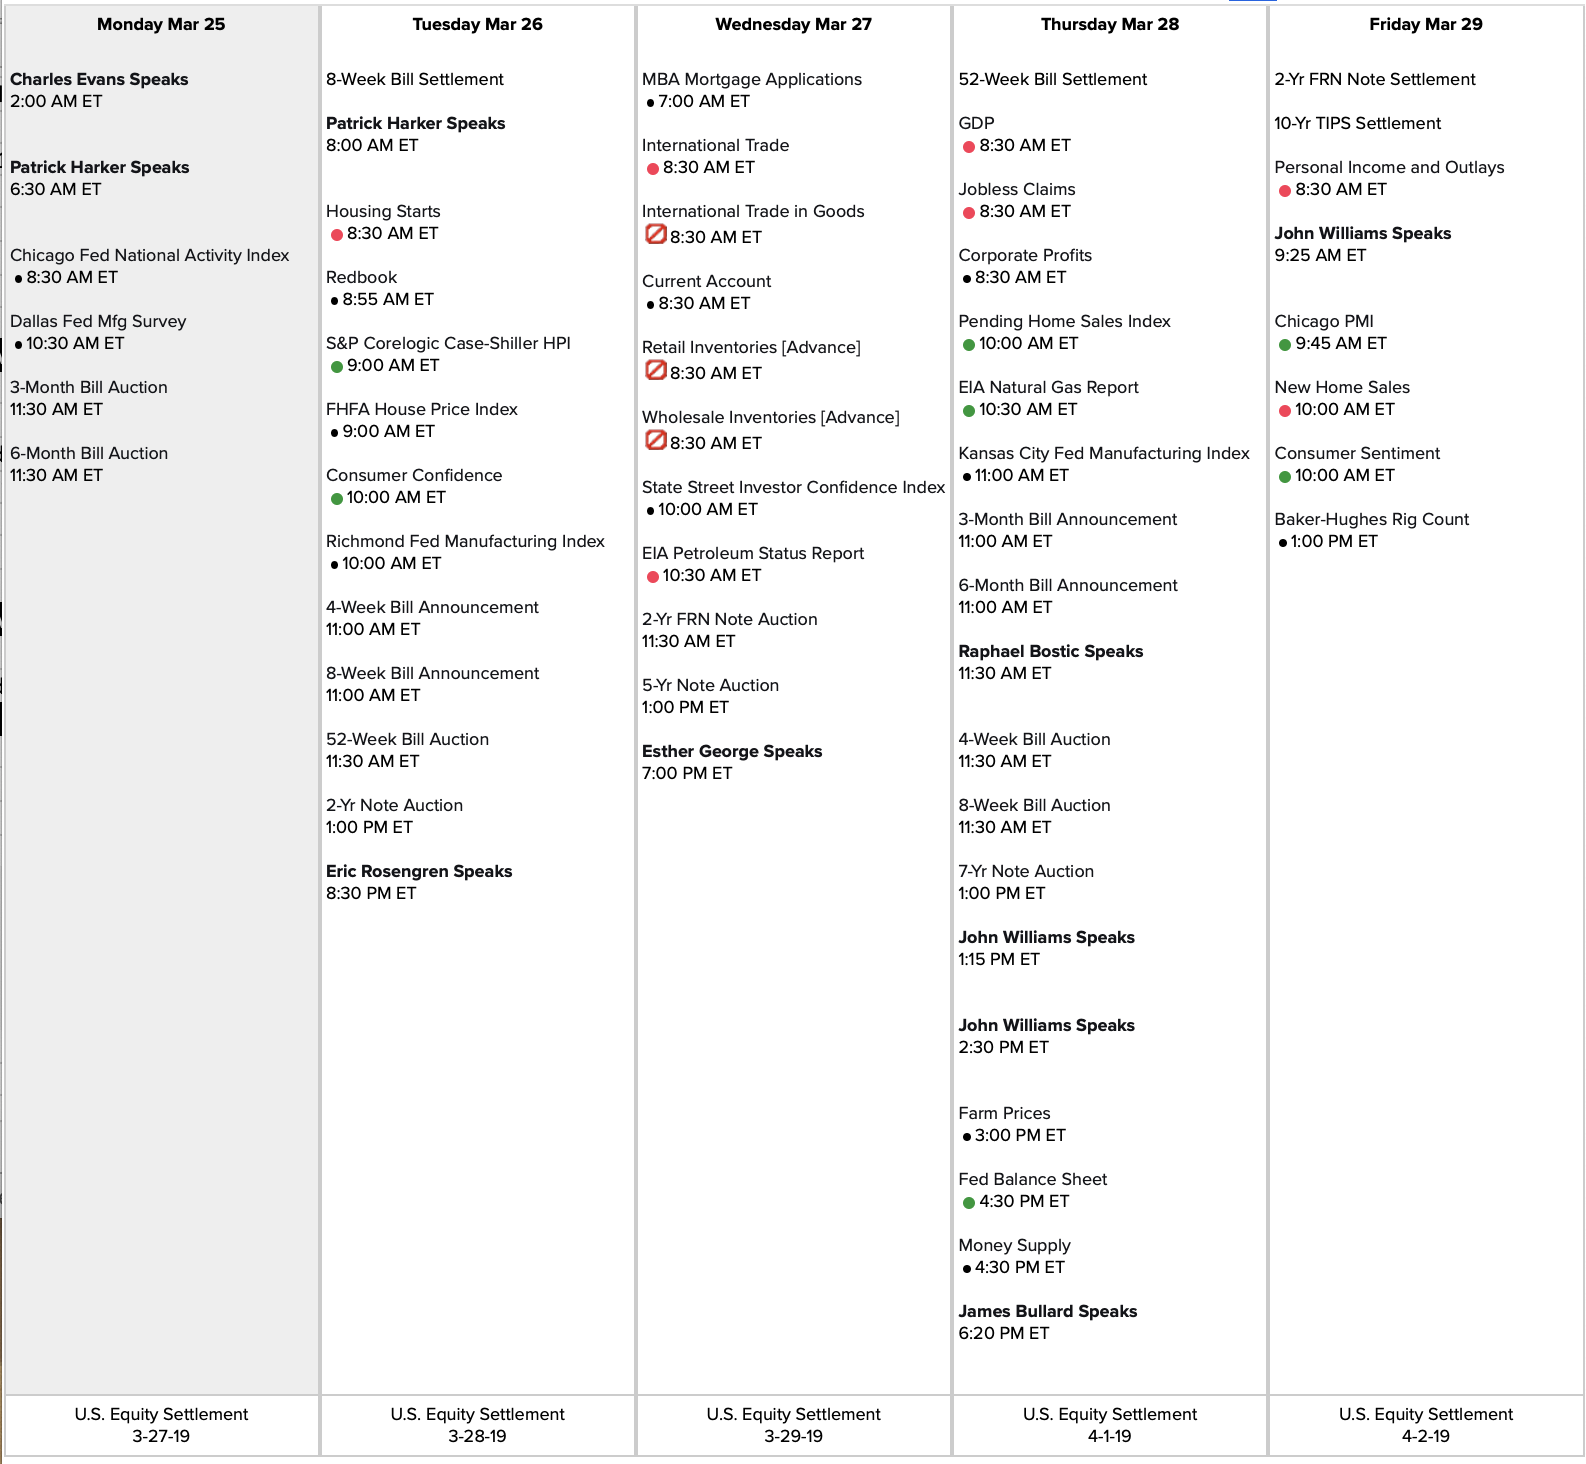

Link to calendar: https://us.econoday.com/byweek.asp?day=25&month=3&year=2019&cust=us&lid=0
Another position to offset SVXY losses.
Bought $VXXB Apr 5 33/28 bear put spread for 2.50 debit. Will look to take 1.25 profit out of it.
#SPX1dte I can say I was not expecting this after yesterday, but clearly volatility is coming back for at least a visit, if not to stay longer this time. Also getting too loose with my rules…. stop level was hit on the first dip. But it never fails that when I follow my rule and dump out for breakeven, the day ends flat. If I let it go, then we end up ITM. This is two big hits in the month, so must change my ways. Thank God Feb was so strong for my accounts!
BTC $SPX March 22nd 2810/2790 put spreads for 5.00. Condors sold for .80 yesterday.
With the warning signal from the VIX looking to sell a week-out call spread. Also have the March 29th 2820/2800 put spreads, now ITM. Will give these until Monday to see if this is a head fake and look to roll it then.
#VIXIndicator It was only a “minor” one so not surprising that it didn’t last long or go far… VIX spiked today to reach 25% higher than yesterday’s close, so that cancels the minor upside warning. A close at 17.04 or higher would be a Downside Warning.
Sold $UVXY May 17 55/65 bear call spread @ 1.20
NUGT Closed my Mar 22nd 21 short calls at .04. I will look to cover up again next week. Have a great weekend all.
STO April 3, 2600/2650 bull put spread for a net of .66 cents
Closed BWBF $2.19 cost 1.61 yesterday
Thanks to Jeff
Closed put Cal .17 will wait for the balance
#optionsexpiration and position updates.
I was hoping for a reversal today, but alas I was never able to get short. But the run has brought 2 accounts very close to all time highs and 1 of them had some SVXY crap in them so that is a good thing.
#pietrades
EOG 90.5 cc at cost basis of 91.79. Assigned off 96 put 2 weeks ago. Closes next week, nit sure if I will roll or let call out. I could use the money elsewhere.
EOG second batch 89 call at 92.63. Same idea.
TRIP 52.5 cc rolled down to 8 DTE 52 for 51.78. I will let assign if ITM
ERX 8 DTE 23 cc at 22.31. Will assign if ITM
TQQQ 54.5 CC at 56.39 cost basis. A pullback would be helpful
FAS 57 cc at 54.20. Will let assign next week.
TQQQ 53.5 cc at 56.75
TQQQ 55 cc at 53.79
#lizardpies
EXPE 36 DTE 115/131/132 at 2.31 credit
SMH 36 DTE 100.5/110/111 for 1.38 credit
#fuzzy
GILD 65/65 at 8.41
XBI 80/80/91.5 at 11.74
GILD 67.5/67.5 rolled down 22 DTE for 0.28 debit so now cost basis is 6.39.
Ok, just about finished with taxes which is my yearly review of every trade I did the previous year.
SVXY was a complete debacle.
#fuzzy held up the best during the correction but I am still most consistent with #pietrades. However, looks like the #lizardpies may actually be better, especially when selling the ATM straddle. That is the most amount of income you can collect. Then the long call option prevents losses to the upside. I will be doing more of these on a weekly basis.
In fact, I have a lot of time at the moment and found some Tasty trade research (recent) that confirms it. Less volatile returns than even strangles.
https://www.tastytrade.com/tt/shows/options-workshop/episodes/research-on-the-big-lizard-strategy-01-15-2019
https://www.tastytrade.com/tt/shows/options-workshop/episodes/using-big-lizard-trades-in-a-portfolio-01-22-2019
If you are in a hurry the slides will sum it up. Almost stayed flat during the 2008-2009 market, certainly beat every other tactic.
Moved some money so hopefully some directional opportunities tomorrow.
🙂
NTNX BTO STOCK @41.98, 42.10, & 43.07
#SPX1dte Sold to Open $SPX March 22 2790/2810/2880/2890 condors for .80. (IV: 10.86%, SPX 2851)
Also, closed $SPX March 22 2780/2755 put spreads for .10. Sold for 3.45 on March 13th.
#Earnings Bought to Open $TIF 96/100/102 #BrokenWingButterfly (calls) for 1.50.
Max loss: $150
Downside breakeven: 97.50
Max profit: 2.50 (if pin at 100)
Capped profit at 102 and above: .50
#Earnings Bought to Open $NKE Mar22/Mar29 88 #DoubleCalendar for .49.
#Earnings — $TIF reports tomorrow morning. Below are details on earnings one-day moves over the last 12 quarters.
Nov. 28, 2018 BO -11.82% Biggest DOWN
Aug. 28, 2018 BO +0.99%
May 23, 2018 BO +23.28% Biggest UP
March 16, 2018 BO -5.06%
Nov. 29, 2017 BO -1.58%
Aug. 24, 2017 BO -1.32%
May 24, 2017 BO -8.70%
March 17, 2017 BO +2.71%
Nov. 29, 2016 BO +3.14%
Aug. 25, 2016 BO +6.40%
May 25, 2016 BO +0.06%
March 18, 2016 BO +2.95%
Avg (+ or -) 5.67%
Bias 0.92%, slight positive bias on earnings.
With stock at 100.00 the data suggests these ranges:
Based on current IV (expected move into Friday per TOS): 93.90 to 106.10
Based on AVERAGE move over last 12 quarters: 94.33 to 105.67
Based on MAXIMUM move over last 12 Q’s (23.3%): 76.72 to 123.28
Based on DOWN max only (-11.8%): 88.18
Open to requests for other symbols.
#Earnings — $NKE reports tonight. Below are details on earnings one-day moves over the last 12 quarters.
Dec. 20, 2018 AC +7.16%
Sept. 25, 2018 AC -1.28%
June 28, 2018 AC +11.12% Biggest UP
March 22, 2018 AC +0.32%
Dec. 21, 2017 AC -2.28%
Sept. 26, 2017 AC -1.91%
June 29, 2017 AC +10.96%
March 21, 2017 AC -7.05% Biggest DOWN
Dec. 20, 2016 AC +0.98%
Sept. 27, 2016 AC -3.77%
June 28, 2016 AC +3.84%
March 22, 2016 AC -3.79%
Avg (+ or -) 4.54%
Bias 1.19%, positive bias on earnings.
With stock at 87.70 the data suggests these ranges:
Based on current IV (expected move into Friday per TOS): 83.36 to 92.04
Based on AVERAGE move over last 12 quarters: 83.72 to 91.68
Based on MAXIMUM move over last 12 Q’s (12.7%): 77.95 to 97.45
Based on DOWN max only (-7.1%): 81.53
Open to requests for other symbols.
BTO Mar 22 165/162.5 Puts $1.02
Taking a shot on this #in/out
BTO Mar 29 357.50/360.00 $1.85 #supercharger
2x
STC Mar 22 182.5/185 Call spread $ 2.40
Bought Tuesday for 2.00
BTO Mar 29 135/137 Calls $1.10 Earnings next Wednesday, looking for a move up into earnings and DK in/out spread
OSTK 3/22/19 20.0 PUT @.50 Expires tomorrow
SYNA 3/22/19 33.5 PUT @.45 Expires tomorrow. A new one for me. Recently cratered.
#ShortPuts – Best ticker of the year so far and hate to not be involved. I rarely sell puts on rising stocks but taking a shot anyway. Selling near the expected move and close to the rising 50ma for a basis if I get the stock. Two weeks prior to earnings also. This is also the level it could fall back to in Dan’s old phase 2 of a squeeze breakout. Wow…I’ve almost convinced myself that I hope the stock falls! 🙂 🙂
Sold 1 NVDA APR 26 2019 165.0 Put @ 3.01
#FallingKnife – No position here (remember Valeant and Mylan?)…I’ll see where it is when they add some more strikes in May. Earnings April 24th…
The wk after March option expiration (so this wk) has seen the S&P 500 down each of the past 7 yrs. Only wk to do that.
Also, the avg return the past 7 yrs is -1.6% = making it the worst wk of yr.
In fact, the SPX was down 6% this same wk last yr.
Hmm. pic.twitter.com/dwMKQQLoSO
— Ryan Detrick, CMT (@RyanDetrick) March 21, 2019
BTO MU Mar22/29 36/36/44/44 put/put/call/call @.39
BTO MU Mar22/29 40 call cal @ .26
Max risk .65. Max potential profit 1.29
So far, MU is stuck after the announcement. Best possible scenario for the calendars.:-)
#dubdubcal
Looking at today’s price action and feeling like the down move (at least in the short term) could be exhausted. Sold $DIS Apr 18 106/101 bull put spread for 1.07 with the stock at 109.21. Delta of the short puts is 32.
#Earnings — $WSM reports tonight. Below are details on earnings THIRTY-FOUR-day moves over the last 12 quarters, since the next available options are 29 days from expiry.
Thu 11/15/2018 AC -18.61% Biggest DOWN
Wed 08/22/2018 AC +4.62%
Wed 05/23/2018 AC +26.22% Biggest UP
Wed 03/14/2018 AC -9.19%
Thu 11/16/2017 AC +1.95%
Wed 08/23/2017 AC +15.20%
Wed 05/24/2017 AC -2.43%
Wed 03/15/2017 AC +11.99%
Thu 11/17/2016 AC +0.37%
Wed 08/24/2016 AC -6.61%
Wed 05/25/2016 AC -1.78%
Wed 03/16/2016 AC +0.38%
Avg (+ or -) 8.28%
Bias 1.84%, positive bias on earnings.
With stock at 57.50 the data suggests these ranges:
Based on current IV (expected move into APRIL EXPIRATION per TOS): 51.34 to 63.66
Based on AVERAGE move over last 12 quarters: 52.74 to 62.26
Based on MAXIMUM move over last 12 Q’s (26.2%): 42.42 to 72.58
Based on DOWN max only (-18.6%): 46.80
Open to requests for other symbols.
NTNX Up 2.65, well into the gap.
#SPX1dte Earlier, bought to close $SPX March 20th 2870 short calls for .05.
Just now, BTC 2790/2770 put spreads for .10.
Sold condors yesterday for .75. Chose to not allow to expire as FOMC announcements are unpredictable. Now, however, as we are dead flat, things look safe for expiry.
Have enough cash sitting around to open another account. I know some of you are using tastyworks. I applied but have not funded yet.
Questions
1. Execution and platform similar to TOS? TOS saves me money not on commissions but they usually wiggle in between the bid/ask (that saves me more than commissions)
2. Any additional tools on tastyworks that make it worthwhile?
3. Any problems with it?
4. Any idea what the portfolio margin limit is?
5. Do you have to get the market feed (currently $100 a year), or is there enough data on the platform to make it work without it?
Thanks in advance.
Of course I can also move the money to an existing TOS account, that’s why I am curious about the works.
#earnings (kind of)MU
Sold May 17, 34/46 strangle for 1.62, profitable beyond the recent max 1 day moves. Thanks for the data Jeff.
#CoveredCalls – Little bit of a pullback helping with this roll…
Rolled TNA Mar 29 2019 54.0 Calls to May 17 2019 56.0 Calls @ .30 credit
#earnings FDX
Yesterday sold April 18, 160/202.50 strangle for 1.67, bought today for 1.12.
#Earnings — $MU reports tonight. Below are details on earnings one-day moves over the last 12 quarters.
Dec. 18, 2018 AC -7.91%
Sept. 20, 2018 AC -2.86%
June 20, 2018 AC +0.83%
March 22, 2018 AC -7.99%
Dec. 19, 2017 AC +4.02%
Sept. 26, 2017 AC +8.51%
June 29, 2017 AC -5.11%
March 23, 2017 AC +7.40%
Dec. 21, 2016 AC +12.68% Biggest UP
Oct. 4, 2016 AC -0.56%
June 30, 2016 AC -9.15% Biggest DOWN
March 30, 2016 AC -0.09%
Avg (+ or -) 5.59%
Bias -0.02%, no significant bias on earnings.
With stock at 40.00 the data suggests these ranges:
Based on current IV (expected move into Friday per TOS): 37.05 to 42.95
Based on AVERAGE move over last 12 quarters: 37.76 to 42.24
Based on MAXIMUM move over last 12 Q’s (12.7%): 34.93 to 45.07
Based on DOWN max only (-9.2%): 36.34
Open to requests for other symbols.
#ShortPuts – Jumping back into this one selling at the expected move and prior to next earnings…
Sold 1 NTES APR 26 2019 220.0 Put @ 3.20
A TRADE: Up this morning. Want the stock a little cheaper. An add.
NTNX STO 3/22/19 38.0 PUTS @.50
Afternoon I have returned from my hiatus. I wont be back fully until mid May. Can’t get logged in via Microsoft Edge but can through Internet Explorer. Go figure. I sold to open NUGT March 22nd 21 Calls against my stock for 0.16 when NUGT was at 19.65.
#shortcallspreads AVGO
Sold April 18, 315/325 for 1.28.
#shortputs
$AMZN STO 3/22 1710/1690 BUPS at 1.30
#ShortPuts – It’s been a good one last few weeks. Completely out now…
Bought to Close NVDA APR 18 2019 140.0 Put @ .23 (sold for 3.30)
#SPX1dte Sold $SPX March 20th 2770/2790-2870/2885 condors for .75. (IV: 12.0%, SPX: 2832).
STO April 18, 24 puts @ .69
Stock breaking out on volume
#shortputs
$NTNX STO 3/22 38 puts at .85 Inspired by @honkhonk81 faith in the stock.
https://s3.amazonaws.com/cherry-picks-s3-bucket-newsletter/live/19_03_19_tastytrade_Research.pdf?mc_cid=3a25abc875&mc_eid=c66a1885a5
#SPX1dte I’m reversing my ill-timed decision to sell a call spread yesterday. We’re in an Upside Warning and the market strength is pervasive. I fortunately got a pullback on some China murmurs, so was able to get out at a non-embarrassing price.
Bought to close $SPX Mar 22nd 2860/2885 call spreads for 4.80. Sold yesterday for 3.10
Sold to Open SPX Mar 29th 2820/2800 put spreads for 4.80
STO April 10, 2710/2735 bull put spread at 1.90


