
Small play, short term.
BTO $JDST Stock @9.81 Debit
STO $JDST Mar-13-2020 9.50 Calls @1.11
Small play, short term.
BTO $JDST Stock @9.81 Debit
STO $JDST Mar-13-2020 9.50 Calls @1.11
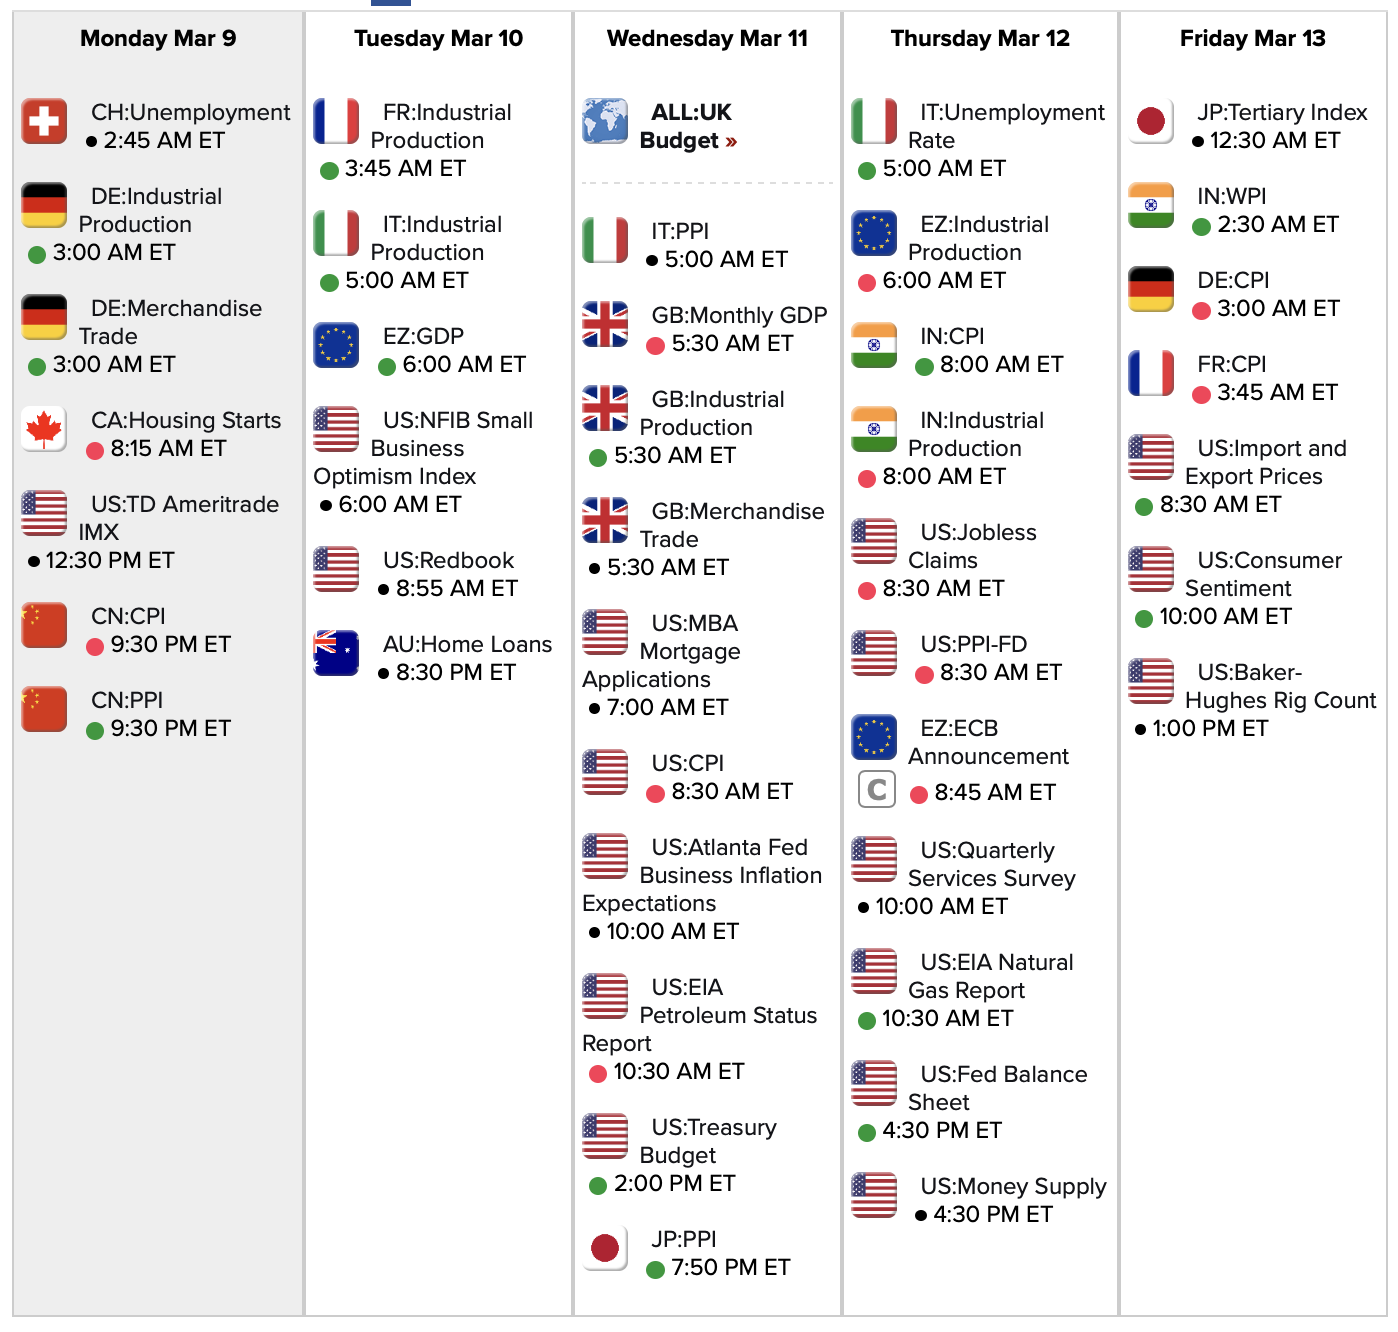

Link to calendar: https://research.investors.com/economic-calendar/
Bought #ironcondor for 1.33, sold yesterday for 1.91. COST is down about 6 points today, I’ll take the gain while I can.
Thanks for the data Jeff
#shortputs DAL
Added a March 20, 35 put for .66, stock is at 45 and up today.
#VXXgame My first purchase of puts: Bought to open $UVXY April 17th 20 puts for 1.39. I screwed up on my order, this can be gotten for less.
#BearCallSpreads – First time in these strikes.
Sold UVXY JAN 17 2021 45.0/55.0 Bear Call Spreads @ 2.01
#ShortPuts – Rolled the rest of my short puts up and in right at the close yesterday. Completely out of all them now. I did have to buy stock pre-market to cover the DITM calls I had sold yesterday against the short puts. Basically traded all the annoying short puts that were tough to sell against for a half size covered call position.
Not seeing a reverse split coming anytime soon so should have many weeks to sell.
Bought to Close UVXY MAR 6 2020 26.5 Puts @ .05 (sold a long time ago for 1.05)
Bought to Close UVXY MAR 6 2020 31.5 Puts @ .35 (sold a long time ago for 1.00)
#VXXgame Sold to Open $UVXY March 20th 40 calls for 5.50. Against a higher number of March 25 and 35 longs.
#ContangoETFs This was just too much to resist. I need to get back the losses I took by exiting last week.
Sold $DRIP March 20th 335 calls for 27.00.
#ShortPuts – Scaling in. Any of these should be very easy to roll if I decide I don’t want the stock. Next target will be April 225 for over 5 bucks.
Sold SPY APR 17 2020 250.0 Put @5.20
#Jobs — beating expectations again
+273,000 non-farm payroll jobs, vs. 175K expected
Unemployment at 3.5%, down by 0.1%
U6 unemployment at 7.0%, up by 0.1%
Wages up 0.3%; +3.0% year over year
Labor force participation 63.4%, unchanged
January revised up from 225K to 273K
December revised up from 147K to 184K
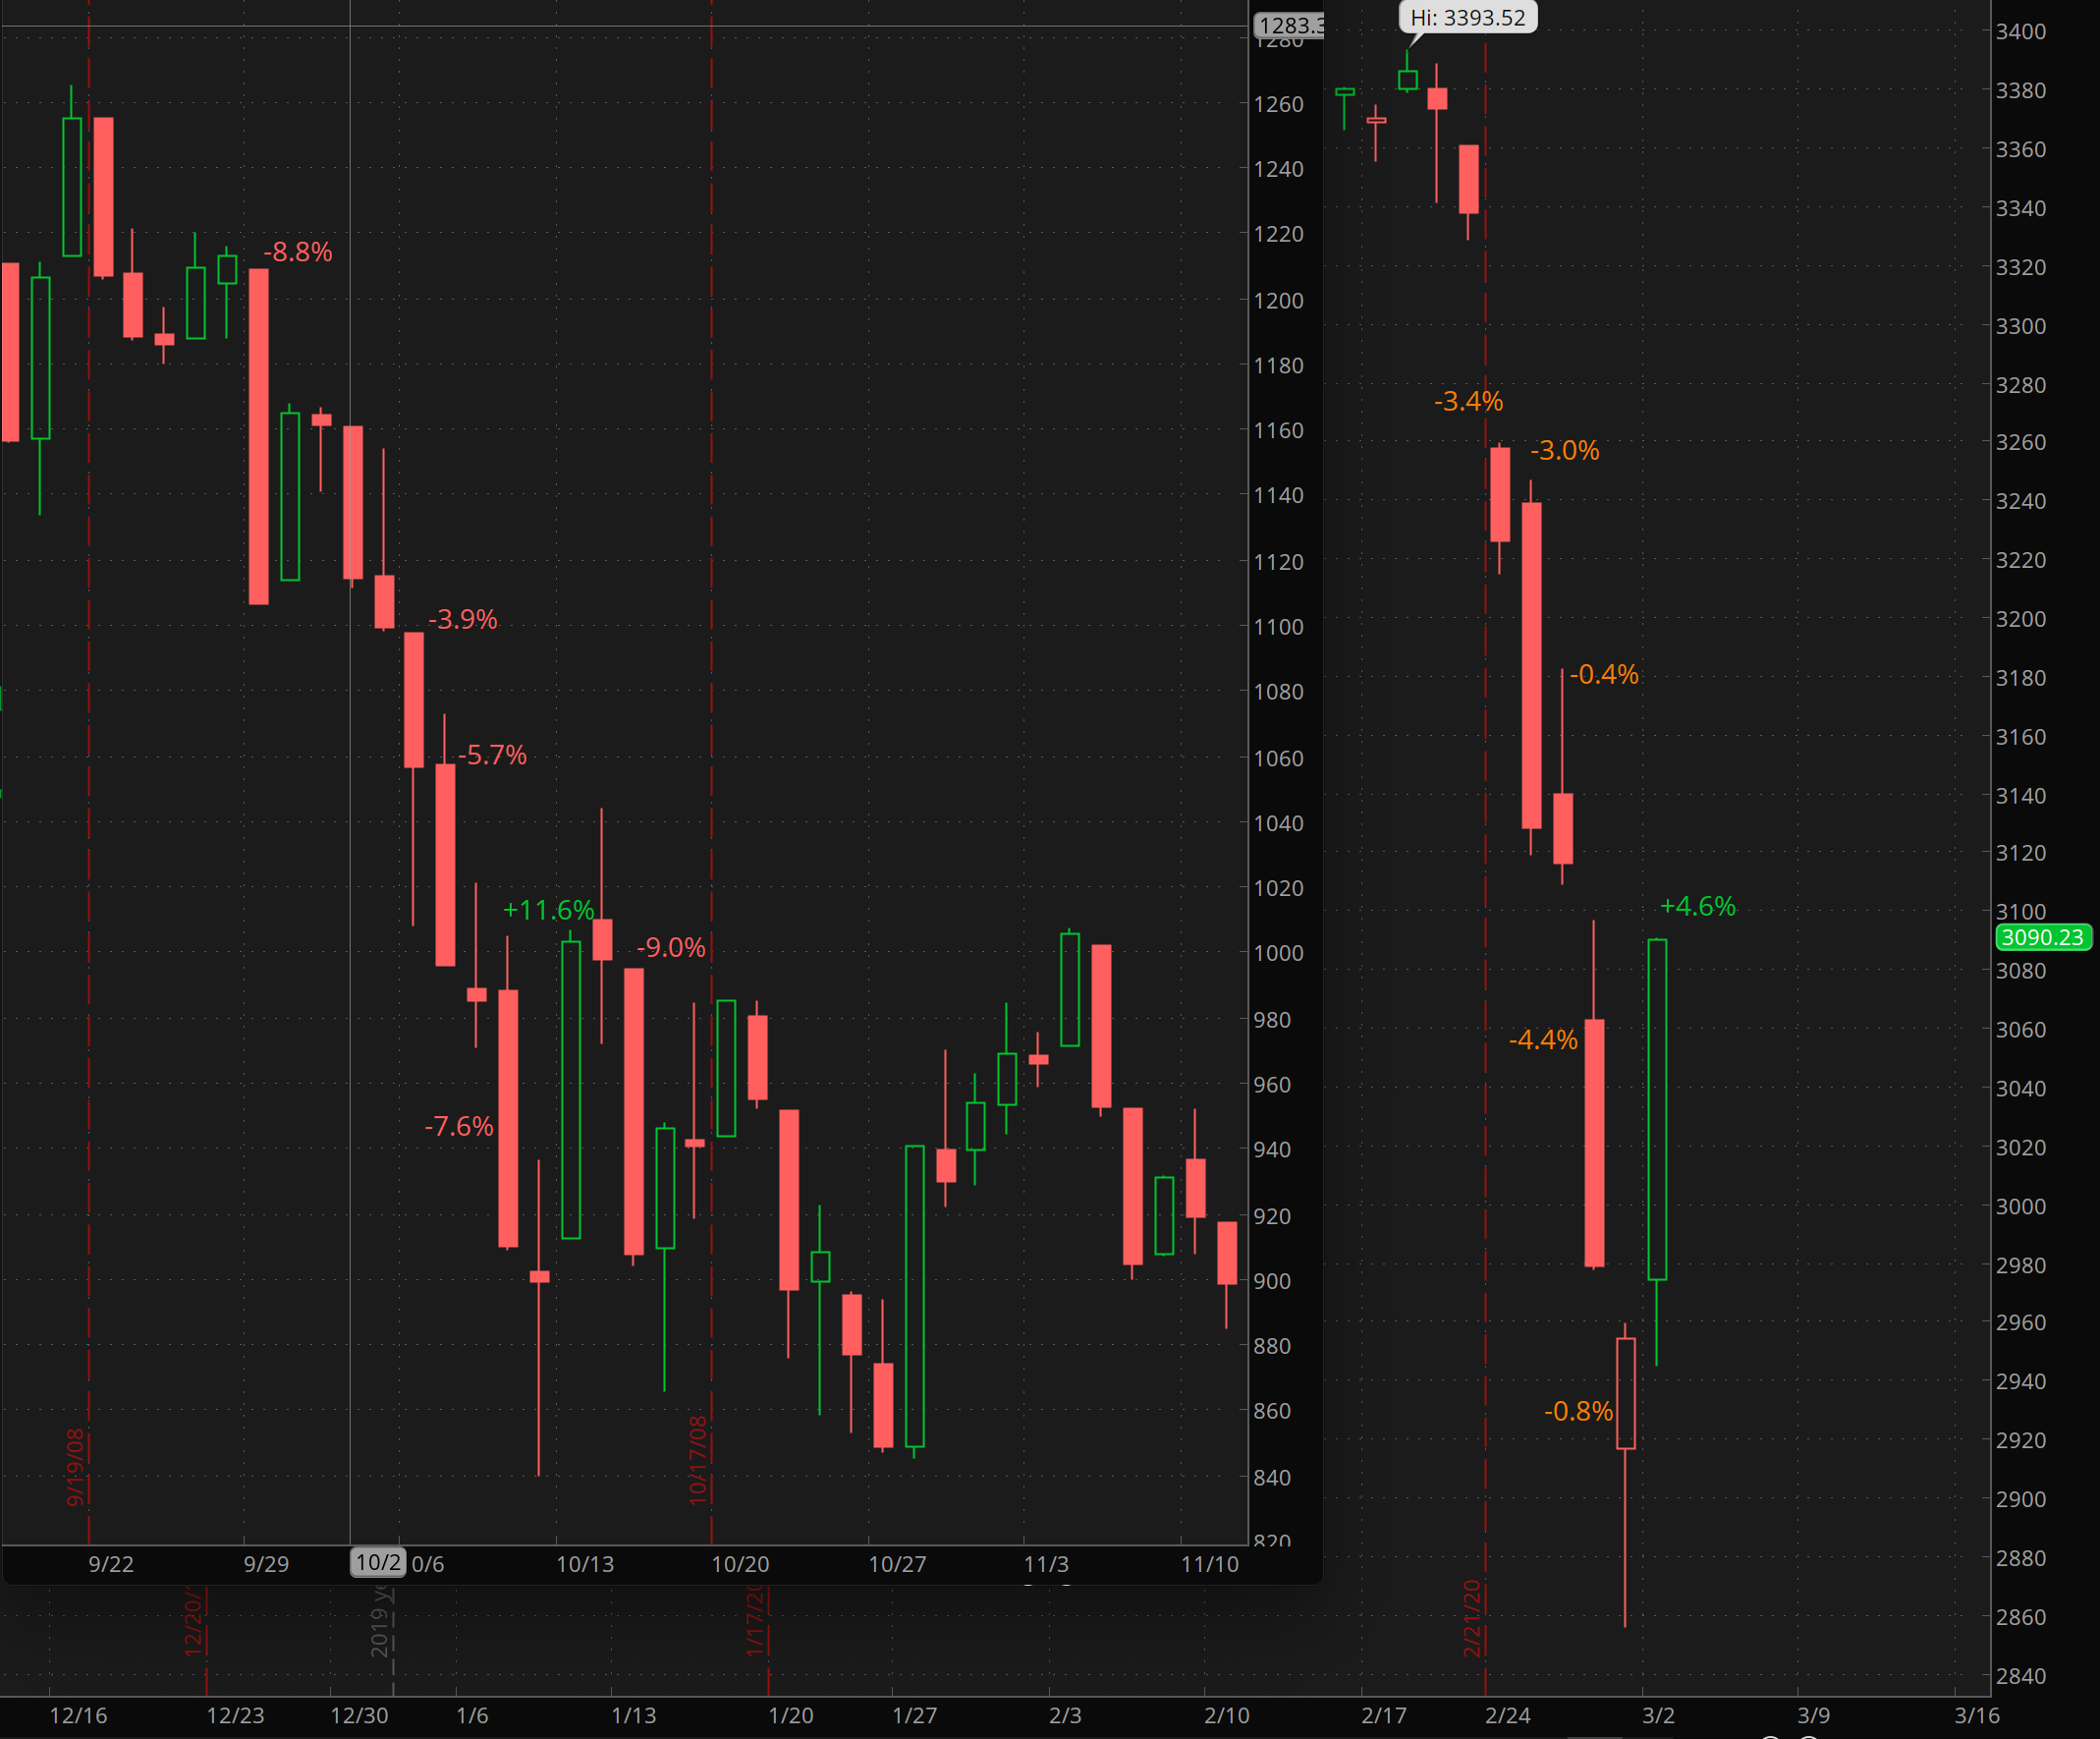
Following up from my Monday post comparing this correction to 2008’s… we are now looking more similar to the August 2011 correction.
Below, Aug 2011 is on the left, 2020 on the right. At the lows of Aug 2011, we had a week of extreme ups and downs like we have just experienced. In 2011, we then experienced a wide consolidation pattern into early October, when we finally went a bit lower and found the bottom. An extreme rally followed that.

#SPX1dte Sold to Open $SPX March 6th 2840/2860-3140/3160 for 1.80. IV 43.65%, SPX 3020, deltas -.06, +.06
#VXXGame Sold to Open $VXX March 20th 29 calls for 1.95. Offset against March 25 and 27 long calls. First ones I have sold ABOVE my longs, which were bought for .30 and .26 respectively.
#ShortPuts – Adding one…
Sold SPY APR 17 2020 275.0 Put @5.60
#ShortPuts – Pretty good premium in this thing so adding one…
Sold ROKU MAR 20 2020 95.0 Put @ 2.05
#ShortStrangles #ShortPuts #Earnings – Booked at the open since I’ll be out most of the day…
Bought to Close SPLK MAR 13 2020 130.0/172.5 Strangle @ 1.20 (sold for 3.00)
Bought to Close SPLK MAR 13 2020 135.0 Put @ 1.60 (sold for 2.10)
#shortputs LUV
Sold a March 20, 40 put for .90, stock at 45.
#earnings #ironcondor COST
Sold March 20, 265/275/345/355 for 1.91. The price is jumping all over.
Thanks for the data Jeff.
#Earnings $COST reports tonight. Below are details on earnings one-day moves over the last 12 quarters.
Dec. 12, 2019 AC -1.83%
Oct. 3, 2019 AC +0.92%
May 30, 2019 AC -0.81%
March 7, 2019 AC +5.08% Biggest UP
Dec. 13, 2018 AC -8.58% Biggest DOWN
Oct. 4, 2018 AC -5.55%
May 31, 2018 AC -0.55%
March 7, 2018 AC -0.89%
Dec. 14, 2017 AC +3.32%
Oct. 5, 2017 AC -5.97%
May 25, 2017 AC +1.79%
March 2, 2017 AC -4.33%
Avg (+ or -) 3.30%
Bias -1.45%, negative bias on earnings.
With stock at 317.50 the data suggests these ranges:
Based on current IV (expected move into Friday per TOS): 303.56 to 331.44
Based on AVERAGE one-day move over last 12 quarters: 307.02 to 327.98
Based on MAXIMUM one-day move over last 12 Q’s (8.6%): 290.26 to 344.74
Based on UP max only (+5.1%): 333.63
Open to requests for other symbols.
BTC 125/175 strangle at 1.35, sold at 3.40 yesterday. Thanks to Jeff for the data.
New highs for $VXX and $UVXY, even though $VIX pretty far off its highs, and indices far off their lows.
SPX crosses above 50% of pull back
RAD BTO STOCK @17.02 I mentioned the other day, that RAD, on the Point & Figure Chart gave a Buy signal, soooo when it came back to 17.0 today I added. My other RAD stock is covering some short calls expiring this Friday.
Sold ABBV 17 APR 20 80 PUT @1.55…if assigned div would yield 6%
#BearCallSpreads – Added in my little tastyworks account…
Sold UVXY JAN 17 2021 20.0/30.0 Bear Call Spreads @ 2.50
#ShortStrangles #Earnings – Thanks @thomberg1201 for the idea.
Sold SPLK MAR 13 2020 130.0/172.5 Strangle @ 3.00
#shortputs #shortstrangles AAL AMD OXY
AAL sold April 17, 15 put for 1.13
OXY sold April 17, 30 put for 1.47
AMD sold April 17, 40/57.50 strangle for 2.99
Soon to be #CoveredCalls – Time to begin the aggressive call selling since stock assignment looks pretty sure now. A little early on these. Will roll to next week if needed but want the downside protection.
Sold UVXY MAR 6 2020 21.5 Calls @ 2.60
Yesterday on the spike:
Sold UVXY MAR 13 2020 22.0 Call @ 5.30
There is still a chance UVXY could rally and the 26.5 short puts don’t get exercised. To protect the calls I’ve only rolled in half my puts. I’ll roll the other half Friday at the close if needed to get stock.
#Earnings $SPLK reports tonight. Below are details on earnings one-day moves over the last 12 quarters.
Nov. 21, 2019 AC +10.76%
Aug. 21, 2019 AC -7.83% Biggest DOWN
May 23, 2019 AC -7.32%
Feb. 28, 2019 AC -0.90%
Nov. 29, 2018 AC +9.93%
Aug. 23, 2018 AC +14.81%
May 24, 2018 AC -5.20%
March 1, 2018 AC +9.26%
Nov. 16, 2017 AC +17.89% Biggest UP
Aug. 24, 2017 AC +8.47%
May 25, 2017 AC -6.97%
Feb. 23, 2017 AC -3.23%
Avg (+ or -) 8.55%
Bias 3.31%, positive bias on earnings.
With stock at 150.00 the data suggests these ranges:
Based on current IV (expected move into Friday per TOS): 135.06 to 164.94
Based on AVERAGE one-day move over last 12 quarters: 137.18 to 162.82
Based on MAXIMUM one-day move over last 12 Q’s (17.9%): 123.17 to 176.84
Based on UP max only (-7.8%): 138.26
Open to requests for other symbols.
#SPX1dte At 12:58 Pacific Time, sold $SPX March 4th 2830/2850-3140/3160 condors for 2.05. IV: 47.73%, SPX 3000, deltas: -.07, +.05
BTC the March 20, 115 calls at .07 cents. Sold at 1.13
#ShortPuts – I don’t see the volatility going away any time soon. I rolled these out too soon so bringing them back in to either get lucky getting rid of them or taking stock and aggressively selling calls against it.
Rolled UVXY JUN 19 2020 19.0 Puts to UVXY MAR 6 2020 26.5 Puts @ .30 debit
Sold UVXY MAR 6 2020 35.0 Calls @ .32
Covers the cost of the roll and preserves the original premium in the put sales.
High Fidelity: from page, to film, to Hulu / John Cusack Top 5 / Parasite picked / Rock’n’Roll Hall of Fame inductees / New music picks / Old music pick / New picks from an old chick — Go to https://thepickcast.com for playlists and more info.
#BearCallSpreads – Adding…
Sold UVXY JAN 15 2021 30.0/40.0 Bear Call Spreads @ 1.85
BTC March 6, 110 calls at .02 cents, sold at .85
#ShortPuts – Adding a couple…
Sold SPCE MAR 20 2020 20.0 Puts @ 1.05
#ShortPuts – Let’s see if we re-test the lows next week…
Sold SPY MAR 20 2020 285.0 Put @ 3.05
#shortputs #closing DAL
bought April 20, 40 put for 1.13, sold February 28 for 2.12.
Thanks 330nick for the idea
TLRY STO 3/6/20 15.0 CALLS @.40
#Earnings $DLTR reports tomorrow morning. Below are details on earnings one-day moves over the last 12 quarters.
Nov. 26, 2019 BO -15.24% Biggest DOWN
Aug. 29, 2019 BO -1.93%
May 30, 2019 BO +3.13%
March 6, 2019 BO +5.11%
Nov. 29, 2018 BO +6.13% Biggest UP
Aug. 30, 2018 BO -15.54%
May 31, 2018 BO -14.28%
March 7, 2018 BO -14.47%
Nov. 21, 2017 BO +2.41%
Aug. 24, 2017 BO +5.62%
May 25, 2017 BO +0.92%
March 1, 2017 BO +0.20%
Avg (+ or -) 7.08%
Bias -3.16%, negative bias on earnings.
With stock at 83.00 the data suggests these ranges:
Based on current IV (expected move into Friday per TOS): 76.44 to 89.56
Based on AVERAGE one-day move over last 12 quarters: 77.12 to 88.88
Based on MAXIMUM one-day move over last 12 Q’s (15.5%): 70.10 to 95.90
Based on UP max only (+6.1%): 88.09
Open to requests for other symbols.
Maybe some calls sales today.
Since last week has been called the worst week since 2008, I thought I would compare the charts from the two.
The first comparison is between the two weeks with the bars on each scaled to match SPX point moves (not percentage). 2008 is on the left, 2020 on the right:
The second resizes the 2020 week so that the scales match on a percentage basis. 2020 is on the left, 2008 on the right:

As you can see, the moves in 2008 were bigger on a percentage basis, while last week was bigger on a point basis.
In 2008, the first huge up day was nowhere near the bottom, which didn’t happen for another five months.
#CoveredCalls – One small roll still playing with the super short term expirations. Picking up 1.35 of upside for two more days.
Rolled SPY MAR 02 2020 290.0 Call to MAR 04 2020 291.0 Call @ .35 credit.
VIX is down 8, but /VX is unchanged.
Is that because of the backwardation?
#SPX1dte Expiring: $SPX March 2nd 2600/2625-3100/3125 condors, sold Friday for 2.05.
With this thing now back out of the money but showing strength, I rolled 3/20 186 calls out to 4/17 200 calls @ 4.90 credit. Buys me some breathing room (another 14 points out of the money plus the premium) but the way this thing moves I think I’m going to need a multi-day rally in oil to get an acceptable score on the dismount.
#Earnings $TGT reports tomorrow morning. Below are details on earnings one-day moves over the last 12 quarters.
Nov. 20, 2019 BO +14.05%
Aug. 21, 2019 BO +20.42% Biggest UP
May 22, 2019 BO +7.78%
March 5, 2019 BO +4.58%
Nov. 20, 2018 BO -11.26%
Aug. 22, 2018 BO +3.20%
May 23, 2018 BO -5.69%
March 6, 2018 BO -4.45%
Nov. 15, 2017 BO -9.86%
Aug. 16, 2017 BO +3.60%
May 17, 2017 BO +0.93%
Feb. 28, 2017 BO -12.16% Biggest DOWN
Avg (+ or -) 8.17%
Bias 0.93%, positive bias on earnings.
With stock at 107.50 the data suggests these ranges:
Based on current IV (expected move into Friday per TOS): 99.01 to 115.99
Based on AVERAGE one-day move over last 12 quarters: 98.72 to 116.28
Based on MAXIMUM one-day move over last 12 Q’s (20.4%): 85.55 to 129.45
Based on DOWN max only (-12.2%): 94.43
NOTE: Five-day MAX moves are +21.00% and -13.39%
Open to requests for other symbols.
#earnings TGT
Sold March 20 95/120 strangle for 2.51.
#shortputspread DIS
Sold April 17, 100/110 put spread for 1.57.
#Earnings $KSS reports tomorrow morning. Below are details on earnings one-day moves over the last 12 quarters.
Nov. 19, 2019 BO -19.48% Biggest DOWN
Aug. 20, 2019 BO -6.88%
May 21, 2019 BO -12.33%
March 5, 2019 BO +7.31% Biggest UP
Nov. 20, 2018 BO -9.22%
Aug. 21, 2018 BO +1.71%
May 22, 2018 BO -7.42%
March 1, 2018 BO -5.05%
Nov. 9, 2017 BO +0.93%
Aug. 10, 2017 BO -5.79%
May 11, 2017 BO -7.83%
Feb. 23, 2017 BO -2.08%
Avg (+ or -) 7.17%
Bias -5.51%, strong negative bias on earnings.
With stock at 38.00 the data suggests these ranges:
Based on current IV (expected move into Friday per TOS): 34.63 to 41.37
Based on AVERAGE one-day move over last 12 quarters: 35.28 to 40.72
Based on MAXIMUM one-day move over last 12 Q’s (19.5%): 30.60 to 45.40
Based on UP max only (+7.3%): 40.78
NOTE: Five-day MAX moves are +4.81% and -19.52%
Open to requests for other symbols.
Sold $FB 4/17 180/170 bull put spread for 1.95 with the stock between 193-194. Short strike below Friday’s low, at 27 delta.
#Earnings $AZO reports tomorrow morning. Below are details on earnings one-day moves over the last 12 quarters.
Dec. 10, 2019 BO +6.92% Biggest UP
Sept. 24, 2019 BO -4.41%
May 21, 2019 BO +5.56%
Feb. 26, 2019 BO +5.10%
Dec. 4, 2018 BO +6.74%
Sept. 18, 2018 BO -1.97%
May 22, 2018 BO -9.48%
Feb. 27, 2018 BO -11.06%
Dec. 5, 2017 BO +0.42%
Sept. 19, 2017 BO -5.00%
May 23, 2017 BO -11.84% Biggest DOWN
Feb. 28, 2017 BO -0.58%
Avg (+ or -) 5.76%
Bias -1.63%, negative bias on earnings.
With stock at 1030.00 the data suggests these ranges:
Based on current IV (expected move into Friday per TOS): 951.27 to 1108.73
Based on AVERAGE one-day move over last 12 quarters: 970.71 to 1089.29
Based on MAXIMUM one-day move over last 12 Q’s (11.8%): 908.05 to 1151.95
Based on UP max only (+6.9%): 1101.28
NOTE: Five-day MAX moves are +7.60% and -9.93%
Open to requests for other symbols.
I know it’s a lot of bluster and some bullshit but he got this move right. If you want to skip that and go straight to his outlook start at 8:50 mark. Interesting take on what some worse case scenarios could be…
