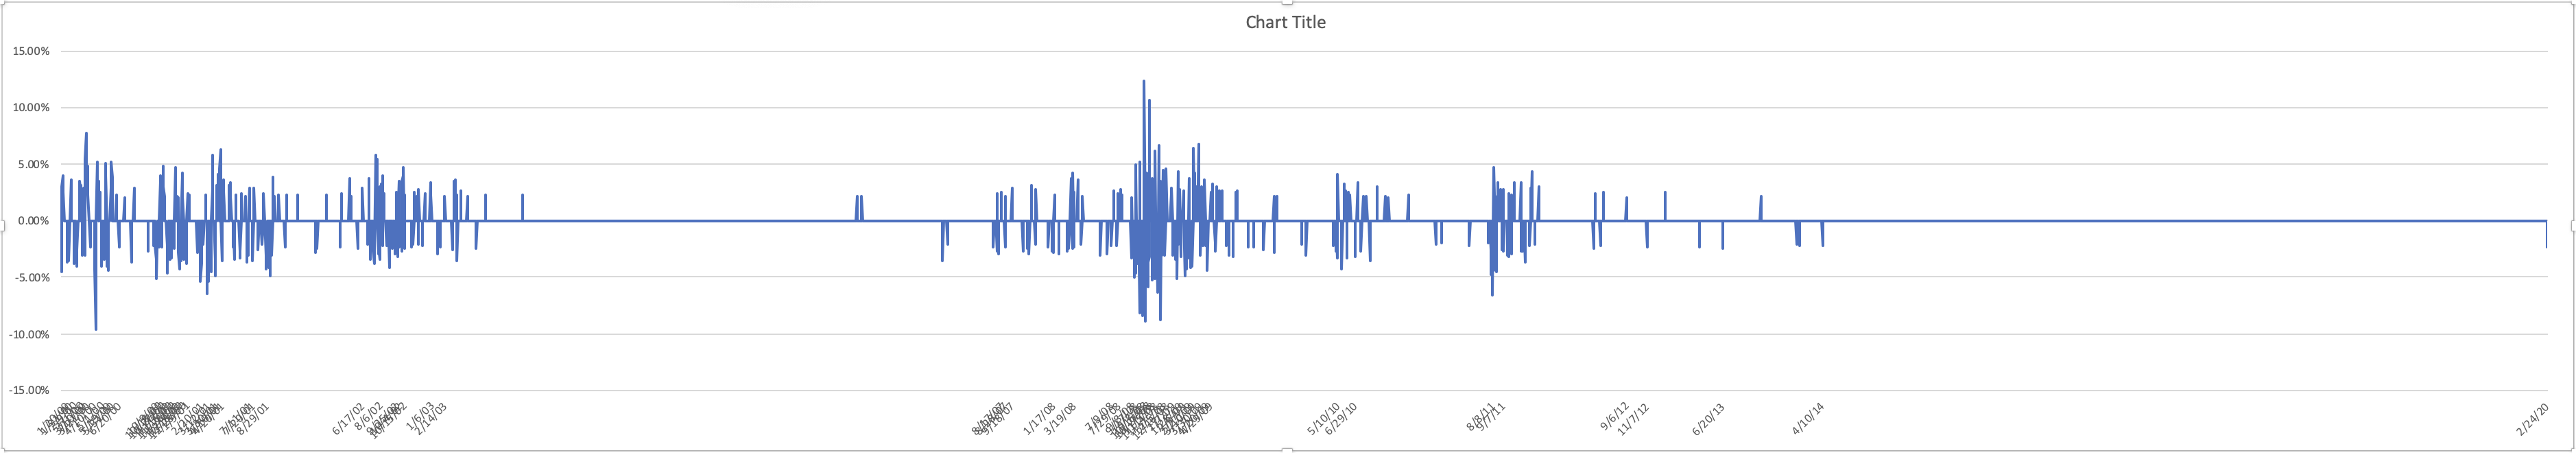
Following up to my Post yesterday, here is a chart of all SPX gap opens that were plus or minus 2% or greater since 1/1/2000. Click the chart for a larger view.
On the left is 1/3/2000, and on the right is yesterday, 2/24/20. The cluster near the middle is the 2008 crash. As you can see, a very long gap between 2014 and now.