

STC on GTC order…FEB 1 325/327.5 BuCS @2.36…BTO 1/18 @ 1.90
#supercharger
Recent Updates Page 284

SVXY
https://www.bgandg.com/svxy-complaint

EXAS STO Puts / SPX 1 DTE Expired
#shortputs
$EXAS STO 2/1 82 put at .60
#spx1dte
$SPX STO 1/30 2565/2585/2705/2685 IC for 1.10 Bought it this morning and my nails are still on my fingers as it expired worthless. Thank you @jeffcp66

#SVXY
Hi all
For those affect by #SVXY# last year, I was contacted by an attorney in NYC who is filing a class action suit. If interested, here’s his contact info:
P 212.697.6484 M 917‑750‑9429 F 212.697.7296
E eitank@bgandg.com W http://www.bgandg.com/

SPX 1-dte trades
#SPX1dte Sold $SPX Jan 31st 2615/2635-2735/2755 iron condors for 1.00. (IV 16%)
I hated doing this because I feel the rally today is a headfake, but I cannot fight the tape any higher than this.
Bought to close $SPX Feb 14th 2730/2750 call spreads for 5.75. Sold in a #CondorRoll on Jan 4th.
#CondorRoll Sold to Open Feb 14th 2600/2620/2760/2780 condors for 6.05.

Theotrade VIX hedge…
#Hedges -From last weekend’s freebie. Go to the 10:30 mark to see his VIX hedge. Basically sell puts to finance bull call spreads. Could be getting close to time again…
https://theotrade.com/clouded-market-clarity-provides-these-trade-setups/

Jumping back into NUGT
Sold $NUGT Jun 21 35 calls @ 1.01. Highest strike in June.

SPY
Did one of DK’s Back Ratio’s on 1-28
-1 267/+2 271 for .26 cr starting to be profitable
Iceman classic…

SPX
Closed last of SPX Butterfly’s opened 12-31 2625/2650/2675 for 1.35, closed 1 on 1-24 $2.25 just closed rest $2.25
Not sure where we are going, had a nice profit. Did not want it to run right past limits.

#earnings MSFT X TastyTrade ideas…
#earnings MSFT X
TastyTrade ideas
X sold March 15, 22 straddle for 3.11
MSFT sold March 15, 95/115 strangle for 1.89
Thank you for the earnings data Jeff.
TQQQ calls
#LongLEAPs #SyntheticCoveredCalls
Filled on the Fed spike: Sold $TQQQ Feb 15th 44 calls for 2.45

#rolling, adjustments, and new trades…
#rolling, adjustments, and new trades
#fuzzy
MU rolled the 35/35 out 16 DTE for 0.5 credit. Cb now 14.30
WDC 40/40 rolled out 9 DTE for 0.33 credit. Cb now 17.71
I was going to close these at a loss but figure if I can get at least 0.25 per roll will keep rolling to generate cash and lower cost basis. 10 contracts each so decent income.
#pietrades
SQ STO the 9 DTE Feb 8-9 68 put for 1.53. Decided not to jade lizard until after FOMC and see what the market does. If we gap up I will sell the CCS once it has a top or range.
FOMC must have just released up 10 more on /ES. I may #jadelizard SQ into the close if it slows down to the upside.
After 4-5 months of crap trading, finally making some income/cash and money again but I still have a long way to go to recover the SVXY fiasco.

Closed Jan30 SPX 1dte IC early
Closed for .20. Sold for .55 x 6. Total profit $210
#spx1-dte
SPX 1-dte closing
#SPX1dte bought to close $SPX Jan 30th 2685 calls for .85. Condors sold for 1.00 yesterday. Could not hold through the FOMC release that comes out in 40 minutes. I don’t expect a move like last time, when we exploded higher, but can’t risk it. Also sold a couple the long 2705 calls for .05, and will try to sell them all to reduce cost of the exit. Allowing puts to expire.
Don’t know whether I’ll buy or sell the condor for Jan 31st expiration yet!
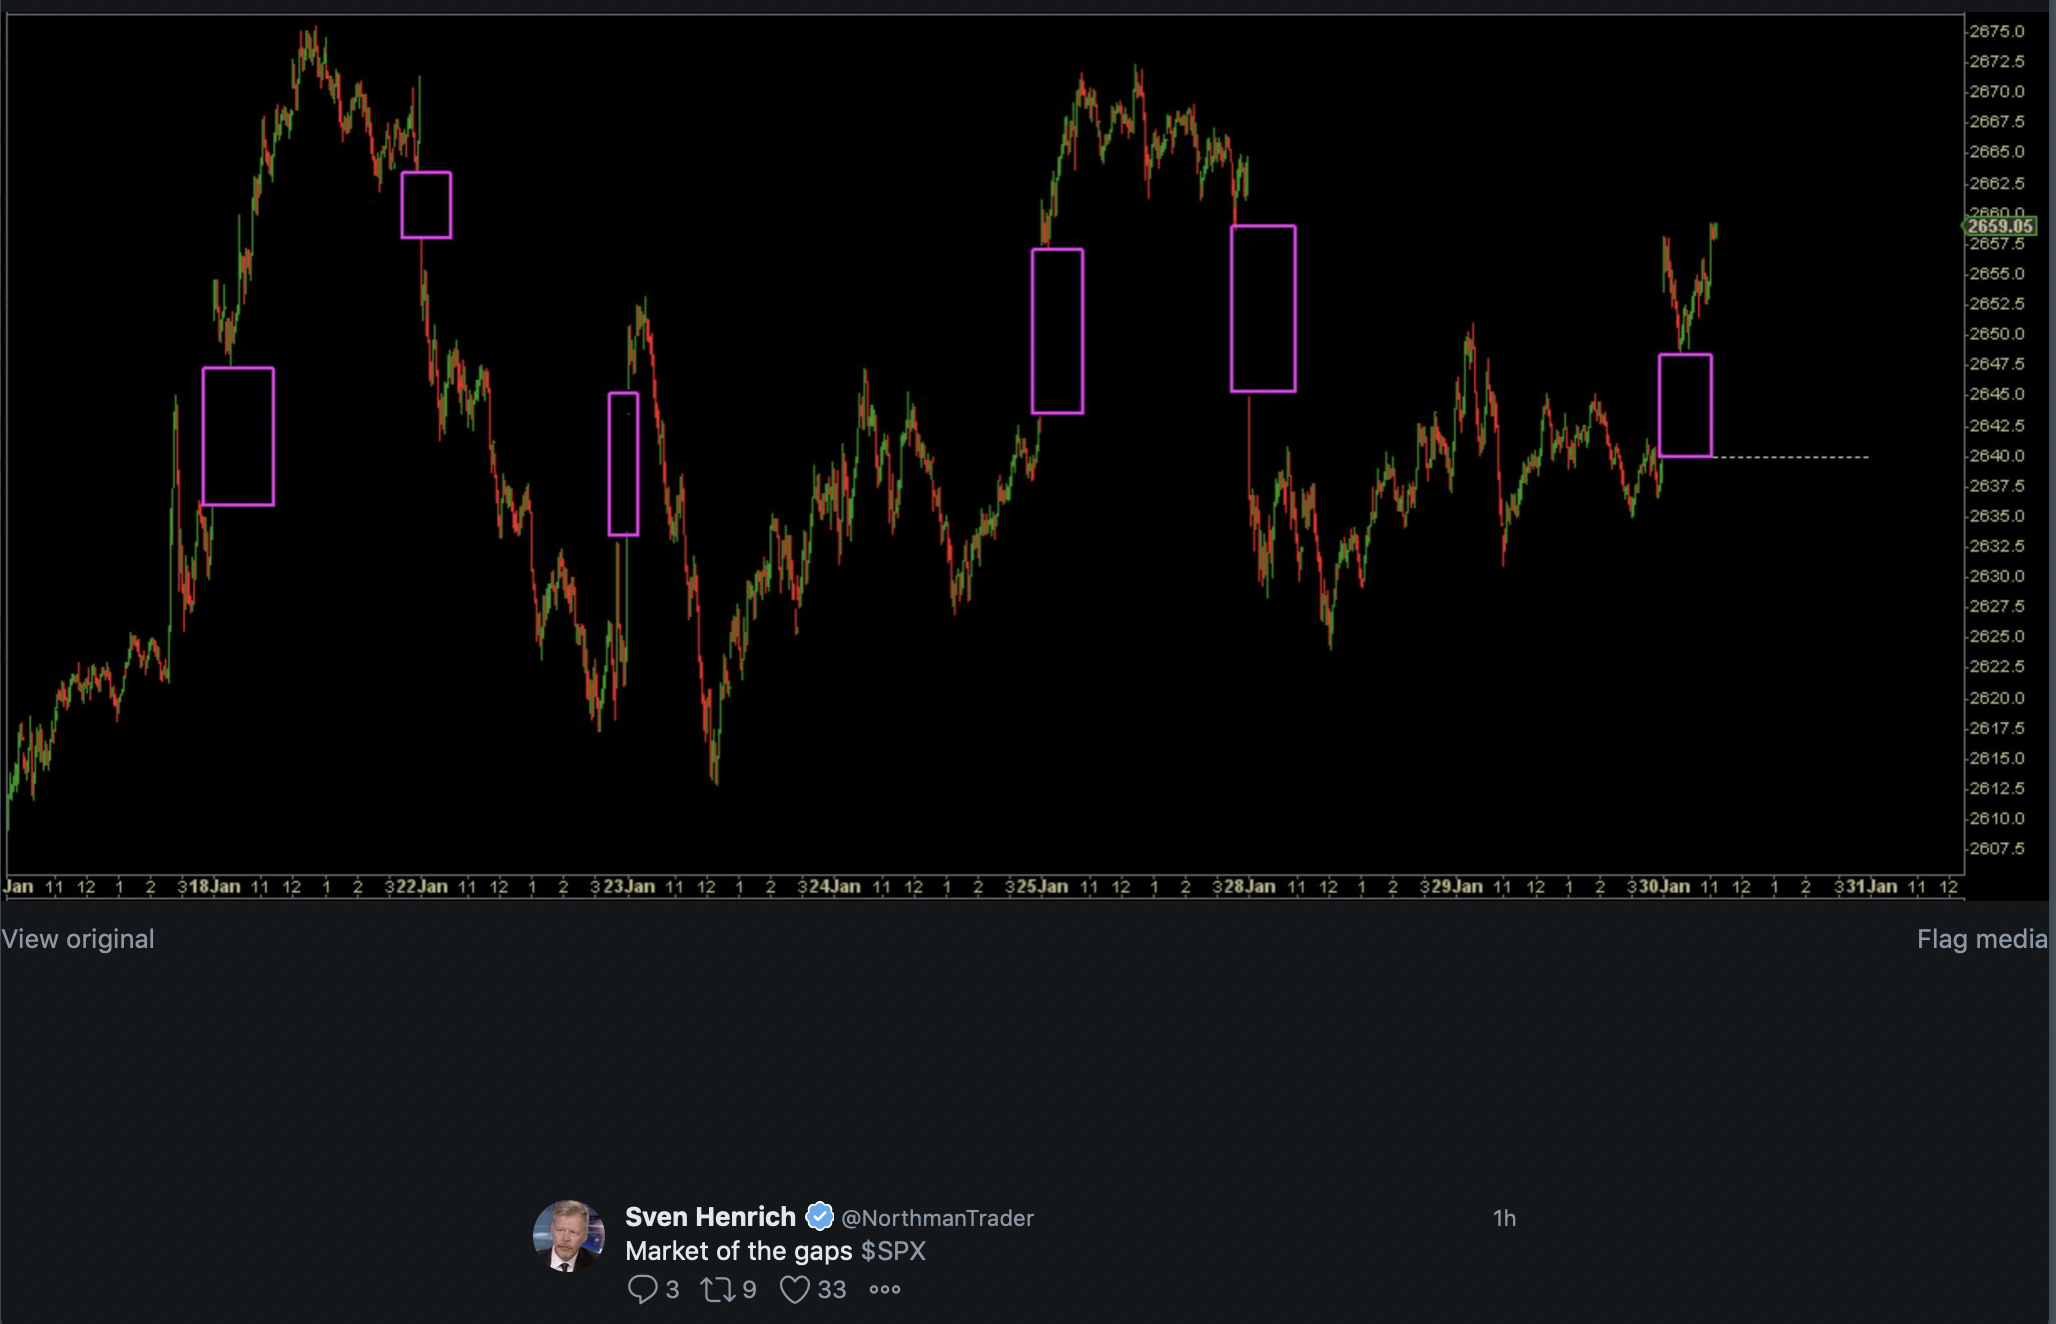
SPX — Market of the Gaps
MSFT earnings analysis
#Earnings $MSFT reports tonight. Below are details on earnings one-day moves over the last 12 quarters.
Oct. 24, 2018 AC +5.84%
July 19, 2018 AC +1.79%
April 26, 2018 AC +1.65%
Jan. 31, 2018 AC -0.78%
Oct. 26, 2017 AC +6.41% Biggest UP
July 20, 2017 AC -0.57%
April 27, 2017 AC +0.27%
Jan. 26, 2017 AC +2.34%
Oct. 20, 2016 AC +4.20%
July 19, 2016 AC +5.31%
April 21, 2016 AC -7.17% Biggest DOWN
Jan. 28, 2016 AC +5.82%
Avg (+ or -) 3.51%
Bias 2.09%, strong positive bias on earnings.
With stock at 105.90 the data suggests these ranges:
Based on current IV (expected move into Friday per TOS): 101.22 to 110.58
Based on AVERAGE move over last 12 quarters: 102.18 to 109.62
Based on MAXIMUM move over last 12 Q’s (7.2%): 98.31 to 113.49
Open for requests on other symbols.
NOW iron butterfly
Sold to open $NOW Feb 1st 185/190/195 iron butterflys for 4.35. Max risk .65. As I reported below, this one has been more of a minor mover in recent years, so seeing if it can maintain its calm. If not, max loss is tolerable.
Long Straddles
#LongStraddle #Earnings
Sold to Close final batch of $GLW Feb 1st 30 calls for 3.27. Netted about 60% profit (bought for 1.92 on Monday).
Sold to close some of the $EBAY Feb 1st 33.5 puts for .61. Straddles bought yesterday for 2.23. This one will be tough to breakeven, unless we get a rally over next couple days.
#shortstrangles #closing SQ January 4…
January 4 sold a Feb. 15, 45/75 strangle for 1.48. SQ was close to 78 recently, bought the strangle today for 1.28, happy after the run-up.
CRUS earnings analysis
#Earnings $CRUS reports tomorrow morning. Below are details on earnings one-day moves over the last 12 quarters.
Nov. 1, 2018 AC +3.10%
Aug. 1, 2018 AC -7.01%
May 2, 2018 AC -1.53%
Feb. 5, 2018 AC -3.31%
Nov. 2, 2017 AC -0.42%
Aug. 2, 2017 AC -6.89%
May 3, 2017 AC +0.10%
Feb. 1, 2017 AC -14.00% Biggest DOWN
Oct. 27, 2016 AC +6.85%
July 27, 2016 AC +19.27% Biggest UP
April 26, 2016 AC +12.38%
Jan. 27, 2016 AC +16.38%
Avg (+ or -) 7.60%
Bias 2.08%, positive bias on earnings.
With stock at 38.00 the data suggests these ranges:
Based on current IV (expected move into Friday per TOS): 35.03 to 40.97
Based on AVERAGE move over last 12 quarters: 35.11 to 40.89
Based on MAXIMUM move over last 12 Q’s (19.3%): 30.68 to 45.32
Open for requests on other symbols.
Covered Calls
#CoveredCalls #LongStock Sold to Open $PVTL Feb 15th 18 calls for .75
NOW earnings analysis
#Earnings $NOW reports tonight. Below are details on earnings one-day moves over the last 12 quarters.
Oct. 24, 2018 AC +1.42%
July 25, 2018 AC +4.60%
April 25, 2018 AC +4.53%
Jan. 31, 2018 AC +2.64%
Oct. 25, 2017 AC +1.21%
July 26, 2017 AC +0.74%
April 26, 2017 AC +3.75%
Jan. 25, 2017 AC +3.61%
Oct. 26, 2016 AC +7.68%
July 27, 2016 AC +4.65%
April 20, 2016 AC +14.06% Biggest UP
Jan. 27, 2016 AC -15.65% Biggest DOWN (the only DOWN)
Avg (+ or -) 5.38%
Bias 2.77%, strong positive bias on earnings.
With stock at 189.90 the data suggests these ranges:
Based on current IV (expected move into Friday per TOS): 117.65 to 202.15
Based on AVERAGE move over last 12 quarters: 179.69 to 200.11
Based on MAXIMUM move over last 12 Q’s (15.7%): 160.18 to 219.62
Open for requests on other symbols.
WYNN earnings analysis
#Earnings $WYNN reports tonight. Below are details on earnings one-day moves over the last 12 quarters.
Nov. 7, 2018 AC -13.13% Biggest DOWN
Aug. 1, 2018 AC -6.53%
April 24, 2018 AC -3.74%
Jan. 22, 2018 BO +8.67%
Oct. 26, 2017 AC -1.50%
July 25, 2017 AC -5.02%
April 25, 2017 AC +5.89%
Jan. 26, 2017 AC +7.93%
Nov. 2, 2016 AC -9.31%
July 28, 2016 AC -6.41%
May 5, 2016 AC +1.77%
Feb. 11, 2016 AC +15.83% Biggest UP
Avg (+ or -) 7.14%
Bias -0.46%, slight negative bias on earnings.
With stock at 117.50 the data suggests these ranges:
Based on current IV (expected move into Friday per TOS): 109.04 to 125.96
Based on AVERAGE move over last 12 quarters: 109.11 to 125.89
Based on MAXIMUM move over last 12 Q’s (15.8%): 98.90 to 136.10
Open for requests on other symbols.
TUP getting hammered
Sold $TUP Jul 19 22.50 puts @ 1.20 with the stock at 27.87
#FallingKnife
FB earnings analysis
#Earnings $FB reports tonight. Below are details on earnings one-day moves over the last 12 quarters.
Oct. 30, 2018 AC +3.80%
July 25, 2018 AC -18.96% Biggest DOWN
April 25, 2018 AC +9.06%
Jan. 31, 2018 AC +3.31%
Nov. 1, 2017 AC -2.04%
July 26, 2017 AC +2.91%
May 3, 2017 AC -0.62%
Feb. 1, 2017 AC -1.79%
Nov. 2, 2016 AC -5.63%
July 27, 2016 AC +1.34%
April 27, 2016 AC +7.19%
Jan. 27, 2016 AC +15.52% Biggest UP
Avg (+ or -) 6.01%
Bias 1.17%, positive bias on earnings.
With stock at 146.00 the data suggests these ranges:
Based on current IV (expected move into Friday per TOS): 136.11 to 155.89
Based on AVERAGE move over last 12 quarters: 137.22 to 154.78
Based on MAXIMUM move over last 12 Q’s (19.0%): 118.32 to 173.68
Open for requests on other symbols.
SPY 21dte ladder
Sold SPY Feb20 274/276 ccs @ .26 x 2. SPY 21dte ladder strat. Will sell pcs on reversal.
Sold SPY Feb20 254/252 pcs @ .20 x2 to complete the IC.
#spycraft
SPX 1-dte IC
Sold SPX Jan30 2710/2715 ccs @ .25 x 6 across two accounts. Will add pcs on reversal.
Sold SPX Jan30 2600/2595 pcs @ .25 x6 across two accounts to complete the IC
Sold 3 more Jan31 2710/2715 ccs @ .75 after fed announcement. This is based on the usual reversal after a spike on the announcement.
#spx1-dte
Events Wednesday
#Market Reminders for tomorrow:
GDP numbers at 8:30am ET
FOMC Meeting Announcement at 2pm ET
SPX 1-dte, short
#SPX1dte Sold to Open $SPX Jan 30th 2565/2585/2685/2705 iron condors for 1.00
I switched back to selling because IV on this chain is over 16% and HV dipped below IV.
#earnings #ironcondor BA Sold Feb….
Sold Feb. 15, 335/340/390/395 IC for 1.31
EBAY earnings trade & analysis
#Earnings $EBAY reports tonight. Below are details on earnings one-day moves over the last 12 quarters.
Bought $EBAY Feb 1st 33.5 straddle for 2.23.
Oct. 30, 2018 AC +5.87%
July 18, 2018 AC -10.11%
April 25, 2018 AC -5.58%
Jan. 31, 2018 AC +13.82% Biggest UP
Oct. 18, 2017 AC -1.79%
July 20, 2017 AC -1.53%
April 19, 2017 AC -3.92%
Jan. 25, 2017 AC +4.99%
Oct. 19, 2016 AC -10.76%
July 20, 2016 AC +10.89%
April 26, 2016 AC +3.18%
Jan. 27, 2016 AC -12.45% Biggest DOWN
Avg (+ or -) 7.07%
Bias -0.62%, slight negative bias on earnings.
With stock at 33.60 the data suggests these ranges:
Based on current IV (expected move into Friday per TOS): 31.39 to 35.81
Based on AVERAGE move over last 12 quarters: 31.46 to 36.24
Based on MAXIMUM move over last 12 Q’s (13.8%): 29.17 to 38.53
Open for requests on other symbols.
BA earnings trade
#Earnings Sold to Open $BA Feb 1st 345/350/380/385 #IronCondor for 1.78. About 3.8% on downside and 4.5% on upside.
SPX weeklies question
Does anyone know why SPX has an extra weekly expiration this week? There are options expiring Mon, Wed, Thurs, and Fri. That happens sometimes with monthly expiration but not usually at EOM.
#shortstrangles MU TastyTrade idea sold…
TastyTrade idea sold March 15, 33/42 strangle for 1.92
BA earnings analysis
#Earnings $BA reports tomorrow morning. Below are details on earnings one-day moves over the last 12 quarters.
Oct. 24, 2018 BO +1.31%
July 25, 2018 BO -0.65%
April 25, 2018 BO +4.19%
Jan. 31, 2018 BO +4.93%
Oct. 25, 2017 BO -2.84%
July 26, 2017 BO +9.87% Biggest UP
April 26, 2017 BO -0.98%
Jan. 25, 2017 BO +4.24%
Oct. 26, 2016 BO +4.68%
July 27, 2016 BO +0.82%
April 27, 2016 BO +2.88%
Jan. 27, 2016 BO -8.92% Biggest DOWN
Avg (+ or -) 3.86%
Bias 1.63%, positive bias on earnings.
With stock at 365.50 the data suggests these ranges:
Based on current IV (expected move into Friday per TOS): 350.40 t0 380.60
Based on AVERAGE move over last 12 quarters: 351.39 to 379.61
Based on MAXIMUM move over last 12 Q’s (9.9%): 329.43 to 401.57
Open for requests on other symbols.
ADVANCE on TSLA
#Earnings $TSLA reports Wednesday night. Below are details on earnings one-day moves over the last 12 quarters.
Oct. 24, 2018 AC +9.13%
Aug. 1, 2018 AC +16.18% Biggest UP
May 2, 2018 AC -5.54%
Feb. 7, 2018 AC -8.62% Biggest DOWN
Nov. 1, 2017 AC -6.79%
Aug. 2, 2017 AC +6.50%
May 3, 2017 AC -5.00%
Feb. 22, 2017 AC -6.40%
Oct. 26, 2016 AC +0.87%
Aug. 3, 2016 AC +2.13%
May 4, 2016 AC -4.95%
Feb. 10, 2016 AC +4.73%
Avg (+ or -) 6.40%
Bias 0.19%, no significant directional bias on earnings.
With stock at 295.00 the data suggests these ranges:
Based on current IV (expected move into Friday per TOS): 263.33 to 326.67
Based on AVERAGE move over last 12 quarters: 276.11 to 313.89
Based on MAXIMUM move over last 12 Q’s (16.2%): 247.27 to 342.73
Open for requests on other symbols.
SPY 21dte ladder
Sold SPY Feb19 IC 274/276/250/248 @ .42 x2. Now have four of six max layers in the ladder. All ICs look fine at this point.
#spycraft
SPX 1dte
#spx1dte Sold SPX Jan30 1dte IC 2690/2695/2590/2585 @ .55 x6 across two accounts. Keeping trade size smaller for a while to recover from over-defending these trades.
AMD earnings analysis
#Earnings $AMD reports tonight. Below are details on earnings THREE-day moves over the last 12 quarters.
***NOTE: These are 3-day moves, since options traded for earnings will expire on Friday. These moves are bigger than 1-day moves. This stock can move BIG.
Wed 10/24/2018 AC -22.64%
Wed 07/25/2018 AC +18.01%
Wed 04/25/2018 AC +14.42%
Tue 01/30/2018 AC -3.26%
Tue 10/24/2017 AC -16.91%
Tue 07/25/2017 AC -1.13%
Mon 05/01/2017 AC -25.84% Biggest DOWN
Tue 01/31/2017 AC +18.03%
Thu 10/20/2016 AC -6.32%
Thu 07/21/2016 AC +11.87%
Thu 04/21/2016 AC +52.29% Biggest UP
Tue 01/19/2016 AC +3.58%
Avg (+ or -) 16.19%
Bias 3.51%, positive bias on earnings.
With stock at 19.60 the data suggests these ranges:
Based on current IV (expected move into Friday per TOS): 17.19 to 22.01
Based on AVERAGE move over last 12 quarters: 16.43 to 22.77
Based on MAXIMUM move over last 12 Q’s (52.3%): 9.35 to 29.85
Open for requests on other symbols.
GLW mostly closed
#Earnings #LongStraddle Sold to close $GLW Feb 1st 30 calls for 3.10. Straddles bought for 1.92 yesterday. I closed two-thirds of my position. Holding the rest for potentially higher prices into Friday.
BABA earnings analysis
#Earnings $BABA reports tomorrow morning. Below are details on earnings one-day moves over the last 12 quarters.
***NOTE: One-day moves are listed, but I included the extremes for 3-day moves as well. As you can see, big moves were followed by continuation for the three days following earnings.
*****NOTE #2: the EXPECTED move (per TOS) is higher than the Maximum 1-day historical moves. A bigger than usual move is expected, which could just mean options are overpriced. Note, however, that the three-day moves exceed the expected.
Nov. 2, 2018 BO -2.41%
Aug. 23, 2018 BO -3.15%
May 4, 2018 BO +3.52%
Feb. 1, 2018 BO -5.90% Biggest DOWN — 3-day = -8.31%
Nov. 2, 2017 BO -0.68%
Aug. 17, 2017 BO +2.77%
May 18, 2017 BO +0.45%
Jan. 24, 2017 BO +3.06%
Nov. 2, 2016 BO -2.60%
Aug. 11, 2016 BO +5.08% Biggest UP — 3-day = +12.5%
May 5, 2016 BO +3.96%
Jan. 28, 2016 BO -3.76%
Avg (+ or -) 3.11%
Bias 0.03%, no directional bias on earnings.
With stock at 157.00 the data suggests these ranges:
Based on current IV (expected move into Friday per TOS): 146.67 to 167.33
Based on AVERAGE move over last 12 quarters: 152.11 to 161.89
Based on MAXIMUM move over last 12 Q’s (5.9%): 147.74 to 166.26
Open for requests on other symbols.
AAPL earnings analysis
#Earnings $AAPL reports tonight. Below are details on earnings THREE-day moves over the last 12 quarters.
***NOTE: These are 3-day moves, since options traded for earnings will expire on Friday. These moves are slightly bigger than 1-day moves.
Thu 11/01/2018 AC -6.63%
Tue 07/31/2018 AC +9.30% Biggest UP
Tue 05/01/2018 AC +8.71%
Thu 02/01/2018 AC -4.34%
Thu 11/02/2017 AC +2.61%
Tue 08/01/2017 AC +4.22%
Tue 05/02/2017 AC +0.98%
Tue 01/31/2017 AC +6.37%
Tue 10/25/2016 AC -3.83%
Tue 07/26/2016 AC +7.79%
Tue 04/26/2016 AC -10.16% Biggest DOWN
Tue 01/26/2016 AC -2.65%
Avg (+ or -) 5.63%
Bias 1.03%, positive bias on earnings.
With stock at 157.00 the data suggests these ranges:
Based on current IV (expected move into Friday per TOS): 148.24 to 165.76
Based on AVERAGE move over last 12 quarters: 148.16 to 165.84
Based on MAXIMUM move over last 12 Q’s (10.2%): 141.05 to 172.95
Open for requests on other symbols.
Farewell old friend…
But #VXXGame lives on.
The big short volatility edition:
10 year ago $VXX was introduced.
Tomorrow $VXX dies.
Every long died along the way. pic.twitter.com/FZpH7RUbKf— Sven Henrich (@NorthmanTrader) January 29, 2019
$NFLX CC Rolled down / $INTC Double Calendar / $WYNN BUCS
#coveredcalls
$NFLX BTC 2/1 360 calls and STO 2/1 252.50 calls at added .50
#doublecalendar
$INTC STC 2/1 51 put at 4.50 Trade ended up losing only $15 per contract and I tried something new. Thank you @jeffcp66
#bullcallspreads
$WYNN BTO 4/18 115/130 BUCS at 6.25
GLW straddle
#Earnings Bought to open $GLW Feb 1st 30 straddle for 1.92. I only need around the average move on this to be profitable.
#earnings #ironbutterfly GLW Went to…
Went to Feb. 15, sold 125/130/130/135 for 2.13, works if it’s within the averages. Thanks Jeff
SPX closed
#SPX1dte closed last batch for .35. Definitely missed my chances for higher profit, but still another win. It will be interesting to see how this will work on a flat day. It will be a losing trade, but will be able to recoup some of the debit in the morning as put premium is usually still hanging on.
Condors bought Friday for .70. Sold today for 1.20, avg price.
Whiz free week…
If anyone is bored…LOL
https://go.topgunoptions.com/ft
GLW earnings analysis
#Earnings $GLW reports tomorrow morning. Below are details on earnings FIVE-day moves over the last 12 quarters.
***NOTE: These are 5-day moves, since options traded for earnings will expire on Friday.
Tue 10/23/2018 BO -0.45%
Wed 07/25/2018 BO +12.44% Biggest UP
Tue 04/24/2018 BO -0.99%
Tue 01/30/2018 BO -8.68%
Tue 10/24/2017 BO +5.01%
Wed 07/26/2017 BO -8.96%
Tue 04/25/2017 BO +4.83%
Tue 01/24/2017 BO +7.71%
Tue 10/25/2016 BO -5.06%
Wed 07/27/2016 BO +2.34%
Tue 04/26/2016 BO -10.96% Biggest DOWN
Tue 01/26/2016 BO +11.03%
Avg (+ or -) 6.54%
Bias 0.69%, slight positive bias on earnings.
With stock at 30.30 the data suggests these ranges:
Based on current IV (expected move into Friday per TOS): 28.33 to 32.27
Based on AVERAGE move over last 12 quarters: 28.32 to 32.38
Based on MAXIMUM move over last 12 Q’s (12.4%): 26.53 to 34.07
Open for requests on other symbols.
#earnings GLW Jeff-do you have…
#earnings GLW
Jeff-do you have GLW data? Thanks
SPX 1-dte IC defense again
Converted SPX Jan28 2625/2620 put side to Jan28 2630/2625/2620 fly @ 1.55. With credit received on IC, net debit is 1.05 per lot x6. This either locks in a loss or a possible profit if SPX closes between 2625 and 2630. Decision made on breach of 2625 level and then waited for bounce to enter.
Defending every other trade is getting old so will probably stay on sidelines or use long ICs as @jeffcp66 is doing. All depends on the HV/IV ratio on SPX after today.
BIIB earnings analysis
#Earnings $BIIB reports tomorrow morning. Below are details on earnings FIVE-day moves over the last 12 quarters.
***NOTE: These are 5-day moves, since options traded for earnings will expire on Friday.
Tue 10/23/2018 BO -4.87%
Tue 07/24/2018 BO -4.95%
Tue 04/24/2018 BO +6.75%
Thu 01/25/2018 BO +3.46%
Tue 10/24/2017 BO -6.33% Biggest DOWN
Tue 07/25/2017 BO +0.96%
Tue 04/25/2017 BO -2.04%
Thu 01/26/2017 BO +1.03%
Wed 10/26/2016 AC -5.49%
Thu 07/21/2016 BO +9.50% Biggest UP
Thu 04/21/2016 BO +7.13%
Wed 01/27/2016 BO +5.07%
Avg (+ or -) 4.80%
Bias 0.85%, slight positive bias on earnings.
With stock at 333.00 the data suggests these ranges:
Based on current IV (expected move into Friday per TOS): 316.16 to 349.84
Based on AVERAGE move over last 12 quarters: 317.02 to 348.98
Based on MAXIMUM move over last 12 Q’s (9.5%): 301.37 to 364.64
Open for requests on other symbols.
SPX 1-dte long
#SPX1dte Sold a third of the $SPX Jan 28th 2620/2600 put spreads for 2.00. Condors bought for .70 on Friday.
Earnings $WYNN BUCS $OKTA
#earnings
$WYNN STO 2/1 116 puts at 3.90 Earnings 1/30
#bullcallspreads
$OKTA BTO 5/17 75/90 BUCS @6.40 Thank you @jsd501
SPX 1-dte LONG
#SPX1dte Bought to Open $SPX Jan 28th 2600/2620-2700/2720 iron condors for .70.
Filled after bell, Jan28th IV only 8.7%; expected move 18.77. HV still above IV, but dropping. ATR 43.35.
#earnings #rolling LRCX Jan. 23…
INTC dbl calendar conversion
#Earnings #DoubleCalendar #LongStock #Assignment #Dividends
Sold to close $INTC Feb 1st 50 put for 3.20. Will be assigned long stock for 50.00. Add .54 for calendar purchase, subtract 3.20 from put sale, cost basis 47.34.
Will sell calls and hang on to stock for at least one dividend round.
#coveredcallcampaign AAPL Rolled Jan. 25,…
#coveredcallcampaign AAPL
Rolled Jan. 25, 160 call to Feb. 1 for 2.82. My cost basis on these assigned shares is 156.99 and I don’t want them anymore so if AAPL blows through earnings next week I’ll be happy as I have another lot , uncovered at a little higher basis.
SPX 1-dte closed
#SPX1dte Was hoping gov’t reopening might give us a final spike, but the spike was in the wrong direction.
Closed last batch of $SPX call spreads for 1.00. Bought for .70, closed for 1.62 avg price.
#earnings #doublecalendar INTC CL INTC…
#earnings #doublecalendar INTC CL
INTC I rolled the Jan. 25, 50 short put to March 15, 50 for .75, the short call will expire out of the money today. I’ll see what happens with the longs on Monday
CL I have the in the money 60 call and none of them have traded today, including, and especially, my attempts. I’ll take the short shares and see what happens on Monday, otherwise would be a push. I’m new to these types of trades and open to other ideas.
Gov’t Reopen?
Trump scheduled to speak soon, expected to announce a deal to (at least temporarily) re-open government.
SPY 21dte ladder
Sold SPY Feb15 255/253 BuPS @ .20 x2 to start third step of SPY 21dte IC ladder strat. Will add call side before the close.
Sold SPY Feb15 276/278 BeCS @ .24 x2 to complete the IC.
#spycraft
Econ Calendar for week of 1/28/19
BIG WEEK:
*GDP Wednesday at 8:30am ET
*FOMC Meeting Announcement, Wednesday 2pm ET
*January Jobs Report, Friday 8:30am ET
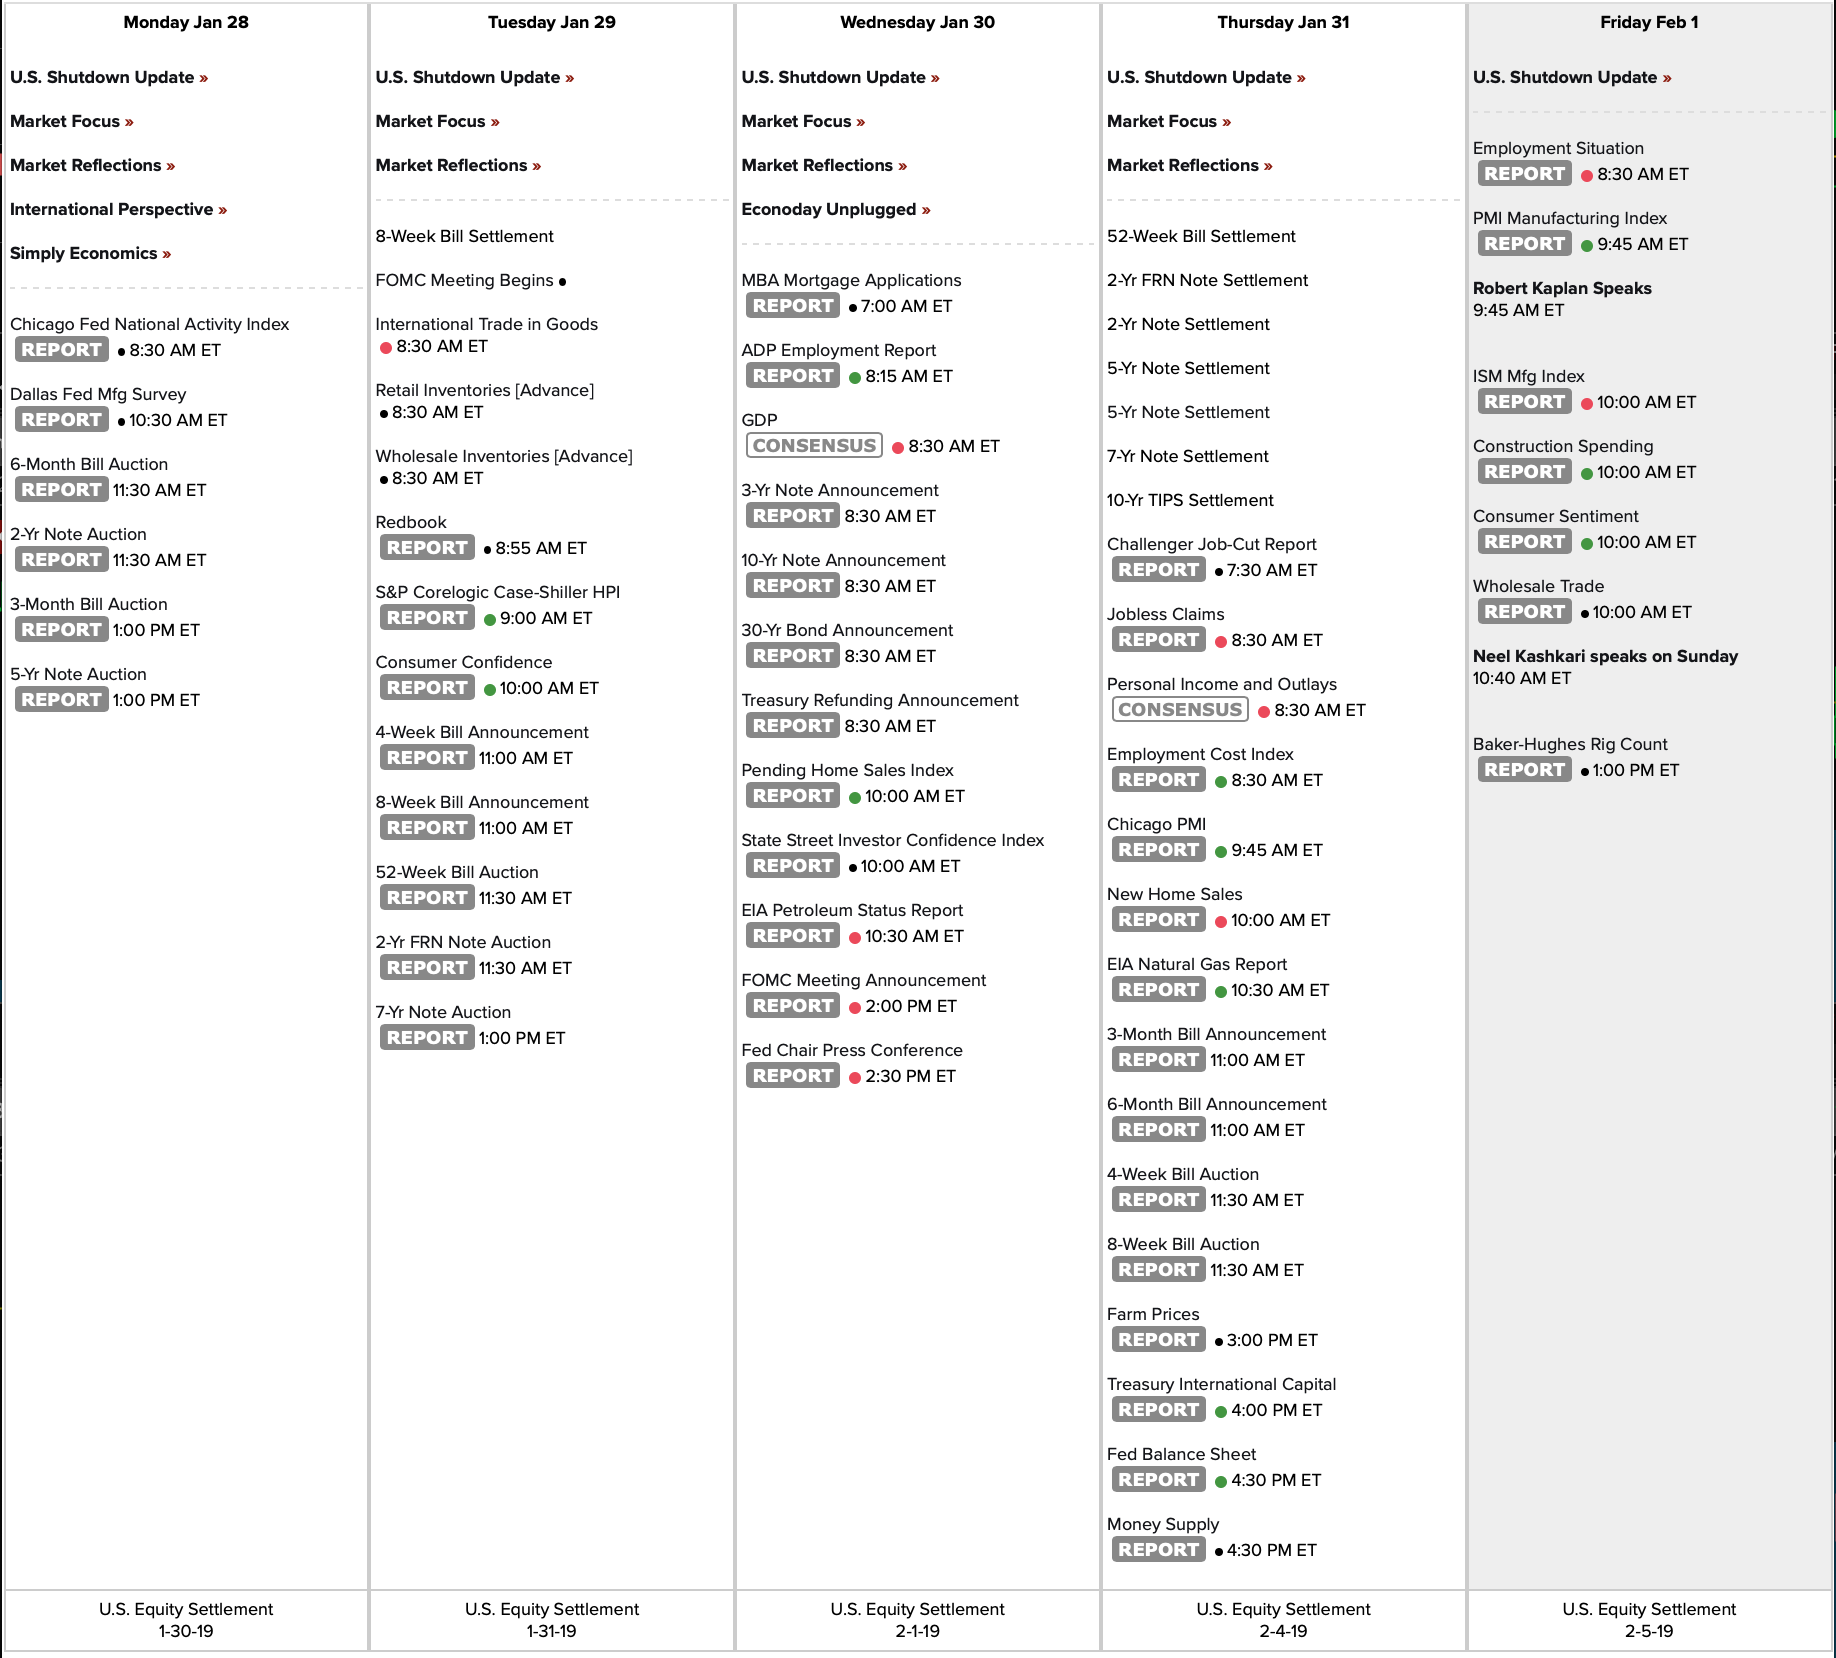

Link to calendar: https://us.econoday.com/byweek.asp?day=28&month=1&year=2019&cust=us&lid=0
SPX 1-dte
Sold SPX Jan28 2625/2620 BuPS @ .25 x6 in two accounts. The ES appears to be finding a new higher range in which to bounce around.:-)
Sold SPX Jan28 2700/2705 @.30 x6 to complete the IC.
#spx1-dte
Upcoming Earnings
#Earnings A few that were added late and just updated on the chart:
ILMN and AMD next Tuesday, Jan 29th, after market.
TSLA next Wednesday, Jan 30th, after market.
CAT earnings analysis
#Earnings $CAT reports Monday morning. Below are details on earnings FIVE-day moves over the last 12 quarters.
***NOTE: These are 5-day moves, since options traded for earnings will expire next Friday.
Tue 10/23/2018 BO -10.61% Biggest DOWN
Mon 07/30/2018 BO -2.82%
Tue 04/24/2018 BO -6.02%
Thu 01/25/2018 BO -3.42%
Tue 10/24/2017 BO +4.66%
Tue 07/25/2017 BO +5.47%
Tue 04/25/2017 BO +5.62%
Thu 01/26/2017 BO -1.38%
Tue 10/25/2016 BO -2.45%
Tue 07/26/2016 BO +5.17%
Fri 04/22/2016 BO -1.28%
Thu 01/28/2016 BO +7.51% Biggest UP
Avg (+ or -) 4.70%
Bias 0.04%, no directional bias on earnings.
With stock at 135.75 the data suggests these ranges:
Based on current IV (expected move into Friday per TOS): 127.97 to 143.53
Based on AVERAGE move over last 12 quarters: 129.37 to 142.13
Based on MAXIMUM move over last 12 Q’s (10.6%): 121.35 to 150.15
Open for requests on other symbols.
SQ rip
#LongLEAPs #SyntheticCoveredCalls
I played this one badly this week. I had rolled last week to ITM Feb 1st 67 calls. I had the chance Tuesday to close for a profit with the pull back all the way down below 68. But I foolishly went by sentiment rather than reality: I thought weakness would continue through the week. That’s what I “thought”. In reality, it was simply a must-exit opportunity. Sold the calls for 5.75… could have exited for less than 3.00.
Now, they’re going for 10.50 as SQ resumes its strong rally.
Lesson learned. When ITM on calls, take any opportunity to exit. Don’t wait for a .30 exit.
#fuzzy WDC 40/40 rolled out…
#fuzzy
WDC 40/40 rolled out 7 DTE for 0.45 credit. cb now 18.04.
#pietrades
AMAT 7 DTE 39 puts sold for 0.71 credit. Cb 38.29 if assigned. Smaller account so only 3 contracts.
Hoping the bottom on the chip sector holds but will roll or take assignment if not, true PIE style.
Holding on further #spycraft at the moment until we figure out the best defense, market is moving more than the options are priced for.
NVDA
#ShortPuts – This is a little bit of a gamble since there are conflicting reports of an earnings date. I think it’ll be the following week so selling this. This would add to a stock position going into earnings with great call premium available…
Sold NVDA Feb 08 2019 145.0 Put @ 2.51

STX
#bearcallspreads
STO Feb 1 2019 42.50/45 BeCS @ 1.10 with stock at 43.30.
Expecting STX to come back down some prior to earnings on Feb 5.
Double Calendars closing
#Earnings #DoubleCalendar
Sold to Close $ETFC Jan25/Feb01 50 dbl cal for .50. Bought for .52 yesterday, so bitty loss.
Will include other closures in comments.
#shortputs SLB January 17, sold…
#shortputs SLB
January 17, sold Feb. 15, 40 put for 1.21, bought today for .18.
WDC
#shortputs
BTC WDC Feb 1 2019 33.0 put @ 0.05. Sold 2 days ago for 0.50.
SPX 1-dte, sold more
#SPX1dte Sold to close another third of $SPX Jan 25th 2765/2695 long call spreads for 2.25. Now profitable in all accounts. Waiting to watch action to sell last batch.

