
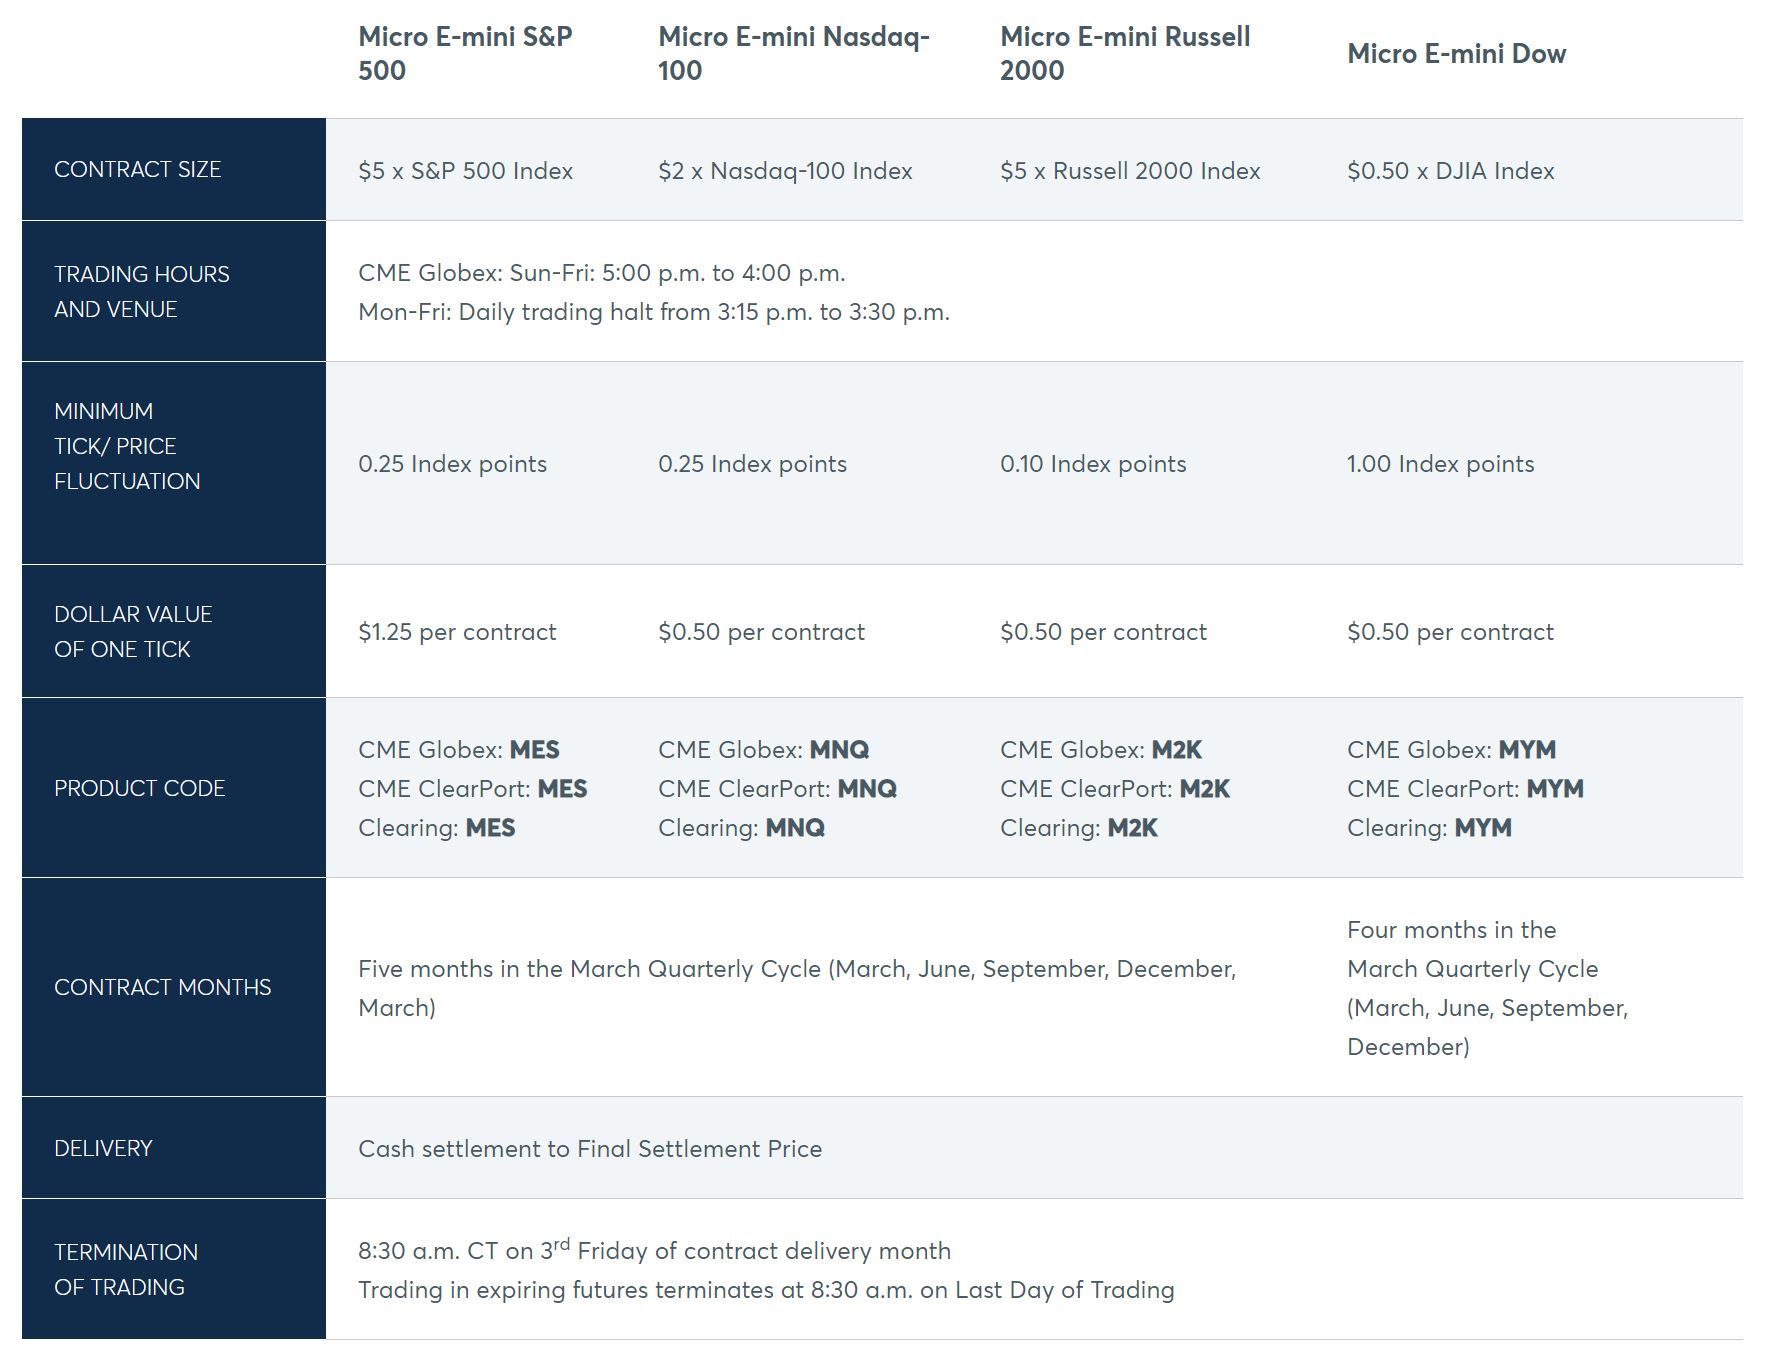
#Futures – Just stumbled across this on twitter…
https://www.cmegroup.com/cme-group-futures-exchange/micro-futures.html
#Futures – Just stumbled across this on twitter…
https://www.cmegroup.com/cme-group-futures-exchange/micro-futures.html
Few trades today:
STO $IRBT 5/31 75/85 bups @1.10
STO $LULU 6/19 145/155 bups @1.65
STO $NFLX 5/24 325/335 bups @.75
STO $SPX 5/20 2865/2880/2785/2800 IC @1.35 – just expired valueless.
Looking at the recent lows from last week and putting on a $BA 330/320 bull put spread for 1.50 credit. Short strike at 20 delta, and below lows from from 5/13-5/15. A test of of those lows back into the 330s and I’ll cut bait.
AVGO down 19 today to 270 or so, was over 320 a couple weeks ago
Replacing Friday’s expirations
OIH June 21, 16 calls for .23
SYMC June 21, 21 call for .33, added a 19 put for .24
MAT June 21, 11.50 call and a 10 put for .47
AA June 21, 26 call for .31
AMD BTC 5/24/19 28.5 CALLS @.12 STO @.67
AMD BTO STOCK 1/2 Position @26.90 Now have a position and a half.
AMD STO 5/24/19 26.5 PUTS @.61
AMD STO 5/24/19 27.0 PUTS @.80
This is the first time I remember seeing this, but the expected move is LESS than the 12-quarter historical move MAXIMUMS. $HD has moved very little on recent earnings, but current IV projects it to move more than it has since Nov 2015.
#Earnings $HD reports tomorrow morning. Below are details on earnings one-day moves over the last 12 quarters.
Feb. 26, 2019 BO -0.88%
Nov. 13, 2018 BO -0.23%
Aug. 14, 2018 BO -0.53%
May 15, 2018 BO -1.62%
Feb. 20, 2018 BO -0.13%
Nov. 14, 2017 BO +1.63% Biggest UP
Aug. 15, 2017 BO -2.65% Biggest DOWN
May 16, 2017 BO +0.59%
Feb. 21, 2017 BO +1.41%
Nov. 15, 2016 BO -2.56%
Aug. 16, 2016 BO -0.60%
May 17, 2016 BO -2.46%
Avg (+ or -) 1.27%
Bias -0.67%, negative bias on earnings.
With stock at 192.00 the data suggests these ranges:
Based on current IV (expected move into Friday per TOS): 185.43 to 198.57
Based on AVERAGE move over last 12 quarters: 189.55 to 194.45
Based on MAXIMUM move over last 12 Q’s (2.7%): 186.91 to 197.09
Based on UP Max only (+1.6%): 195.13
Open to requests for other symbols.
STO January 250 puts @ 4.10
#SPX1dte Tagged my stop level on the opening dip so I’m out with small loss.
BTC $SPX May 20th 2815/2795 put spreads for 1.05. Condors sold for .85 on Friday.
Also, stopped May 31st 2840/2815 put spreads for 8.70. #CondorRoll sold for 6.65 on Thursday.
#Earnings $AZO reports tomorrow morning. Below are details on earnings one-day moves over the last 12 quarters.
Feb. 26, 2019 BO +5.10%
Dec. 4, 2018 BO +6.74% Biggest UP
Sept. 18, 2018 BO -1.97%
May 22, 2018 BO -9.48%
Feb. 27, 2018 BO -11.06%
Dec. 5, 2017 BO +0.42%
Sept. 19, 2017 BO -5.00%
May 23, 2017 BO -11.84% Biggest DOWN
Feb. 28, 2017 BO -0.58%
Dec. 6, 2016 BO +0.43%
Sept. 22, 2016 BO -0.42%
May 24, 2016 BO +2.47%
Avg (+ or -) 4.63%
Bias -2.10%, negative bias on earnings.
With stock at 985.00 the data suggests these ranges:
Based on current IV (expected move into Friday per TOS): 925.51 to 1,044.49
Based on AVERAGE move over last 12 quarters: 939.44 to 1,030.56
Based on MAXIMUM move over last 12 Q’s (11.8%): 868.38 to 1,101.62
Based on UP Max only (+6.7%): 1,051.39
Open to requests for other symbols.
