
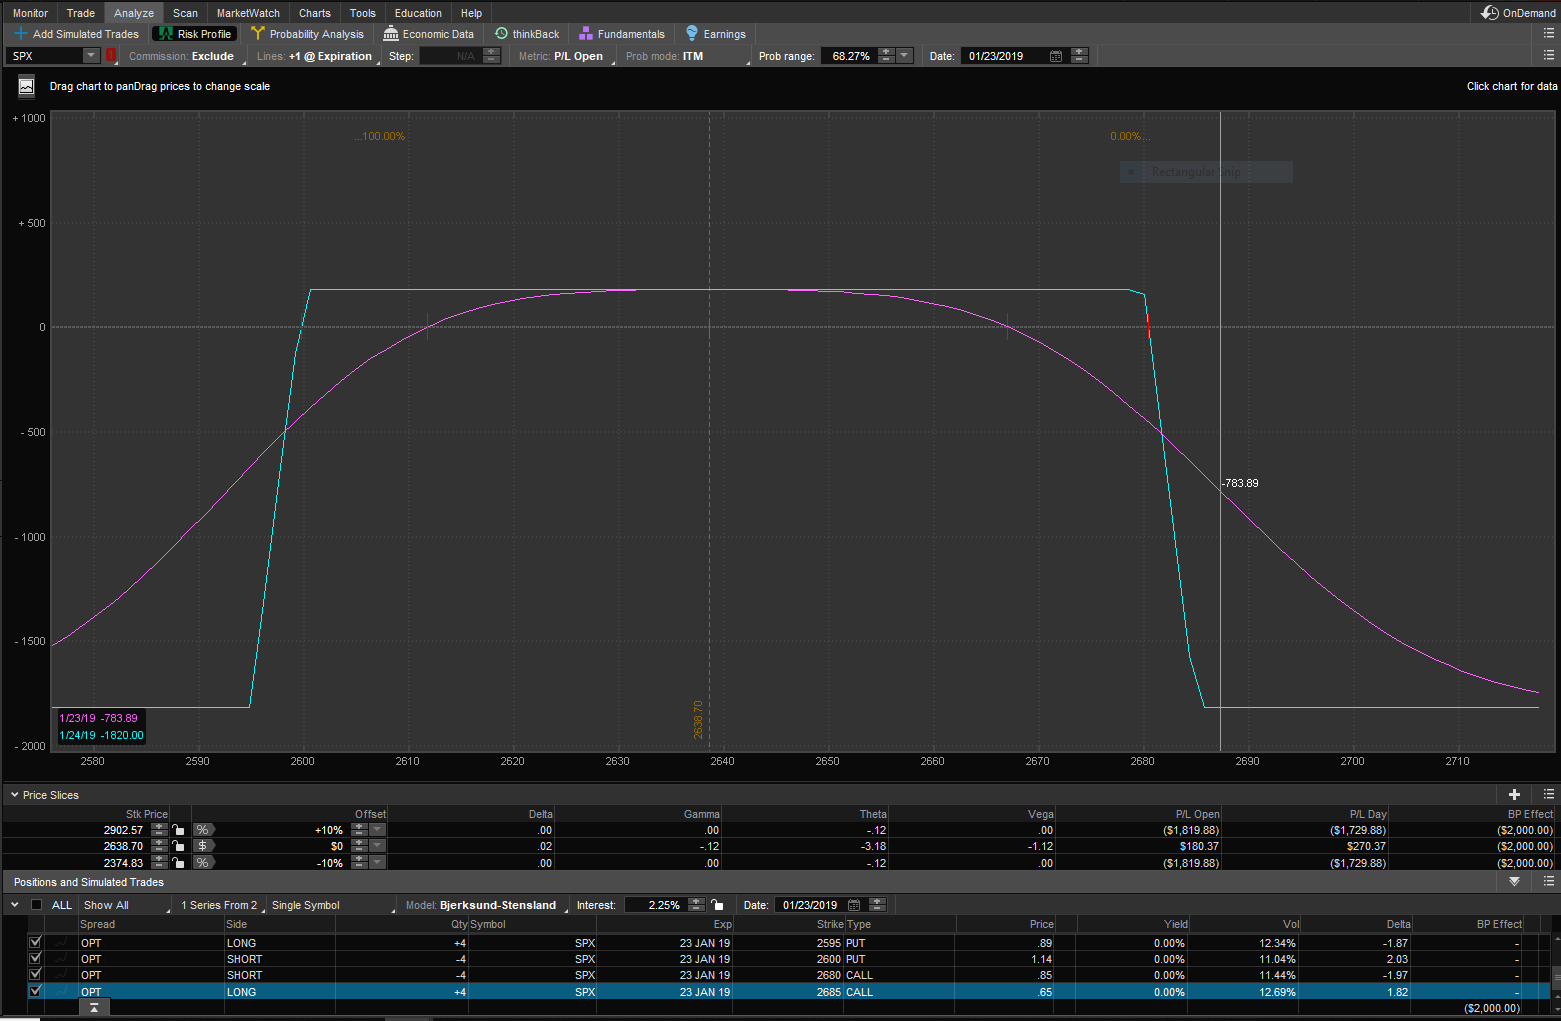
SPX Jan23 IC 2595/2600/2680/2685 Put/Call expired. Sold 6 lots at .45 yesterday, 4 in one account and 2 in another. After two harrowing days of defending ICs that breached or nearly breached the short side, today’s closing risk profile was gratifying.
#spx1dte
Daily Archives: Wednesday, January 23, 2019
WDC
#ShortPuts
Sold WDC Feb 01 2019 33.0 Put @ 0.50
Willing to take stock if it falls that much after earnings this week.
URI Earnings
#ShortPuts #Earnings – Had pretty good luck with this one in the past. Just selling a put out in Feb monthly so not technically an earnings play but should have some volatility crush in the monthlies. Wouldn’t mind owning a little…
Sold URI Feb 15 2019 105.0 Put @ 2.30
STX
#CoveredCalls – Full position now sold in earnings week…
Sold STX Feb 08 2019 41.0 Call Limit @ 1.11
#shortstock MO Back in ,…
#shortstock MO
Back in , sold short 100 shares at 44.71, left too early the other day.
A TRADE:
HIIQ STO 2/15/19 31.0 PUTS @1.10
TQQQ
STO January 2021, 65 calls against my 2021 60 calls. The 65 calls were sold at 6.27 average price. Yesterday I bought the TQQQ stock at 43.25 to cover the 55 calls that I sold previously at 6.05
TQQQ
#CoveredCalls – Sold TQQQ Mar 15 2019 50.0 Calls @ 1.15
TNA
#CoveredCalls – Sold TNA Feb 15 2019 58.0 Calls @ 1.02
LABU
#CoveredCalls – Sold LABU Feb 15 2019 49.0 Call @ 1.96
#earnings LRCX Sold Feb. 15,…
#earnings LRCX
Sold Feb. 15, 120/160 strangle for 1.78. I would do something similar with XLNX but the last 2 reports, up 9.5 and 15% concern me.
Thanks for the data Jeff.
TRADES:
ROKU STO 1/25/19 CALLS @.60
AMD STO 2/1/19 18.0 PUTS @.52
SFIX STO 1/25/19 22.0 PUTS @.60 ITM
AMD STO 1/25/19 20.0 PUTS @.61 ITM
Closing NFLX short calls
Bought to close $NFLX Feb 15 385 calls @ .50. Sold for 2.60 on 1/18.
LRCX earnings analysis
#Earnings $LRCX reports tonight. Below are details on earnings one-day moves over the last 12 quarters.
Oct. 16, 2018 AC +1.31%
July 26, 2018 AC +7.19% Biggest UP
April 17, 2018 AC -4.03%
Jan. 24, 2018 AC -4.99% Biggest DOWN
Oct. 17, 2017 AC +3.05%
July 26, 2017 AC -2.12%
April 18, 2017 AC +6.85%
Jan. 25, 2017 AC -2.21%
Oct. 19, 2016 AC -2.78%
July 27, 2016 AC +1.21%
April 20, 2016 AC -2.23%
Jan. 27, 2016 AC +2.88%
Avg (+ or -) 3.40%
Bias 0.34%, slight positive bias on earnings.
With stock at 138.00 the data suggests these ranges:
Based on current IV (expected move into Friday per TOS): 130.44 to 145.56
Based on AVERAGE move over last 12 quarters: 133.30 to 142.70
Based on MAXIMUM move over last 12 Q’s (7.2%): 128.08 to 147.92
Open for requests on other symbols.
XLNX earnings analysis
#Earnings $XLNX reports tonight. Below are details on earnings one-day moves over the last 12 quarters.
Oct. 24, 2018 AC +15.00% Biggest UP
July 25, 2018 AC +9.59%
April 25, 2018 AC +1.69%
Jan. 24, 2018 AC -5.08%
Oct. 25, 2017 AC -0.12%
July 26, 2017 AC -2.26%
April 26, 2017 AC +7.35%
Jan. 25, 2017 AC -3.67%
Oct. 19, 2016 AC +0.96%
July 27, 2016 AC +2.50%
April 27, 2016 AC -8.70% Biggest DOWN
Jan. 20, 2016 AC +8.58%
Avg (+ or -) 5.46%
Bias 2.15%, positive bias on earnings.
With stock at 88.50 the data suggests these ranges:
Based on current IV (expected move into Friday per TOS): 82.47 to 94.53
Based on AVERAGE move over last 12 quarters: 83.67 to 93.33
Based on MAXIMUM move over last 12 Q’s (15.0%): 75.23 to 101.78
Open for requests on other symbols.
#earnings Jeff do you have…
#earnings
Jeff do you have data on a couple symbols I don’t think anyone here has reported trading-LRCX and XLNX? Thank you again.
SPX 1-dte
#SPX1dte Upside stop level was hit early, but now pulling back sharply.
Closed the short puts for .05. Looking to close short calls for best price I can get.
Trade sold yesterday for .95: $SPX Jan 23rd 2555/2575-2665/2685
SPY 21dte ladder
Sold SPY Feb13 IC 274/276/251/249 CALL/PUT @.49.
With SPX caught between support and resistance and volatility a little elevated, I added a layer to my ladder. Not a Tide trade.
#spycraft
FFIV earnings analysis
#Earnings $FFIV reports tonight. Below are details on earnings one-day moves over the last 12 quarters.
Oct. 24, 2018 AC +6.10%
July 25, 2018 AC +1.07%
April 25, 2018 AC +0.89%
Jan. 24, 2018 AC -5.05%
Oct. 25, 2017 AC +3.97%
July 26, 2017 AC -7.16%
April 26, 2017 AC -7.50%
Jan. 25, 2017 AC -8.25% Biggest DOWN
Oct. 26, 2016 AC +9.57% Biggest UP
July 20, 2016 AC +0.32%
April 20, 2016 AC +5.53%
Jan. 20, 2016 AC -0.56%
Avg (+ or -) 4.66%
Bias -0.09%, no significant positive or negative bias.
With stock at 159.00 the data suggests these ranges:
Based on current IV (expected move into Friday per TOS): 149.10 to 168.90
Based on AVERAGE move over last 12 quarters: 151.58 to 166.42
Based on MAXIMUM move over last 12 Q’s (9.6%): 143.78 to 174.22
Open for requests on other symbols.
